


By Joseph D’Aleo, Weatherbell.com
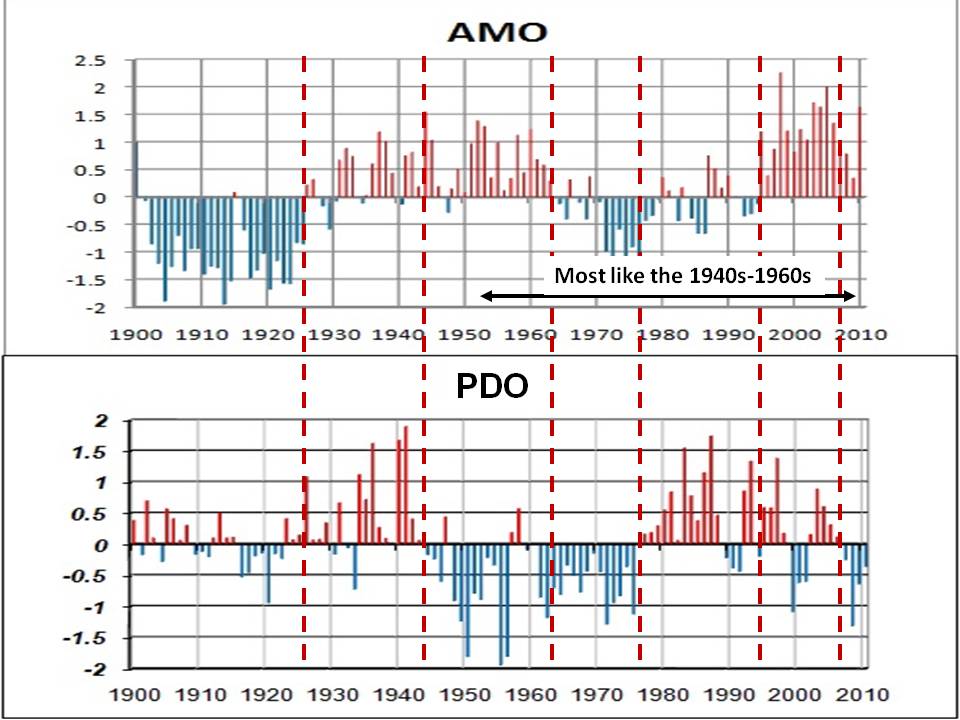
We are heading back to the 1950s in our climate and weather. With a positive AMO (last month +0.90 STD) and a negative PDO (last month -1.26 STD), we are most like the early to middle 1950s and late 1950s to early 1960s. Notice how we were in this mode after the super El Nino of 1998 for several years before the strong El Nino fo 2002/03 and the strong second solar max reverted us back to a positive PDO. After 2007, the PDO has settled into the cold Pacific and warm Atlantic mode.
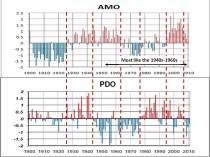
Some believe the warm Atlantic mode actually began in the late 1980s which may have helped Hugo in 1989 before Pinatubo and Cerro Hudson in 1991 like El Chichon in 1982 may have cooled the Atlantic like it cooled the globe. The Atlantic returned warm in 1995. Dr Bill Gray has shown the warm AMO favors more Atlantic Basin storms and increased landfalls. East coast landfalls are more likely when the Pacific is cold (Irene last year). Weatherbell’s Joe Bastardi predicted overall activity would be down this year though above the normal with slightly cooler tropics and El Nino but that storms would tend to develop close to the mainland (as 3 of the first 4 did). We also believe the east coast is again vulnerable as it was in the 1950s.
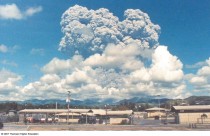
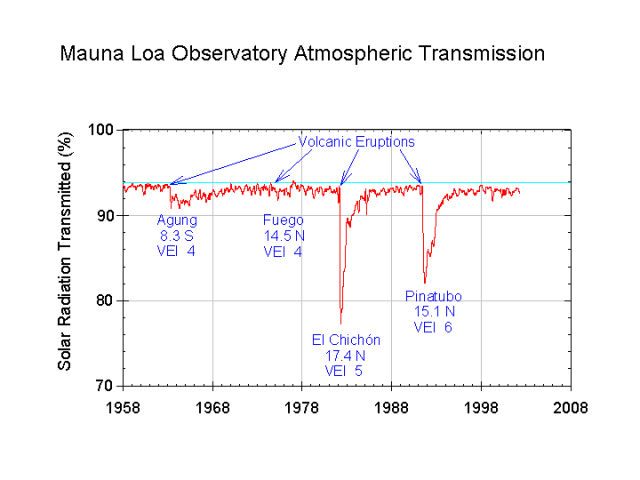
El Chichon 1982 above and Pinatubo 1991 below
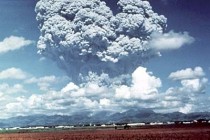
Note how much blockage of solar radiation occurred at Mauna Loa from these major eruptions. That cooled the land and the oceans (most notably the Atlantic). The volcano enhanced El Ninos (weakened Hadley circulation and weakened easterlies allowing warm water from the western tropical Pacific to come east) kept the PDO positive.

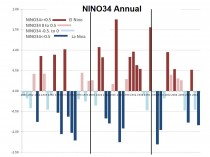
You can see how the La Ninas are favored in the cold modes and El Ninos in the warm mode. This is annual NINO34. We usually see ENSO peak in the October to February time frame. See how after the 2002 El Nino and second solar max, the PDO popped positive then gradually faded in the first graph above and how NINO34 behavior followed suit.
Is there evidence for the 60 year cycle elsewhere in climate and nature? Most defintely as nicely shown in more detail here by Alan Cheetham.
(1) AMO (approximately 62 years) as seen in the first graph
(2) PDO (approximately 60 years) as seen in the first graph
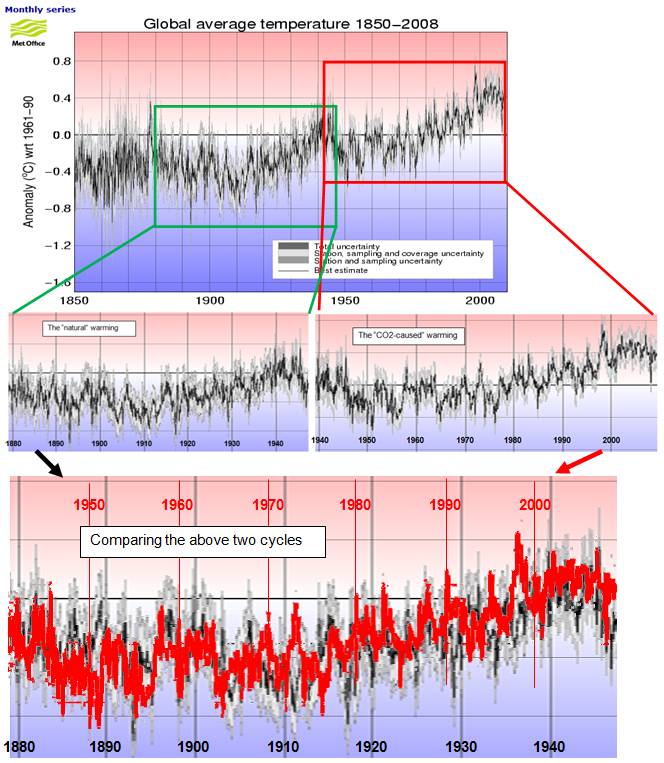
(3) Global temperatures (60 years)
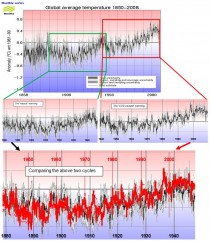
See how the warming from 1888 to 1940 parallelled the 1950 to 2000 warming
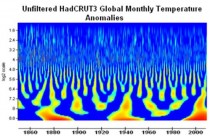
The following figure is from a study by Basil Copeland and Anthony Watts, showing a Morelet wavelet analysis of the HadCRUT3 global temperature anomalies [link] The ~62-year cycle is clearly visible.
(4) Southwest drought (64 years)

We are heading to a phase where southwest drought is more likely (consistent with a warm AMO and cold PDO with more and stronger La Ninas).
(5) Atmospheric Circulation Index (zonal versus merdional) (60 years)
We were more zonal than normal a decade or so ago and this helped make AO+ and produce less extremes by producing more variability. Now we are heading down into very meridional territory like the 1950s and 1960s and 1970s when extremes were common, when major troughs and ridges dominated and tended to persist produce great extremes.
(6) ENSO state frequency (60 years)
Here as shown we are back in a La Nina favored mode due to -PDO. We get more frequent, often multi-year La Ninas and briefer El Ninos.
(7) Thermohaline circulation (60 years)
We are in a strong phase favoring +AMO.
(8) ITCZ strength and location (60 years)
(9) Length of Day (LOD) which may influence climate and FAO reports correlates well with fish catches. Ties well with ACI in 5 above
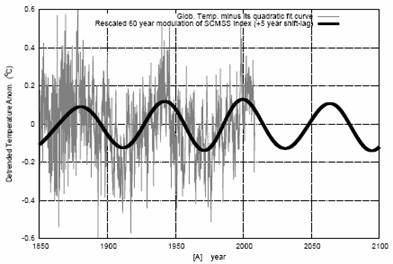
What is behind a 60 cycle? You probably would not be surprised it is the sun/solar system.
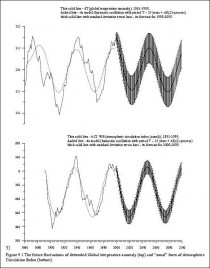
Nicola Scafetta has identified the change in the location of the center of mass of the solar system (CMSS) as a possible mechanism driving the 60-year cycle. (Scafetta, N., “Empirical evidence for a celestial origin of the climate oscillations and its implications”, Journal of Atmospheric and Solar’Terrestrial Physics (2010)
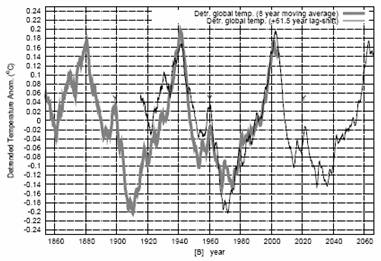
Scafetta shows the following figures described as: ([A- (top)) Rescaled SCMSS 60 year cycle (black curve) against the global surface temperature record (grey) detrended of its quadratic fit; (B- (botttom)) Eight year moving average of the global temperature detrended of its quadratic fit and plotted against itself shifted by 61.5 years. Note the perfect correspondence between the 1880-1940 and 1940-2000 periods. Also a smaller cycle, whose peaks are indicated by the letter “Y”, is clearly visible in the two records. This smaller cycle is mostly related to the 30-year modulation of the temperature. These results reveal the natural origin of a large 60-year modulation in the temperature records.” (SCMSS – Speed of the CMSS)


Enlarged
So in summary what can we expect for the next say 10 years?
(1)Temperatures globally which stopped rising in 1997 will begin accelerating down
(2) More meridional patterns and reduced variability which translate into more extremes - warm and cold, floods and droughts
(3) More southwest, southern and central drought and global droughts and floods
(4) More La Ninas - stronger and longer lasting. Briefer, weaker El Ninos
(5) More hurricanes and landfalls in the Atlantic
(6) More La Nina impacts including hurricanes, tornadoes, floods, winter snows north (south and east in the occasional El Ninos)
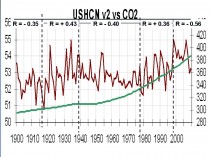
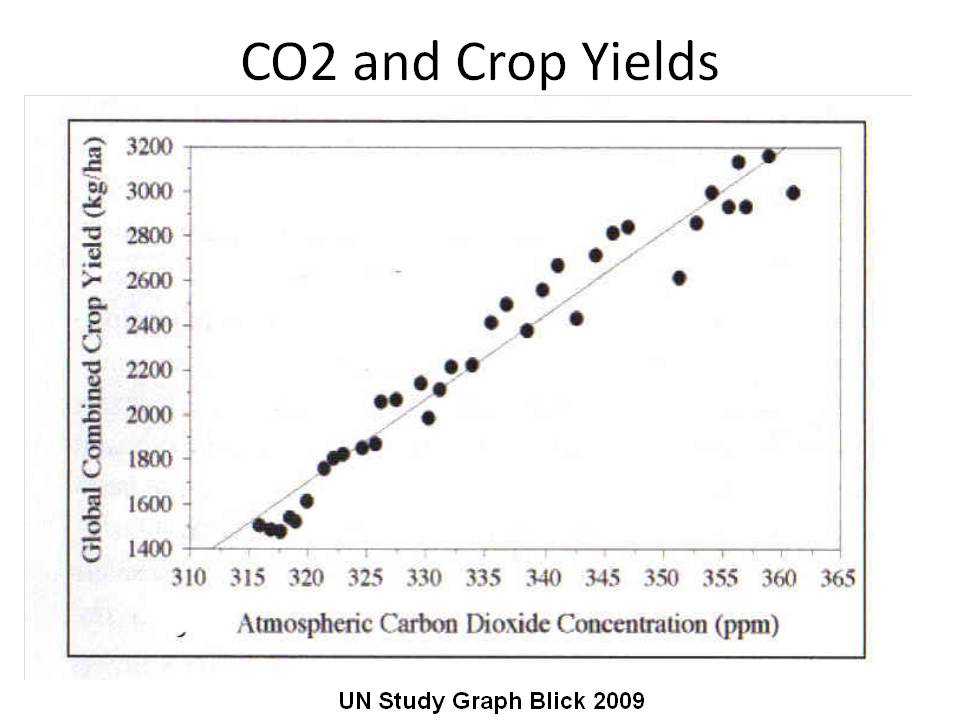
All of this will of course be attributed to CO2 even though CO2 doesn’t correlate with the changes shown and is a beneficial gas that increases crop yields .
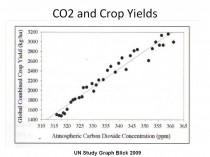
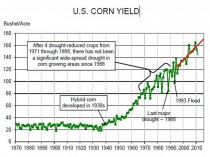
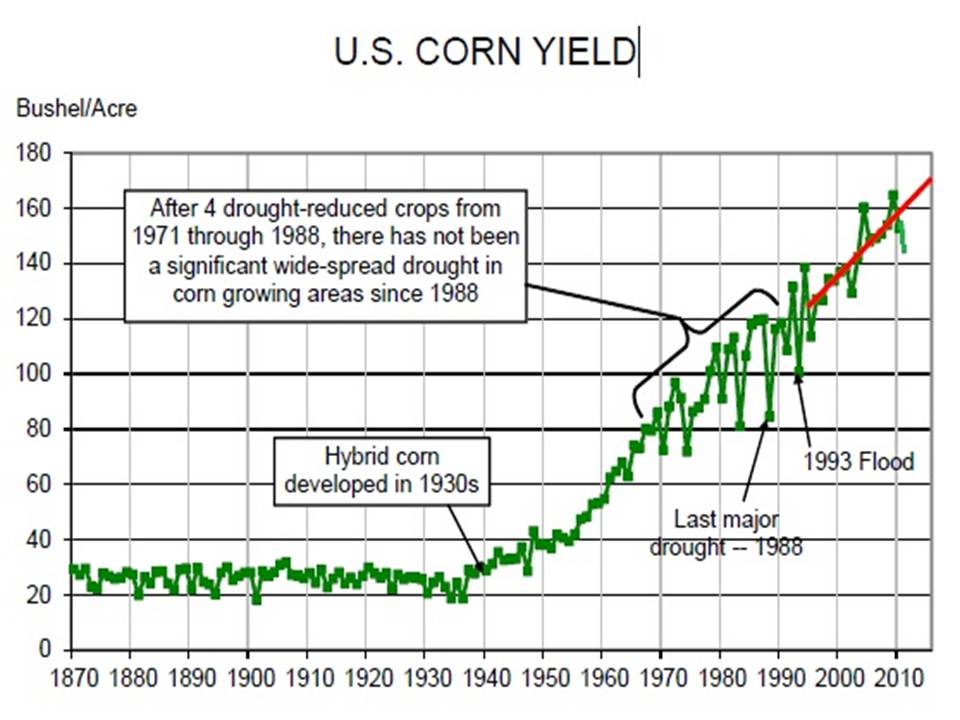
This year yields will drop dramatically for the third straight year, this yyear with tens of billions of dollars in crop losses likely. In 1988, the last major drought, losses were over $80B (2008S). Yields can be reduced by droughts and as in 1993 by massive floods). This ties into the ACI above. When the patterns are very meridional they are subject to persistence and extremes. That was the reason for the 1910s, 1930s and 1950s droughts. and the 1988 drought. See much more on similarities to 1988 and 1911 in posts on Weatherbell.com this week.
US climate annual temperature have fallen in 67 years and risen in only 44 years since 1895 while CO2 has risen, not a very convincing driver.
We are told, natural variability has been ruled out. It seems to me they never seriously looked. These are the same folks (including Mann and Schmidt) who this week admitted they didn’t the difference between a derecho and the Geico gecko.