


By Anthony Watts, Watts Up With That
Last summer I attempted to do a survey of Reno’s USHCN official climate station. But I was thwarted by its placement at the Reno International Airport due to security and lack of accessible photographic vantage points. Reno’s USHCN station is particularly important due to it being part of the test cases of stations in the new USHCN2 scheme being implemented by NCDC. It’s also important due to it’s steep temperature trend which appears to be more of an urban heat island (UHI) issue than a climate change issue. It shows up as a hot spot in USHCN contours done by Steve MacIntyre
While there wasn’t good Google Earth photography online last summer, that has since been remedied, and high resolution photographs are now available at Google Earth and at Microsoft’s Live Earth. Having these, I was able to complete the station survey and determine that this station is a CRN4 rating due to proximity to the ILS building with a/c exhaust vents, less than 10 meters away. A CRN4 rating is unusual for an ASOS station.
In wondering about just how this placement between runways on a darker surface environment might contribute to the upward trend in the GISS temperature graph shown above, I did some searching online and soon discovered that NOAA uses Reno’s placement problems as an example in a training manual for climate monitoring COOP managers. They’d already done all the work for me! More on that internal NOAA training manual later, as it has provided a wealth of information previously undisclosed. What is striking about this is that here we have NOAA documenting the effects of an “urban heat bubble” something that Parker 2003 et al say “doesn’t exist”, plus we have inclusion a site with known issues, held up as a bad example for training the operational folks, being used in a case study for the new USHCN2 system. From the manual: “Reno’s busy urban airport has seen the growth of an urban heat bubble on its north end. The corresponding graph of mean annual minimum temperature (average of 365 nighttime minimums each year) has as a consequence been steadily rising.”
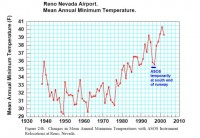
From the NOAA Internal Training Manual
It seems that Parker is looking more and more foolish with his attempts to make UHI “disappear” when NOAA references UHI problems with station placement in their own training manuals. Read more here.