


By Ross McKitrick, U of Guelph
Dear Colleagues
Following my testimony before the House Energy and Air Quality Subcommittee in Washington last summer, chairman John Dingell sent me a letter asking a set of follow-up questions. I am told by a staffer in DC that this was somewhat unusual because the deadline for on-the-record questions closed a long time ago. However, I was pleased to be given the opportunity to elaborate. I have attached my letter, in case you are interested in the questions and my answers. I have posted this letter here.
Cheers,
Ross
Icecap Note: The second link above provides a long litany of peer review work by Ross et al relative to the Hockey Stick and global temperatue observation issues. It is a very comprehensive source and a real credit to Ross for the continuing stream of good work he has done alone and with others over the past decade to correct the misleading and erroneous information provided by the IPCC, CCSP, MBH and friends and of the national data centers.
The first link is his very detailed letter to Chairman Dingell. It is a credit to Chairman Dingell that he actually care about getting at all the facts. We will not be able to provide more than just a few excerpts of 1 of Ross’s reponses here.
The third question was “Is the tropical troposphere more or less sensitive to climate change than the troposphere at the poles?”. Ross responded “I believe you mean “more or less sensitive to greenhouse gases”. I will answer the question first with reference to the predictions of models and then with reference to the observed data.
Climate models in which greenhouse gases are assumed to be capable of causing significant global warming show greater sensitivity to greenhouse gases in the troposphere over the tropics than over the poles. The US Climate Change Science Program (CCSP) presented very similar results for a more recent interval. The CCSP report (Figure 5.7, p. 116) presented an atmospheric weather balloon series for the interval 1979-1999, (Hadley AT2) in a format similar to the backcast panels. You can see the comparison below. This balloon record exhibits no overall warming pattern in the tropical troposphere: instead here is slight cooling at lower altitudes, and minimal warming at the upper altitudes. The tropospheric warming is at a lower rate than in the troposphere as a whole and lower in comparison to the North Pole region. The CCSP text (fn 66, p.115) points out that this data span includes the ‘end-point effect’ of the powerful 1998-1999 El Nino so the absence of tropical tropospheric warming is an even more conspicuous discrepancy with the models.
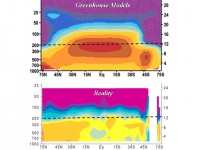
See larger image here
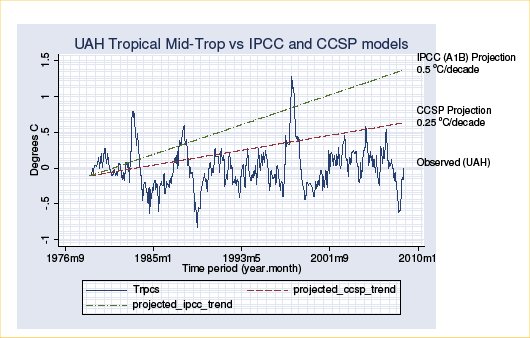
Weather satellite records for the mid-troposphere are available from Remote Sensing Systems (RSS) in California and the Earth Systems Science Center at the University of Alabama-Huntsville (UAH). I obtained the data from each lab for the mid-troposphere layer covering January 1979 to September 2008. Over this interval the annual average atmospheric concentration of CO2 measured at Mauna Loa Hawaii rose from 337 ppm to 384 ppm, a 14% increase. I have graphed the RSS and UAH tropical mid-troposphere series and compared them to the CCSP- and IPCC-predicted trends (0.25 C/decade and 0.5 C/decade respectively). In contrast to climate model predictions the data indicate neither significant warming in the tropics nor greater warming than at the poles.
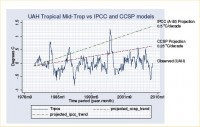
See larger image here
Read much more detail on this issue and the other questions Dingell asked here.