


By Joseph D’Aleo, AMS Fellow, CCM
In another fable on Climate Progress, chief alarmist blogger Joseph Romm claims “The climate story of the decade is that the 2000s are on track to be nearly 0.2C warmer than the 1990s. And that temperature jump is especially worrisome since the 1990s were only 0.14C warmer than the 1980s (see datasets here). Global warming is accelerating, as predicted.”
Nothing could be farther from the truth. Of course he chooses to use the bogus GHCN/ GISS global data which is contaminated from many factors (see this EPA comment on the data issues with this data set). The issues include global station dropout (6000 to under 2000 with just over 1000 used last month). Most of the dropout occurred after 1990 and most stations that dropped out were rural. There was a tenfold increase in missing monthly data after 1990, requriing infilling of missing month using surrounding months or nearest urban stations. Both these lead to warm biases. There was a change of instrumentation that Karl of NCDC showed led to a warm bias.
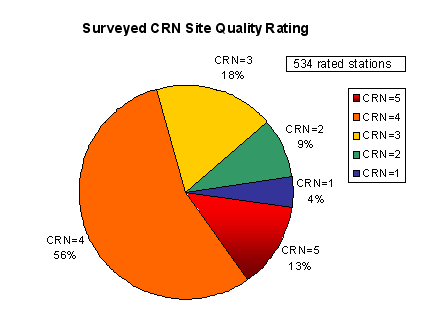
After Roger Pielke Sr and others did a survey of stations in eastern Colorado and found the vast majority did not meet government standards including the climate stations, Anthony Watts started a volunteer effort to survey US climate stations in the 1221 USHCN network using the governments own criteria on surfacestations.org. About halfway through that assessment, he has found only 4% have met standards and 69% were poor or very poorly sited. All of these factors introduce a warm bias.
The most important factor though is urbanization. In order to show the warming that verifies their own models, NASA, NOAA and Hadley has using bogus research by Petersen and Parker to downplay or even remove the urban adjustment (USHCN V2 removed the USHCN V1 Karl urban adjustment based on his 1988 paper when he was an unbiased climatologist). The EPA paper lists numerous peer review papers from some of the pioneers in the field (Landsberg, Oke) that show that even small towns produce a localized warming (3F for a town of 1000 in winter) - papers Karl used in 1988. And then there are the oceans which cover 70% of the globe. The measurements over the oceans are subject to their own set of data accuracy issues.
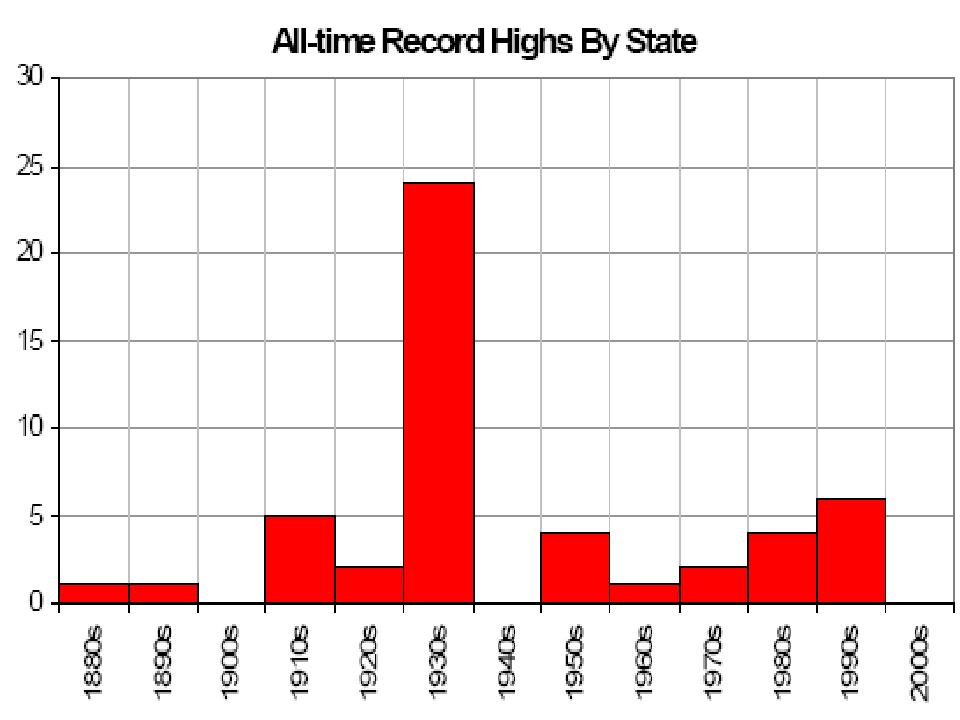
At least a half dozen peer reviewed papers in recent years have shown these issues could exaggerate the warming by 50% the last century. That being the case, not only is the 2000s not the warmest decade the last century or millenium as some radicals claim, it not likely the warmest decade the last 70 years (the 1930s would take that prize as the state records imply). On top of all these issues, the data centers, make frequent arbitrary adjustments to the raw data, (a story for another day, addressed to some degree in the EPA comment above). There adjustments always show a cooling of the older decades especially the 1930s and 1940s and a warming of the 2000s. Like flipping a coin a dozen times and getting heads every time. Not statistically impossible, but highly improbable.
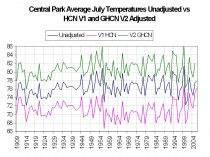
To show the difference from the raw to the various data sets, I go back to my home town and Central Park. Below in a plot of three NOAA versions of Central Park July average monthly data (1909-2007) temperatures - observed raw which can be downloaded from the local NWS site, the USHCN V1 data with Karl’s urban adjustment applied and the GHCN global data for Central Parl which inexplicably warms the raw data. The difference between the USHCNv1 and GHCN is an incredible 11F for much of the record until the 2000s when the urban adjustment was reduced from 6F to less than 2F (even as the population grew).
Larger image here
If our own government can’t decide what the right temperature for the nation’s premier city with a stable well documented observing site to within 11F, how can we trust the government to be able to tell us whether we are warming a few tenths of a degree F and make trillion dollar decisions based on this assessment.
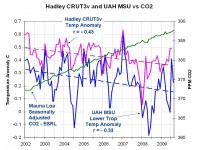
Though they are worthless for long term trends, the station based data bases can be used over short time frames. The satellites are the most accurate and objective source. They provide more complete coverage and are not subject to the same issues. They integrate any urban warmth in with rural. Unfortunately they only go back to 1979. Temperatures peaked in the El Nino year of 1998 and have not exceeded that level since. Since 2002, a very clear downtrend is seen in this plot of the Hadley CRUT3v global station and ocean data and the UAH MSU data (about 0.3F).
Larger image here
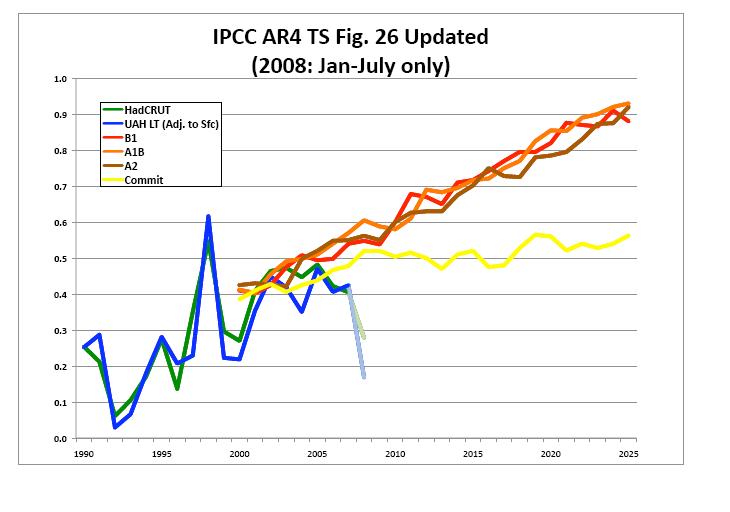
His claim warming is accelerating AS FORECAST is also belied by the plot of the IPCC forecast from just two years ago (source John Christy) which shows the various global growth and emission scenarios (yellow being no change in CO2) and actual temperatures (green and blue). I see a forecast that is busting badly. If the warming continues at this accelerated rate as Romm claims, by 2030 we will all be frozen to death.

Larger image here.
Help us fight this nonsense. Please see this letter