


By Joseph D’Aleo, CCM
Roy Spencer announced why the November global Lower troposphere temperature is late this month.
There has been a delay in our monthly processing of global temperature data from AMSU.
An undersea telecommunications cable used to transmit about half of the huge volume of data coming from the Aqua satellite was cut in late November off the coast of the Netherlands, delaying receipt of that data. While there were redundant data transmission capabilities, apparently both failed.
Also, John Christy and I have been on separate travels quite a bit lately (I spent 2 weeks in Miami after my daughter had an emergency C-section - I’m a grandpa!) and now I’m at the AGU in San Francisco, with a trip to DC early next week, so monitoring of the situation has been difficult.
CONGRATULATIONS GRANDPA ROY.
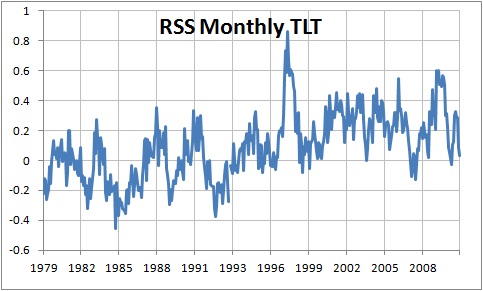
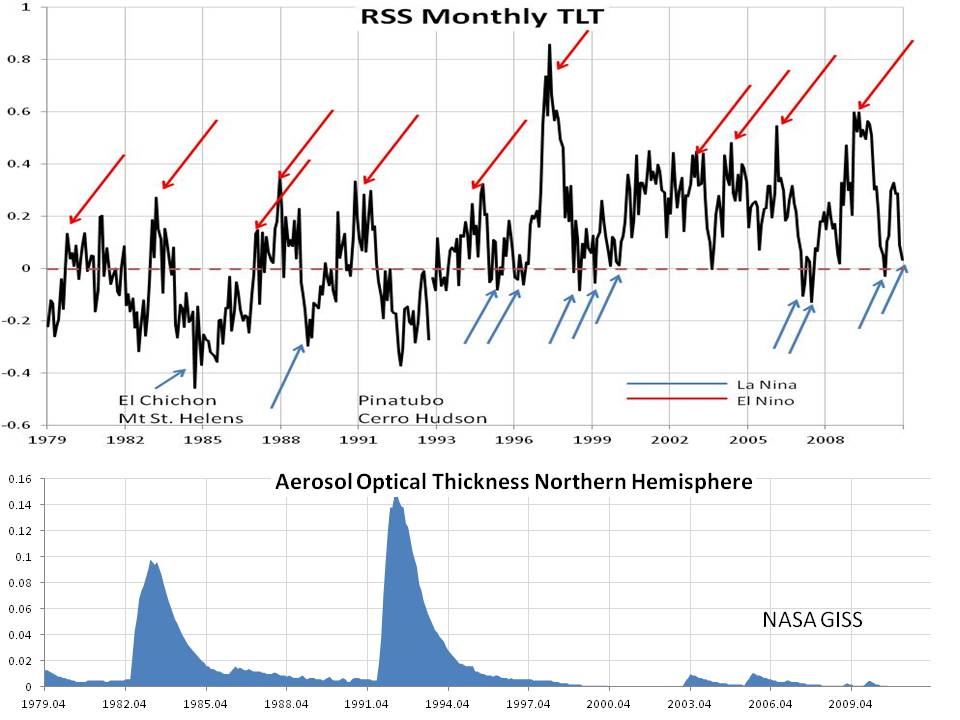
RSS did update their November data. It is down to 0.033C.
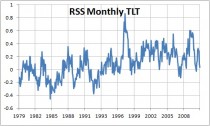
You can explain virtually all the excursions with El Nino, La Nina and volcanism (here indicated by the satellite derived aerosol optical thickness). High aerosol content as we saw in early 1980s and 1990s leads to global cooling and low aerosols (late 1990s through mid 2000s) warming through more insolation.

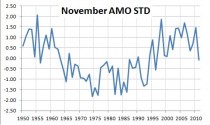
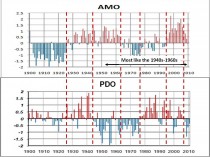
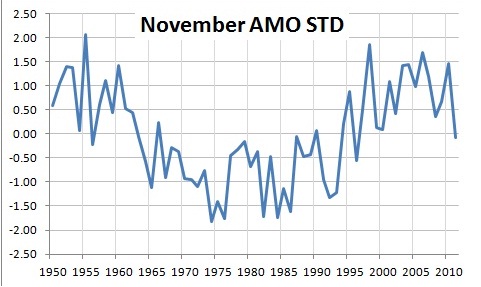
Wednesday we reported the AMO came in negative. The AMO had been negative a few years back for 5 months during the last La Nina cooling period, But popped positive in the super blocking El Nino year 2009/10. A lack of storms in the blocking high region and suppression of the subtropical high south resulted in less mixing up of cold water. It also meant less upwelling off Africa of cold water and also more trade wind zone sunshine. The Atlantic warmed in high and low latitudes in the Northern Hemisphere and AMO popped to over 1.5 STD
Now with a positive AO/NAO and an active north Atlantic storm track and more upwelling, the AMO has taken a dive. For November it is the lowest temperature since 1995.
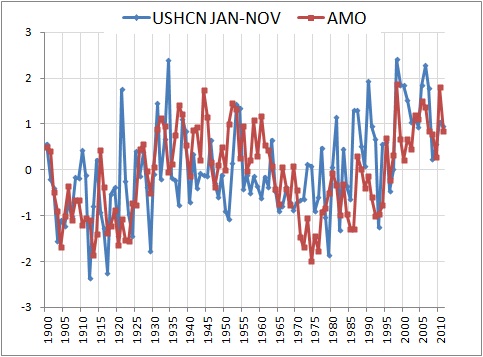
Above is how the AMO tracks with US temperatures since 1900.
(Vukcevic 2011).Global importance of the AMO is underlined by the recent Berkeley Earth Project: We find that the strongest cross-correlation of the decadal fluctuations in (global) land surface temperature is not with ENSO but with the AMO
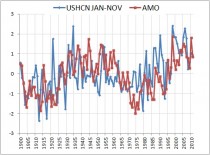
The Pearson coefficient R = 0.458 for the AMO alone, the highest of any single factor.
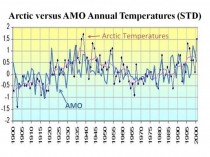
The arctic temperatures corrrelate very well with the AMO. Warm Atlantic temperatures move into the arctic and thin the ice from the bottom. It IS NOT CO2. This happened before as can be seen clearly here, related to AMO. Anecdotal data suggests a similar warming and ice thinning in the 1800s warm AMO period.
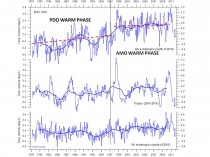
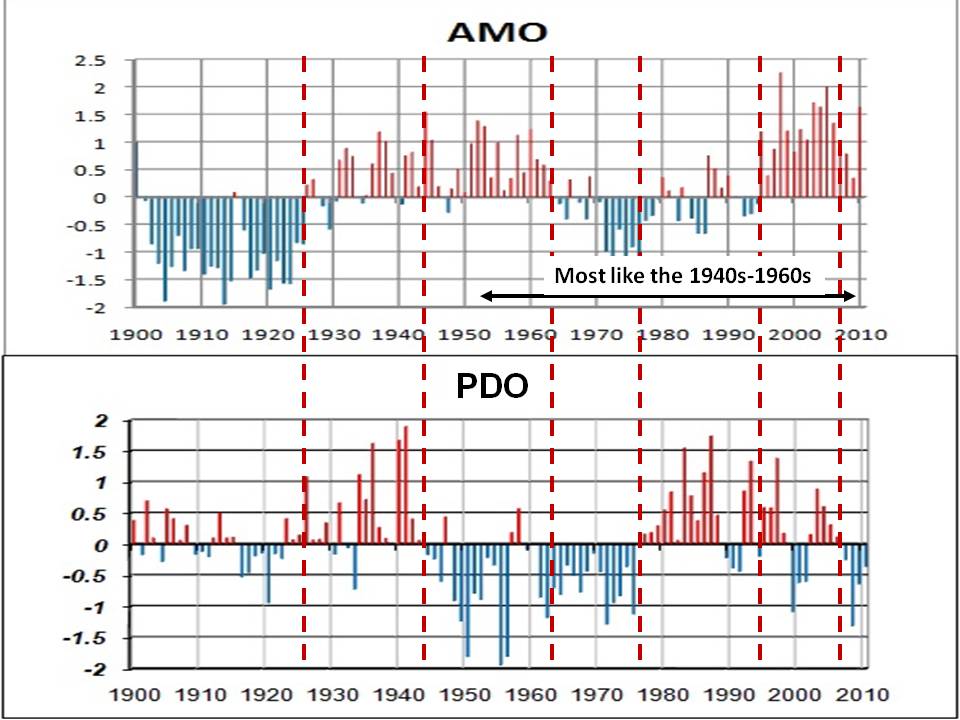
In general you can explain global temperature changes with the PDO (warming from 1977 to 1998) and AMO (warm after 1995) and volcanism. Note little change in tropics and Southern Hemisphere which suggests warming is not global.
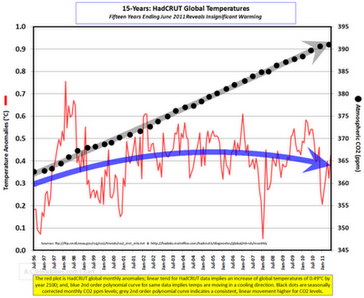
While temperatures flatlined or fell, CO2 rose the last 15 years.
