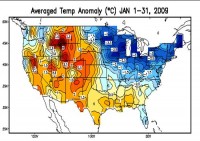
Chicago ended January with a monthly average of 15.8, 6.2F below normal, which made it the 10th coldest in 137 years. The coldest last month was -18F on the 16th.
Jan Average(F)
1977 10.1
1912 11.9
1893 12.1
1982 12.2
1979 12.4
1963 13.3
1918 13.3
1985 14.4
1888 14.9
2009 15.8
1994 15.9
1978 15.9

Larger map here.
Chicago was not alone, with most areas of the central and northeast well below normal. See for example Marquette, MI where it ranked, 7th coldest. In Boston, January averaged 4.5 degrees below normal with no January thaw. Just two days touched 40F.
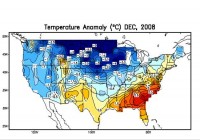
In December, Chicago averaged 22.9F, 4.5 colder than normal and the 18th coldest in 137 years.
Dec Average (F)
1983 14.3
2000 16.0
1985 17.0
1989 17.4
1963 17.9
1872 18.4
1876 19.4
1950 19.6
1976 20.0
1903 20.1
1919 21.4
1909 21.7
1944 22.0
1945 22.2
1958 22.4
1917 22.5
2008 22.9
For the December to January period, it ranked 10 coldest in 139 years.
Dec/Jan Average (F)
1976/77 15.05
1983/84 15.70
1892/93 17.80
1917/18 17.90
1981/82 18.55
1903/04 18.90
1872/73 19.00
1962/63 19.15
1978/79 19.25
2008/09 19.35
1985/86 19.90
1919/20 20.10
1977/78 20.30

Larger map here.
See PDF here with December and January rankings. It should be noted Chicago was not ground zero, It was colder to the north and west, but Chicago data was more readily available and generally representative of the cold central. See this about eastern Michigan where it was a top ten coldest Januarys. This is from western Michigan. This is from southern Wisconsin.
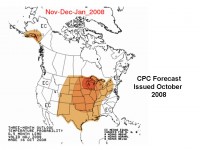
Here was the October 16th, 2008 CPC forecast for November, December and January based mainly on trends (NCDC engineered global warming).

Larger map here.
How is global warming doing as a forecast tool?
By the way after a cold few days and a week or roller coast temperatures, an extremely interesting last half of February appears to be in the cards with widespread cold and a suppresed jet stream, massive polar high pressure across the north entrenched in Canada and an active southern storm track along the boundary.


