


By Joseph D’Aleo
Update: a very small sunspot group of two specks formed on the sun in the final hours of the month Monday according to NOAA SWPC, their monthly sunspot number will be positive (though very small - likely 0.2 or 0.3, the lowest of this solar minimum but not a zero month). SIDC in Belgium, the official source said 28 observatories did not see a countable spot and had a preliminary 0 number for the month (here).
Sunday, August 30th marked the 51st straight day without a sunspot, one of the longest stretches in a century. One more day and we would have had a spotless month but like last August some observatories saw a spot on the sun for a few hours one day. It would have been either the first or second spotless month since 1913 depending on whether you count last August as spotless. It is unclear whether such small specks would have been seen in 1913.
In fact it rises into 4th place among all spotless periods since 1849 (first table here). Note: It is 5th place if you accept a spotless August 2008 which would have led to a stretch of 52 days. The total number of spotless days this transition from cycle 23 to 24 is now 704, exceeding the number for cycle 15 in the early 1900s (below, enlarged here).
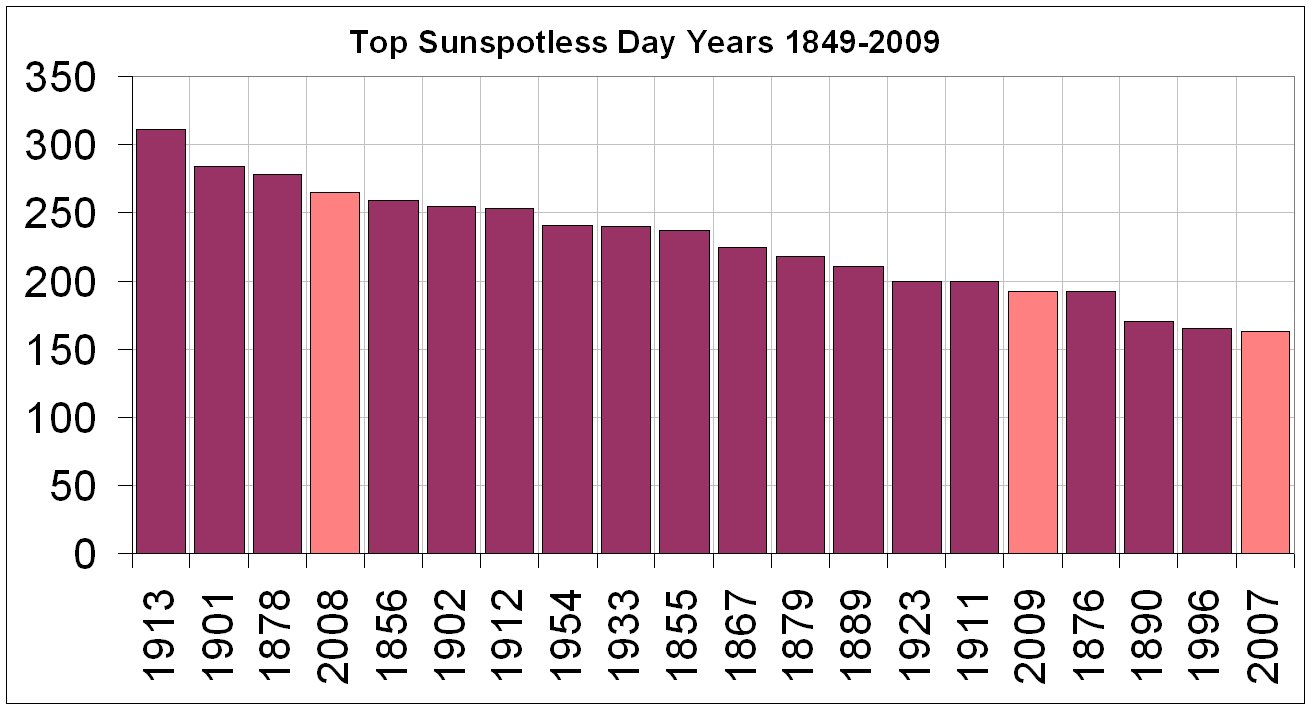
We have had 193 spotless days this year (79% of the days). We are in the top 20 years in 16th place. We will very likely rapidly rise up the list in upcoming weeks and rival 2008’s 266 days and likely end in the top 5 years. 2007, 2008, 2009 will only have 1911, 1912, 1913 in the top 20 as string of 3 per transition (below, enlarged here).
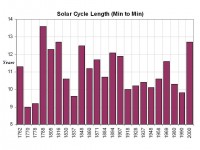
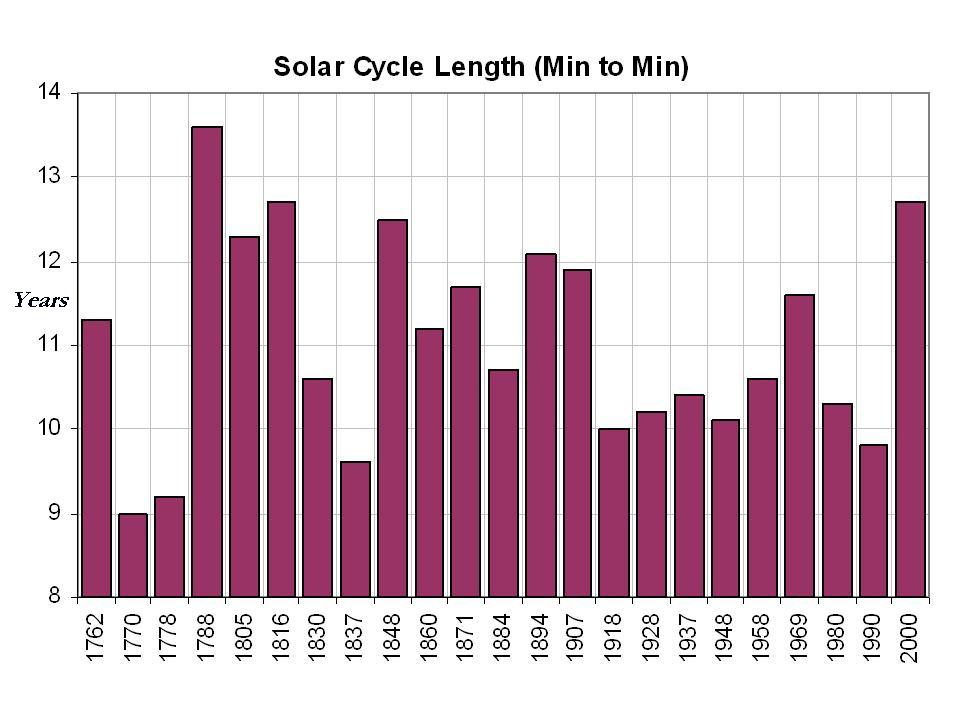
The cycle minimum probably was December, 2008. January 2009’s 13 month average came up a bit due to slight bump in activity in June and July but if August should end up sunspotless and September low, we could have a double bottom. Still, the 12.7 years assuming December 2008 was longest in two centuries (below, enlarged here). Only cycles 4 (peaking in 1788) and 6 (peaking in 1816) were longer than cycle 23 (which peaked in 2000).
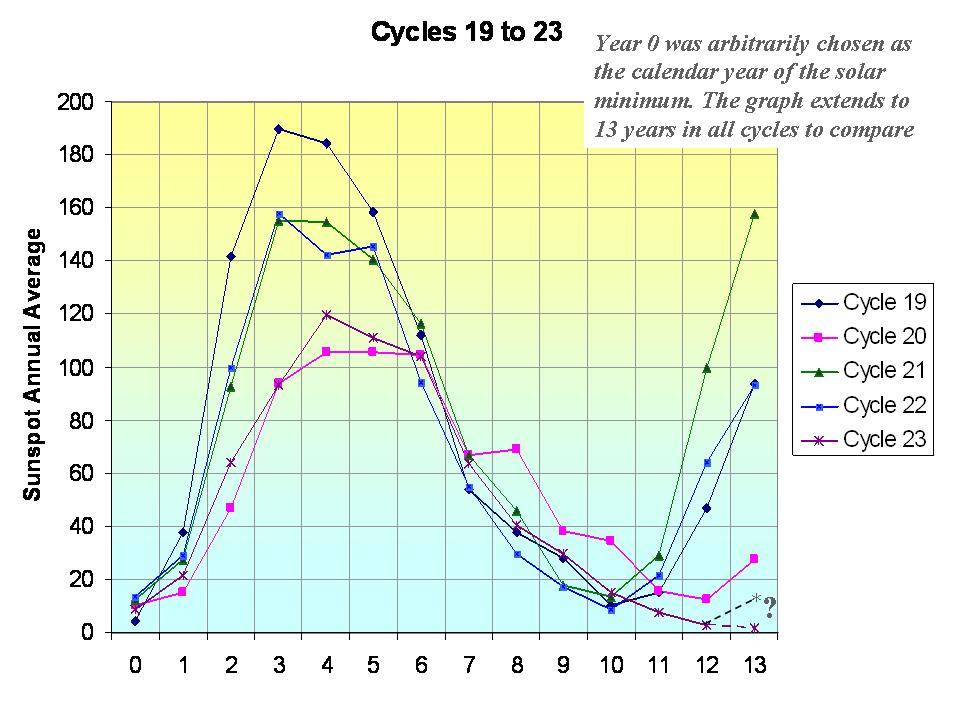
You can see on this chart, by 13 years after the solar minimum year, most of the last 5 cycles already had recovered, in one case already to the solar max of the subseuent cycle (below, enlarged here).
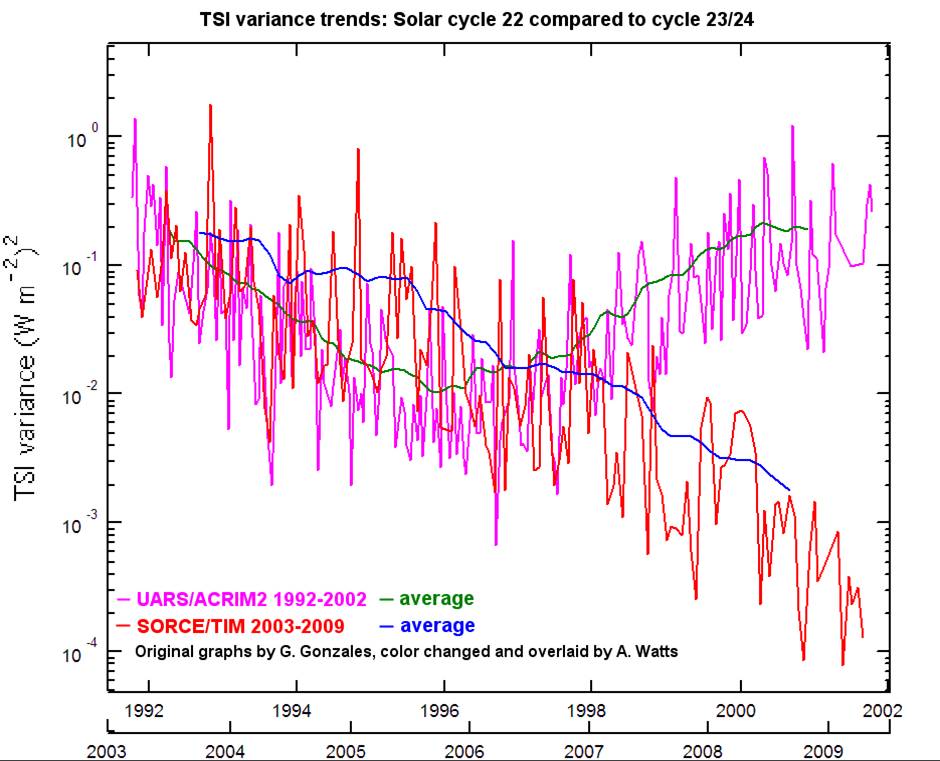
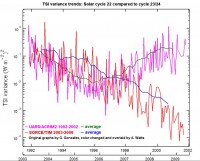
This cycle has continued to decline in the solar irradiance, solar flux, sunspot number and geomagnetic activity after 10 years. On the following chart produced by Anthony Watts, you can see the Total Solar Irradiance declining whereas the prior cycle was rebounding (below, enlarged here).
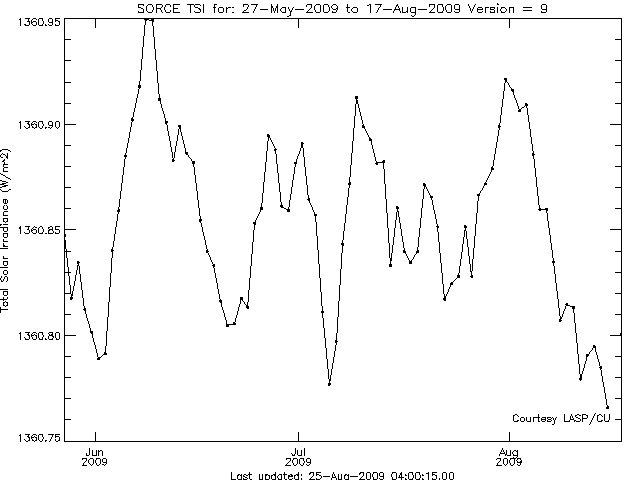
Also see the daily TSI which goes through short term cycles at the lowest point of the last few months as of the last plotted measurement.
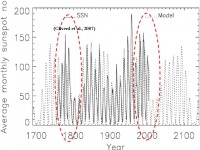
Clilverd et al 2006 suggests using a statistical analysis of the various cycles (11, 22, 53, 88, 105, 213, and 426 years) shows the next two cycles will likely be very quiet much like those of 200 years ago in the early 1800s, the so called Dalton Minimum, the time of Dickens (with snows and cold in London like last winter) (below, enlarged here).
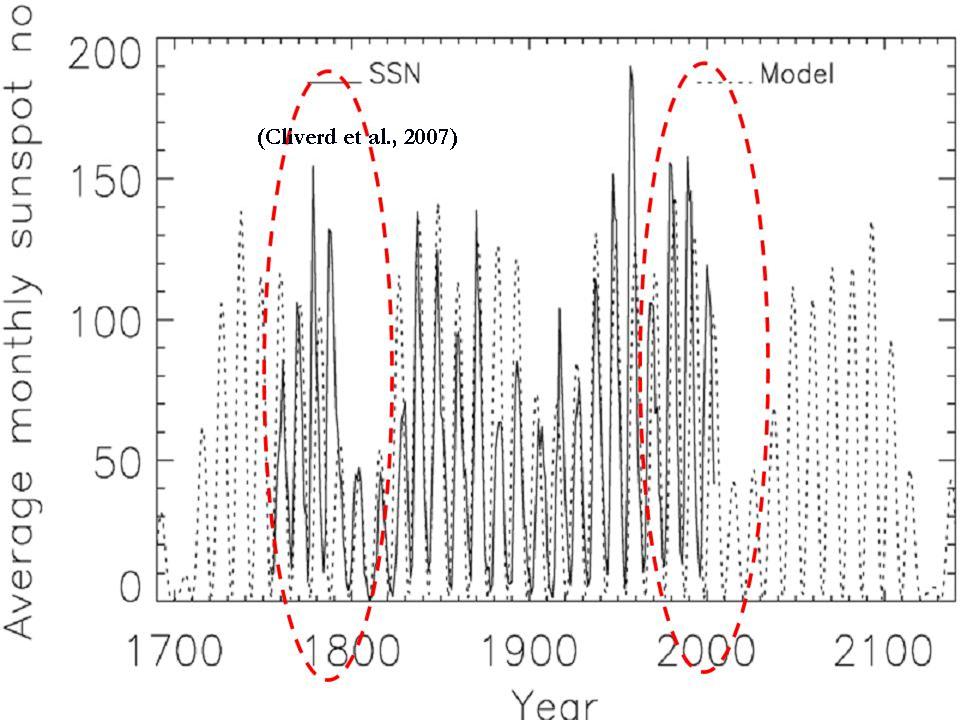
See what David Archibald shows what the result might be if Clilverd is correct here. Some have not ruled out an even stronger Maunder like Minimum.
Read more in this pdf here.