


By Joseph D’Aleo, CCM
In part I of a four part series on Intellicast.com (here) on the importance of the oceans to climate and weather, I discussed the Pacific Decadal Oscillation (PDO) and its impact on the frequency of El Ninos and La Ninas, which have an effect on the position of global troughs and ridges and through them global patterns of temperatures and precipitation. In Part 2, this week, I addressed the Atlantic Multidecadal Oscillation and its effects on hurricanes and through the NAO on winter cold and snow and how it works together with the PDO to modulate temperatures.
The Atlantic also has a multidecadal oscillation called the Atlantic Multidecadal Oscillation or AMO which has a period of about 30 to 35 years per phase (a cycle length of around 70 years). The UN IPCC concludes the oscillations of the Atlantic Multidecadal Oscillation (AMO) is likely due to changes in the strength of the thermohaline circulation. Dr. William Gray of Colorado State University has talked about this for years and continues to do so in his seasonal outlooks and presentations.
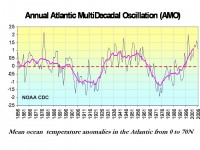
See full size image here
The IPCC AR4 even discussed how Walter and Graf (2002) related the AMO with the NAO (North Atlantic Oscillation) a better known more variable atmospheric flip flop in the central and eastern North Atlantic. This relationship was shown to be strongly negative during the cool (negative) phase of the AMO but weaker with the warm (positive) phase. When the NAO is negative, it often means cold and snow for parts of western Europe and the eastern united States in winter. A positive AMO in summer often means warmer temperatures and more and stronger Atlantic basin hurrricanes.
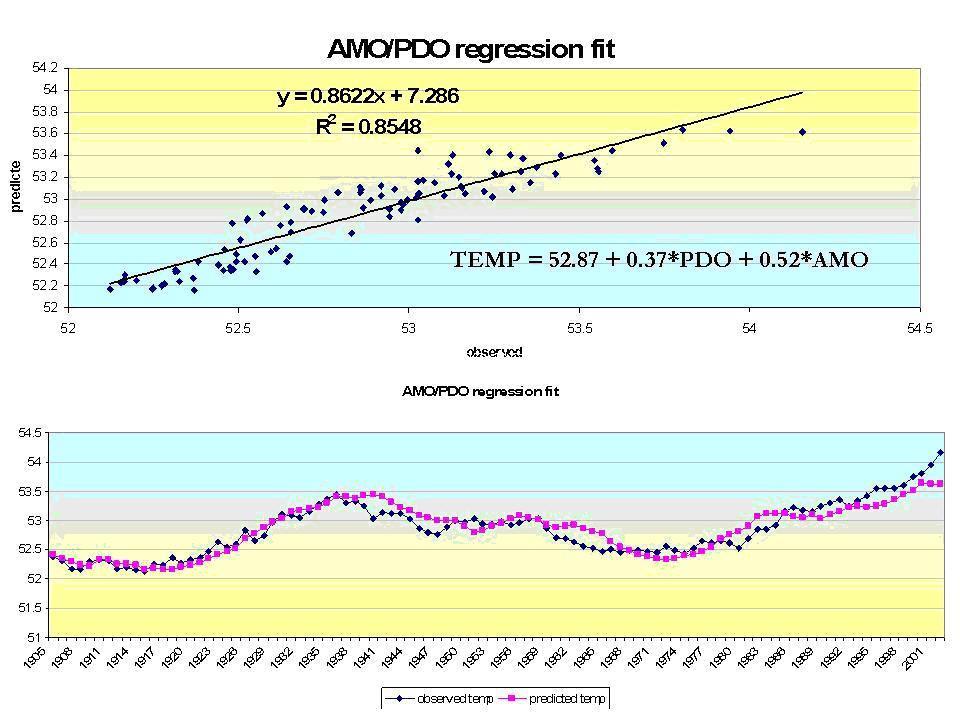
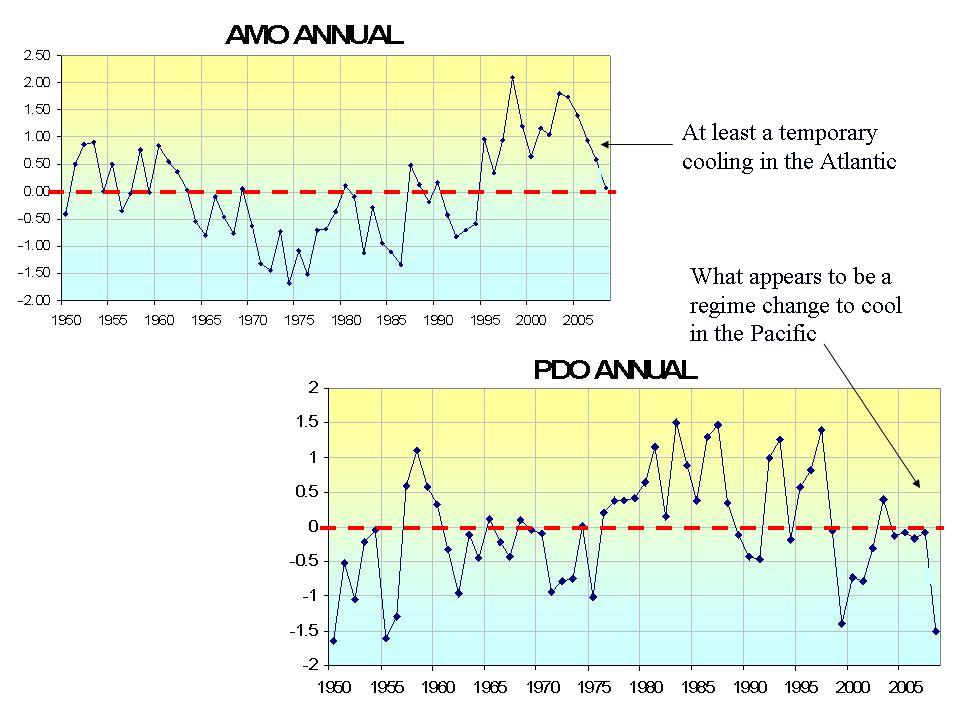
I showed how when regressed AMO and PDO with temperatures, it helped to explain much of the multidecadal variability in temperatures we find in the United States. With the PDO now negative and the AMO diminishing, this would suggest cooling as the story shows it appears has started.
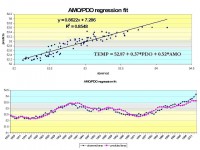
See full size image here. See image of latest PDO and AMO trends here
See the full Intellicast story here.
Part 3 May 11th will look at how the PDO and AMO correlate well with both Greenland and Arctic temperatures and explain the decadal changes in ice cover. Recent stories in the media are predicting another big melt. We will show how that is not at at unprecedented (happens predictably every 60 years of so) and entirely natural. Part 4 on May 17th will focus on what the PDO and AMO states mean for landfalling hurricane threats.