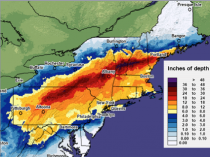
The December 18th storm had an amazing band of very heavy snow in the arctic air.
Observers in cities and towns in PA, NY and New England:
19 locations reported over 40 inches
126 locations reported over 30 inches
219 reported over 24 inches
456 reported over 12 inches.
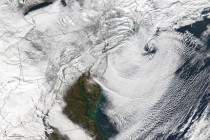
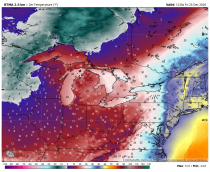
Image of storm exiting - leaving a wild mix of cloud bands and snowcover behind.
NOAA has added the storm to the list as a CAT2 event (3.21 NESIS Score). It ranks 43rd.
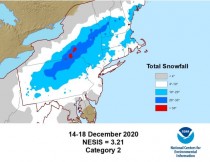
It seems they undercounted some of the the snow amounts in that band where local 40 inches amounts were reported from PA to NH.I believe it MAY have been a CAT 3, but the heaviest missed the urban corridor so I won’t object. It’s all gone already anyway thanks to a Christmas deluge and warmth ahead of a powerful trough. It is a frigid Christmas in the Midwest behind the storm. BTW, a similar thing happened in January 1978 and again in January 1996 when a warm driving rain wiped out deep snows. More fun followed.
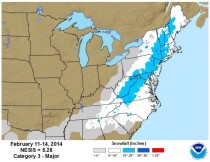
It is likely to make the NESIS list. Our former award winning intern Remy Mermelstein now at Cornell tells me NSSL’s Greg Carbin notes the 20,000 square mile 1 foot or more of snow is most like the Valentine’s Day storm of 2014 a class 3 NESIS event.
What is Nesis?
NWS describes it:
While the Fujita and Saffir-Simpson Scales characterize tornadoes and hurricanes respectively, there is no widely used scale to classify snowstorms. The Northeast Snowfall Impact Scale (NESIS) developed by Paul Kocin and Louis Uccellini of the National Weather Service (Kocin and Uccellini, 2004) characterizes and ranks high-impact Northeast snowstorms. These storms have large areas of 10 inch snowfall accumulations and greater. NESIS has five categories: Extreme, Crippling, Major, Significant, and Notable. The index differs from other meteorological indices in that it uses population information in addition to meteorological measurements. Thus NESIS gives an indication of a storm’s societal impacts. This scale was developed because of the impact Northeast snowstorms can have on the rest of the country in terms of transportation and economic impact.
NESIS scores are a function of the area affected by the snowstorm, the amount of snow, and the number of people living in the path of the storm. The diagram below illustrates how NESIS values are calculated within a geographical information system (GIS). The aerial distribution of snowfall and population information are combined in an equation that calculates a NESIS score which varies from around one for smaller storms to over ten for extreme storms. The raw score is then converted into one of the five NESIS categories. The largest NESIS values result from storms producing heavy snowfall over large areas that include major metropolitan centers. For details on how NESIS scores are calculated at the National Centers for Environmental Information, see Squires and Lawrimore (2006).
The Northeast Snowfall Impact Scale (NESIS)
Overview
While the Fujita and Saffir-Simpson Scales characterize tornadoes and hurricanes respectively, there is no widely used scale to classify snowstorms. The Northeast Snowfall Impact Scale (NESIS) developed by Paul Kocin and Louis Uccellini of the National Weather Service (Kocin and Uccellini, 2004) characterizes and ranks high-impact Northeast snowstorms. These storms have large areas of 10 inch snowfall accumulations and greater. NESIS has five categories: Extreme, Crippling, Major, Significant, and Notable. The index differs from other meteorological indices in that it uses population information in addition to meteorological measurements. Thus NESIS gives an indication of a storm’s societal impacts. This scale was developed because of the impact Northeast snowstorms can have on the rest of the country in terms of transportation and economic impact.
NESIS scores are a function of the area affected by the snowstorm, the amount of snow, and the number of people living in the path of the storm. The diagram below illustrates how NESIS values are calculated within a geographical information system (GIS). The aerial distribution of snowfall and population information are combined in an equation that calculates a NESIS score which varies from around one for smaller storms to over ten for extreme storms. The raw score is then converted into one of the five NESIS categories. The largest NESIS values result from storms producing heavy snowfall over large areas that include major metropolitan centers. For details on how NESIS scores are calculated at the National Centers for Environmental Information, see Squires and Lawrimore (2006).
Table 1: NESIS categories, their corresponding NESIS values, and a descriptive adjective:
CATEGORY NESIS VALUE DESCRIPTION
1 1-2.499 Notable
2 2.5-3.99 Significant
3 4-5.99 Major
4 6-9.99 Crippling
5 10.0+ Extreme
See the list of the storms and links to images of the snowfall here:
References:
Kocin, P. J. and L. W. Uccellini, 2004: A Snowfall Impact Scale Derived From Northeast Storm Snowfall Distributions. Amer. Meteor. Soc., 85, 177-194
Squires, M. F. and J. H. Lawrimore, 2006: Development of an Operational Snowfall Impact Scale. 22ndIIPS, Atlanta, GA.
December sees a pop climatologically speaking. It rises to a peak in February with a slow decline as spring approaches.
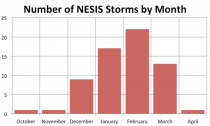
Breakdown of NESIS storms by Month
Number of NESIS storms by week of the year.
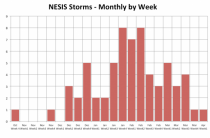
Weekly, the second week in December has had 3 such storms, Christmas week has had 5, mid January also has had 5, with 7 to 8 per week in late January to mid February. It drops off some through the first 3 weeks of March then chances are low into April.
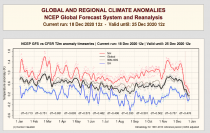
Oceans play a role in the development of these storms. A warm Atlantic and also a warm pool in the Gulf of Alaska can combine and make big storms more likely.
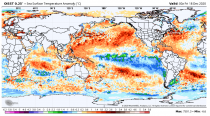
Sea surface temperature anomalies across the world as of Friday December 17. Image provided by WeatherBell.
Number of NESIS storms by year when SSTs are warmer than normal in the Gulf of Alaska.
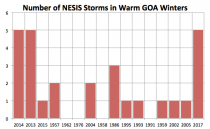
These conditions were common since 2007/08.
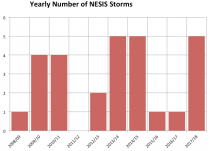
Number of NESIS storms by year over the past 12 years.
The last decade was a blockbuster with a total of 29 NESIS events, well ahead of event the snowy 1960s.
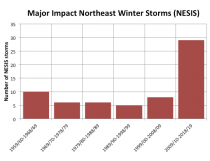
Number of NESIS storms by decade.
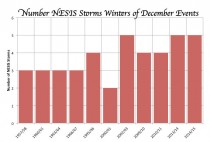
DECEMBER AN OMEN?
In the years of NESIS (1956 to 2020), that there were 11 years with a big December event, there were others that followed (1 to 4). You will recognize some of the years. 2000/01 had 2 official storms although March that year really had 2 events back to back for the northern half of New England (4 feet here in southern New Hampshire). Now with blocking (negative AO/NAO) and a stratospheric warming event the storm track will be suppressed with a few to several snow threats the next few weeks. As the strat warm proceeds, and especially if the Aleutian retrogresses west, the path to arctic outbreaks will develop too. Until then it is mainly Canadian polar. Weather forecasting is a little like playing chess.When we had impact events in December, in all years in the NESIS record back to 1956, we had 1 to 4 additional major impact events in the northeast.
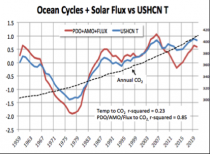
See how temperatures cycle with El Ninos and La Ninas and are currently heading down.
See how the ocean cycles and solar Flux correlate highly with US temperature (r squared of 0.85 versus just 0.23 for CO2).