


By Joseph D’Aleo, CCM, Weatherbell Analytics
I have in the past posted a recent flurry of papers showing evidence for the sun’s role in climate change. I have posted in depth on this in the past with my own findings including here. By now, you know we place a lot of emphasis on the role the oceans and volcanism plays in climate extremes and cycles. In another post we will show how the PDO, AMO, solar and volcanism affect the intensity and frequency of extremes and the persistence of weather patterns. Please help us make the case for the truth by donating to our team. We are battling the alarmists in the public media, the EPA in the court as JB posted on. There are other efforts underway with government and alarmist groups. All the work has been pro bono. Every little bit you donate helps the team.
OCEAN CYCLES
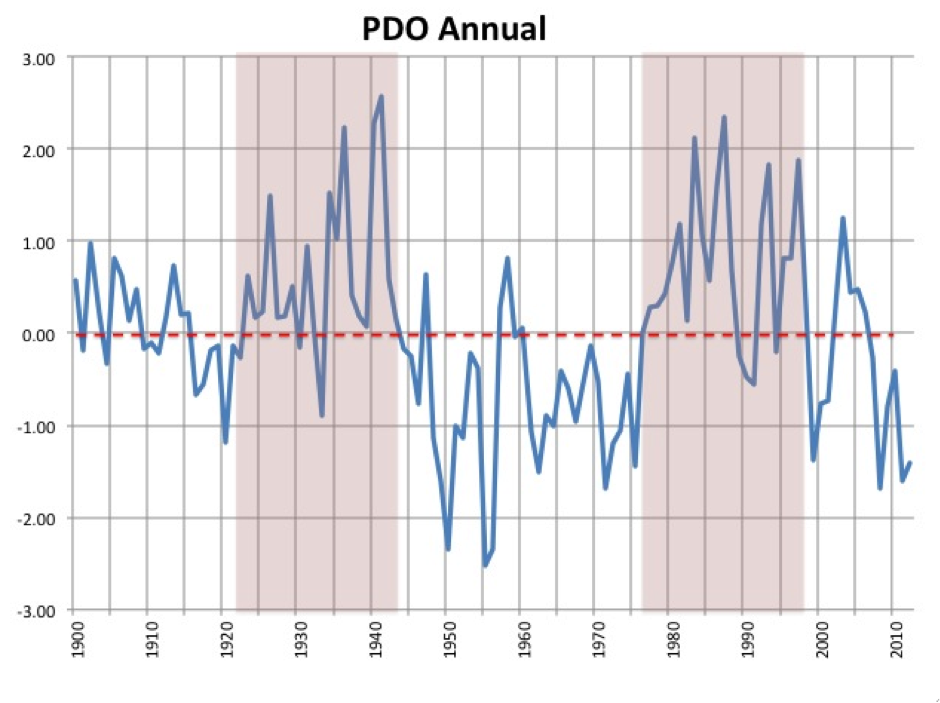
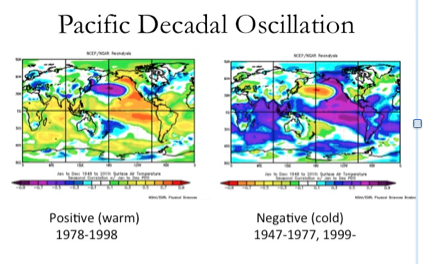
We are now back in a cold multidecadal PDO.

This favors La Ninas, a cold Alaska and Eurasia (annualized - more extreme in winters).
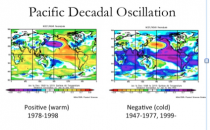
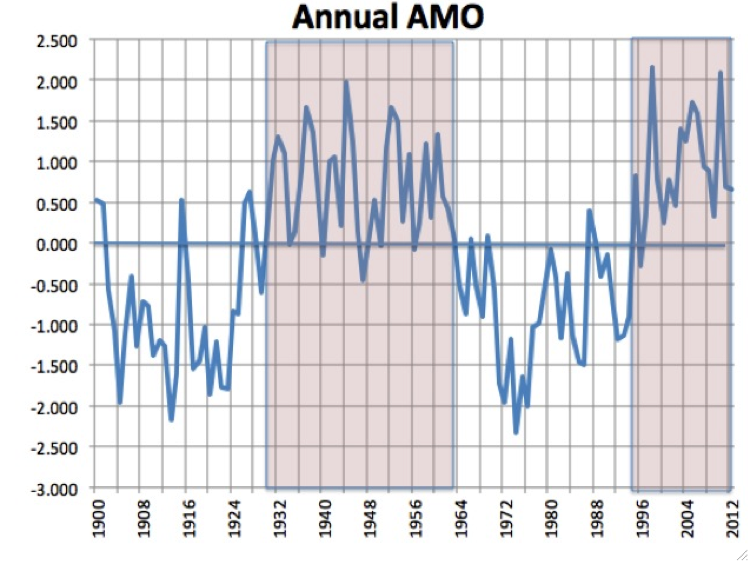
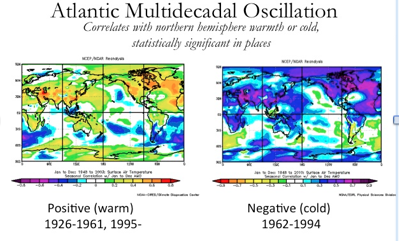
Meanwhile we entered the warm AMO in the mid 1990s.
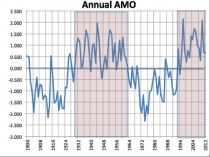
That favors a warm Northern hemisphere and arctic.

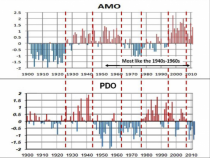
The two oceans are out of phase. We were in a similar condition of a cold Pacific and warm Atlantic from the late 1940s to early 1960s.
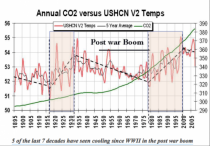
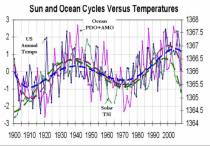
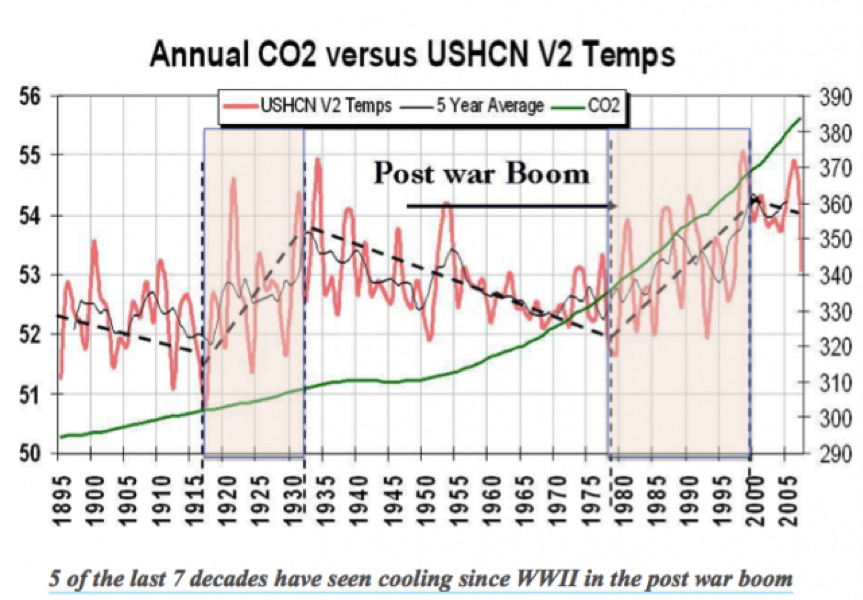
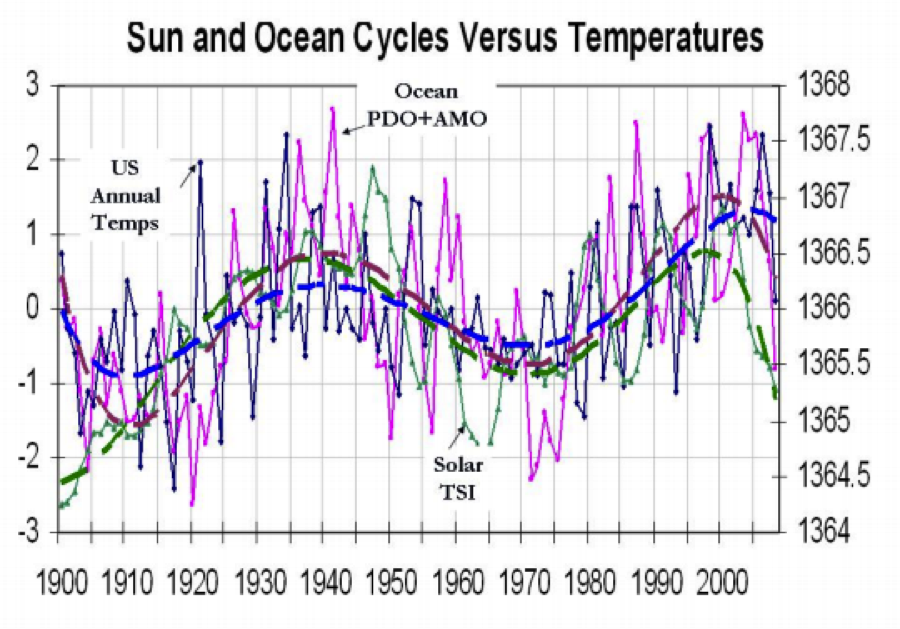
Since both the warm PDO and warm AMO favor warming, taking the two indices standardizing them and adding them and comparing to US annual temperatures (everything smoothed here) we find a strong correlation.
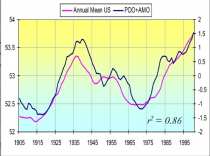
Far better than that with CO2 which had a coincidental correlation 1979 to 1998.
The same PDO/AMO correlation holds with arctic temperatures.
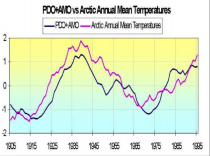
Enlarged
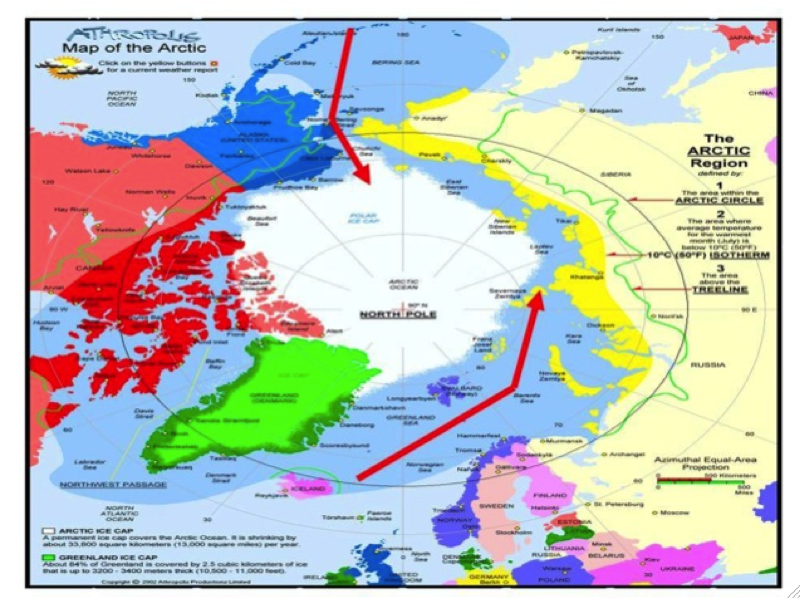
That is because water from both oceans makes its way into the arctic beneath the floating icecap. When its warm, the water thins the ice in summer.
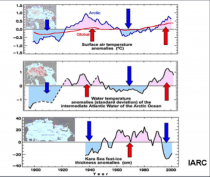
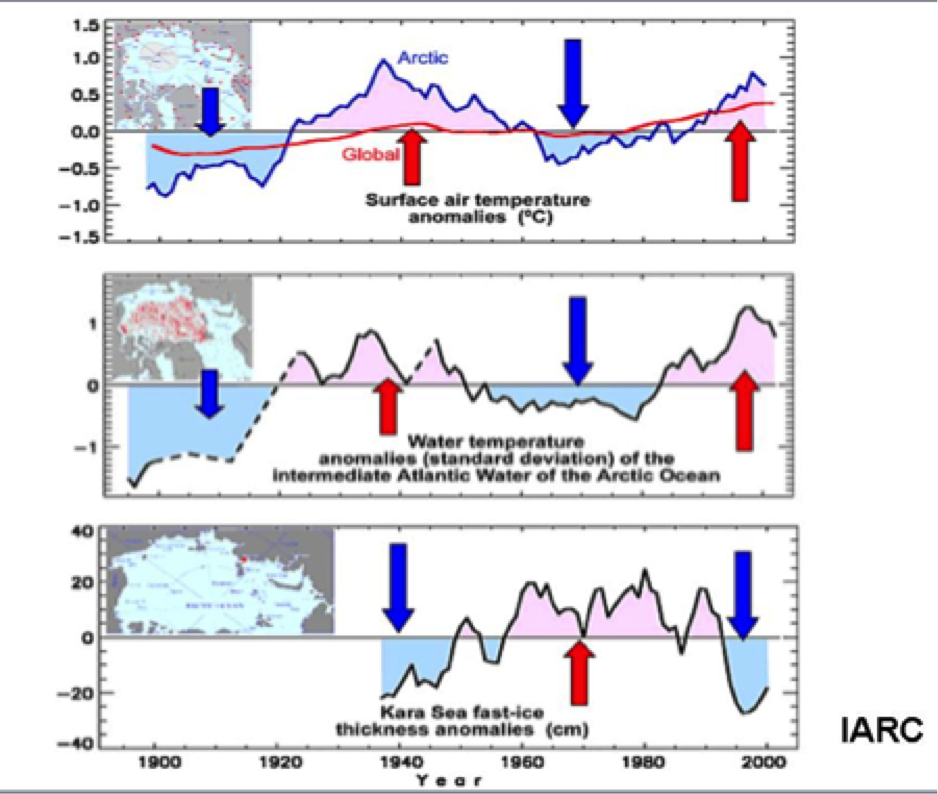
The International Arctic Research Center at the University of Fairbanks has found the same correlation with Atlantic water temperatures and arctic water temperatures and ice thickness/extent.
VOLCANISM
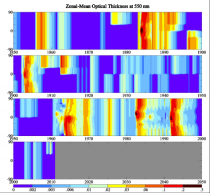
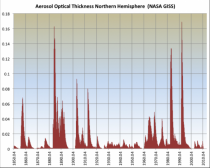
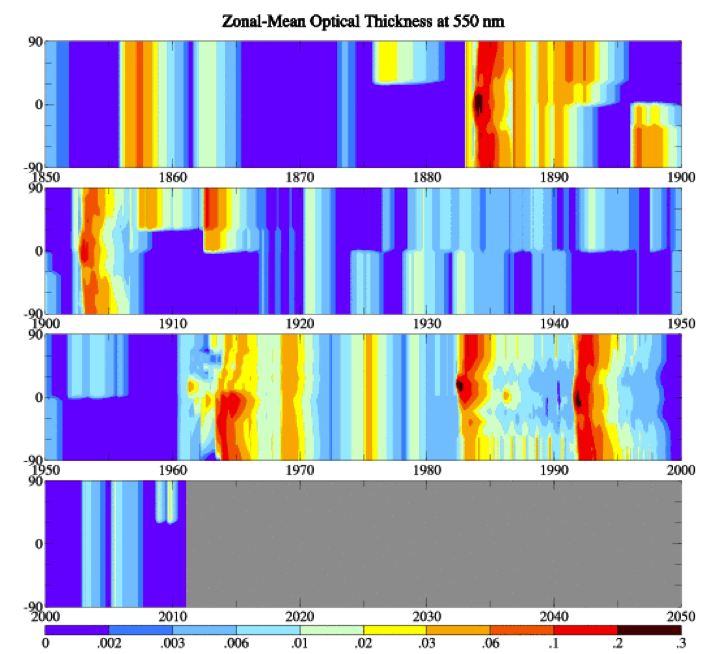
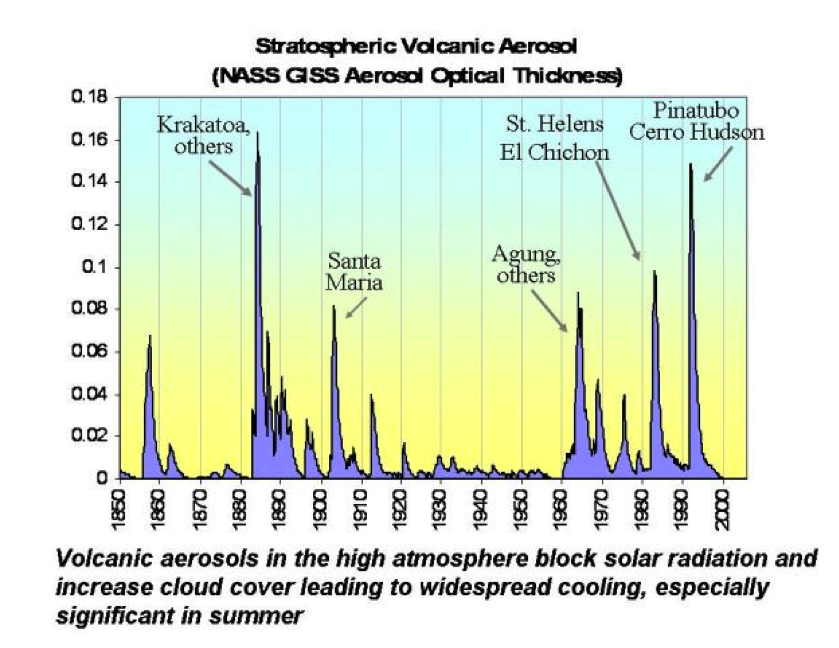
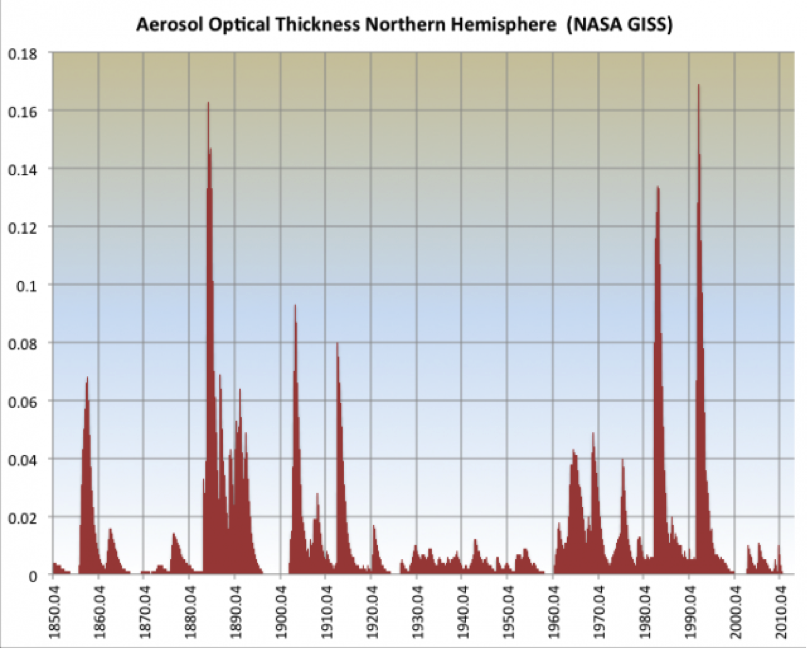
NASA GISS maintains a database of Aerosol loading (aerosol optical thickness) based on volcanoes since 1850 for modeling purposes. Here is the plot of the values by latitude Note how eruptions in one hemisphere, stay concentrated there, near the equator spread both north and south.
I plotted the data a few years back identifying the major eruptions.
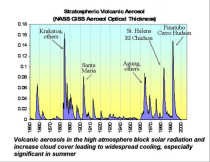
Stratospheric aerosols cut back on incoming solar radiation. Values of 7% reduction or higher have been measured. This is widely accepted as being a factor in causing global cooling for 2 to 3 years after a major eruption. Some eruptions have been estimated to throw aerosols to 80,000 or even 120,000 feet high into our atmosphere. While ash and aerosols (sulfate converted from O2) typically falls out from low level eruptions in days or weeks, those that make it into the stratosphere have a lifetime of a few years. While there, they serve to cool the atmosphere and surface (although with regional variances) and when they fall out to serve as nuclei for ice and water droplet clouds and precipitation (rain and snow). Remember the big Midwest flood of 1993 and the huge snows of March 1993 to the winter of 1993/94 and 1995/96
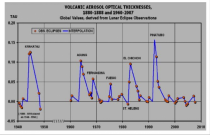
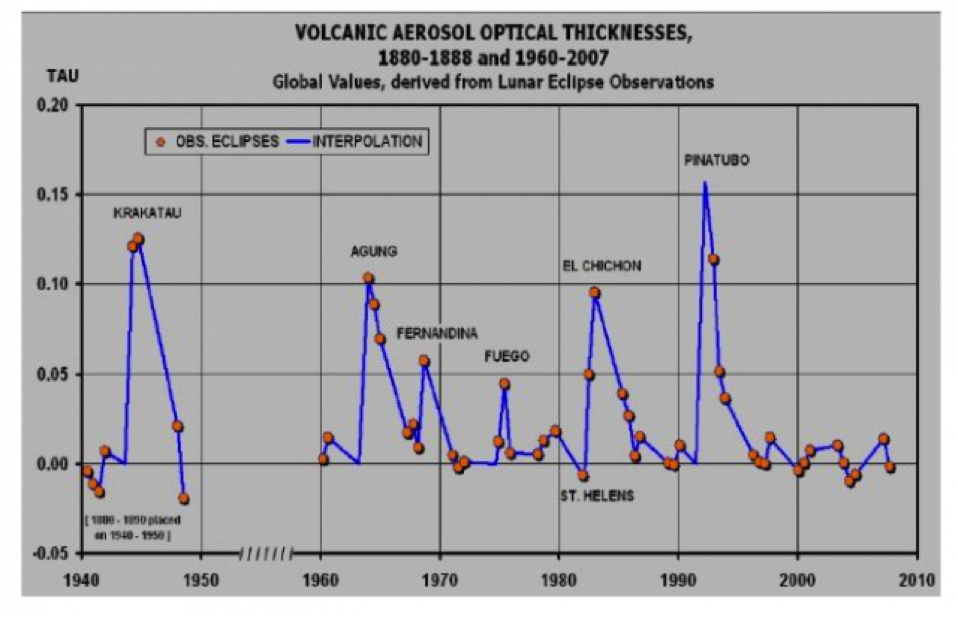
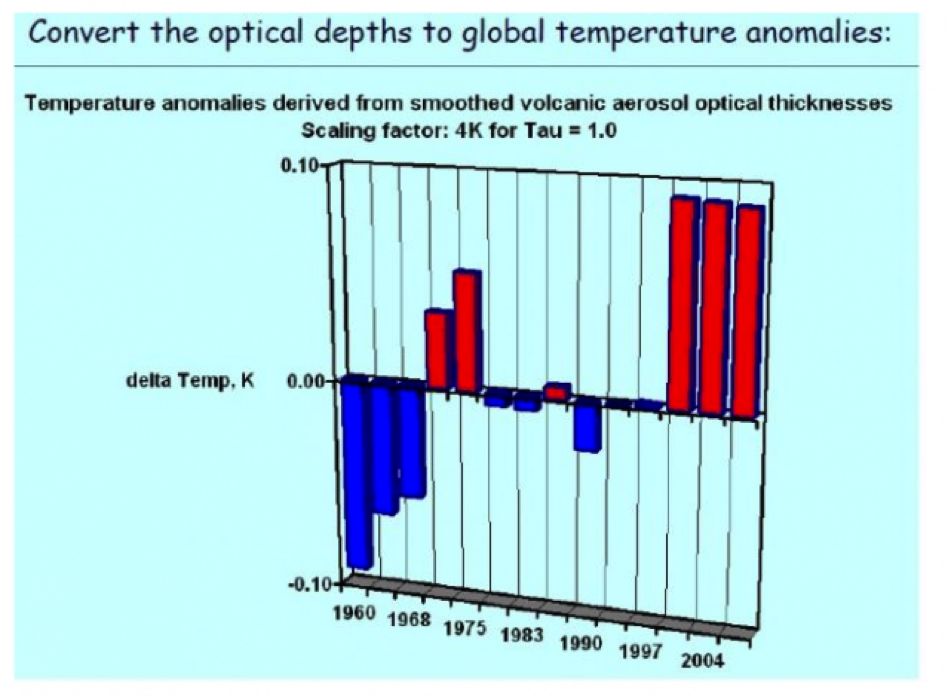
Dr. Richard Keen, who lives in the beautiful Colorado Rockies and is both a weather observer and astronomical expert has been using eclipses to measure this effect. He found the thickness varied and estimated the effect on temperatures.
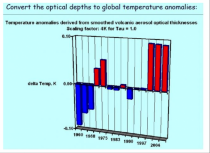
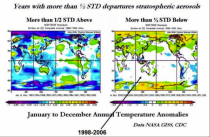
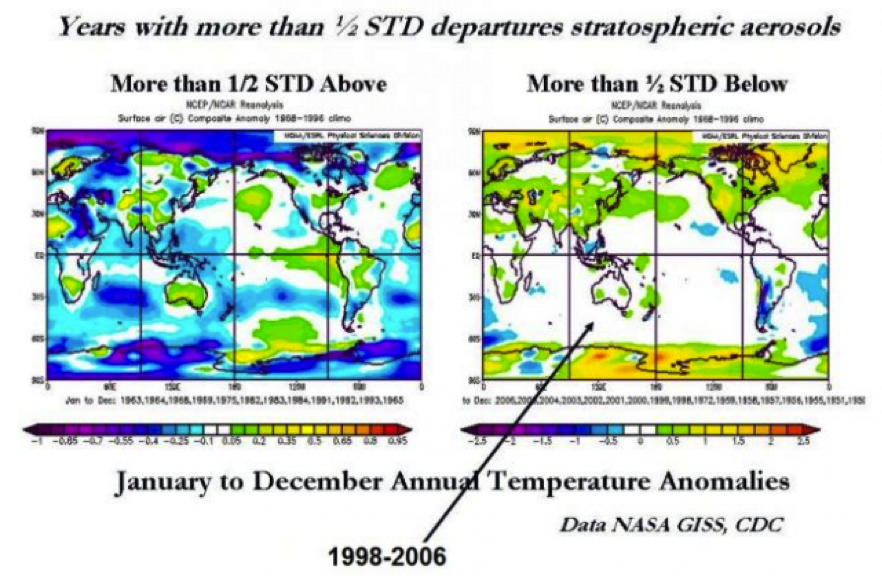
I composited years with high and low stratospheric aerosols and found a definite cooling with high content and warming with low, greatest at the poles where the low angle sun must pass through a much greater path length to reach the surface.
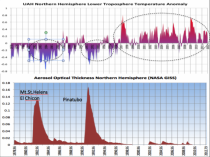
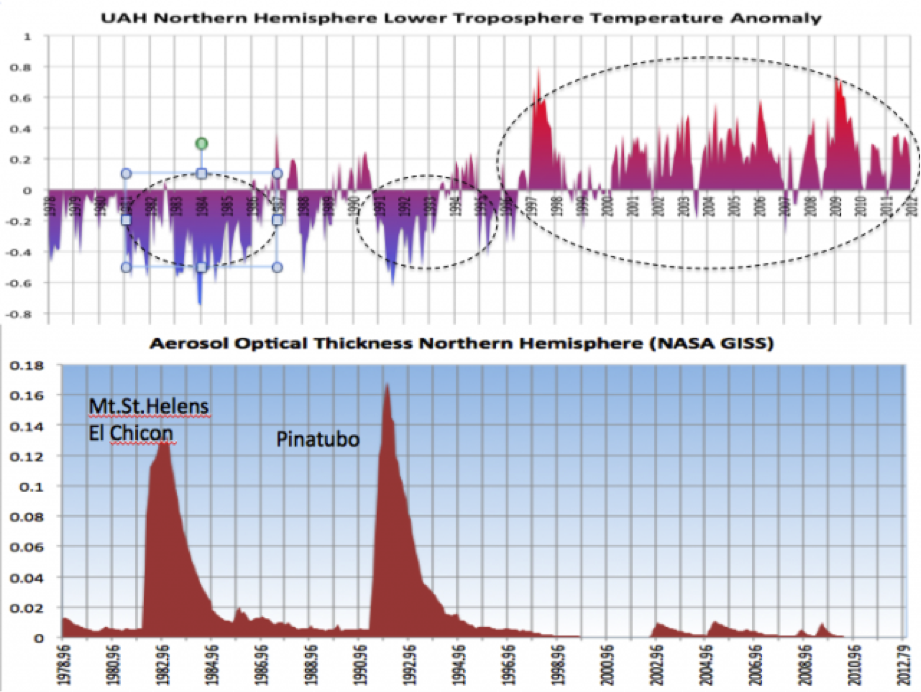
I focused on the northern hemisphere in this plot, extending it to the end of 2012. We have dropped to virtual zero since the Alaska and Iceland eruptions of the late 2000 decade were lower stratosphere and are estimated to be gone.
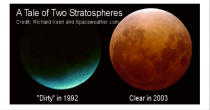
Notice in the chart below, a clean atmosphere coincides with warming certainly relative to the high aerosol periods.
Enlarged
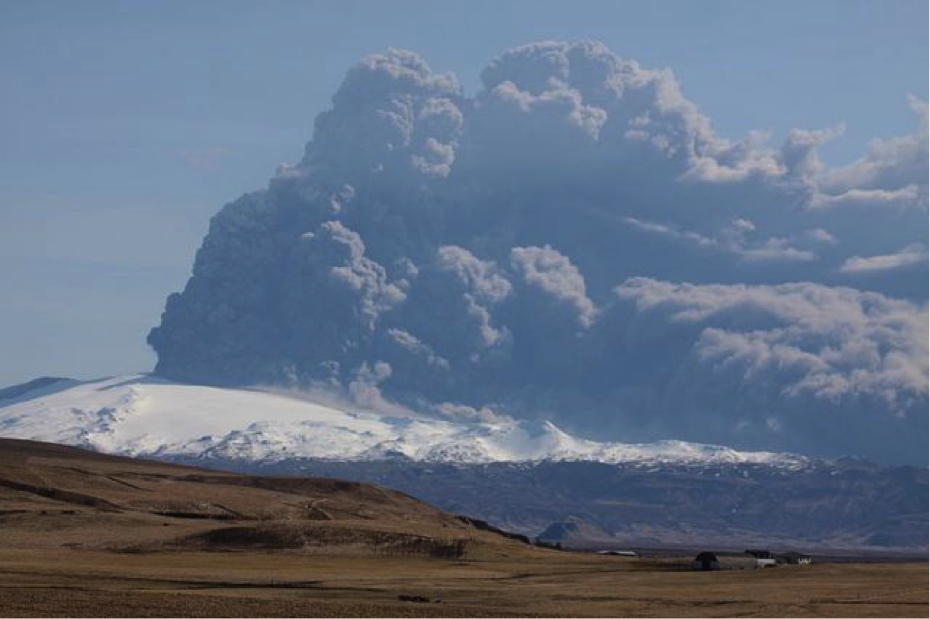
The recent high latitude volcanoes from 2007/08 - 2010/11 may have helped with the snows (and rock bottom solar with cold winters) even though the hemispheric loading was not large.
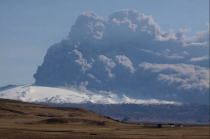
2010 eruption of Eyjafjallajokull Enlarged
We are back to ground zero again.
.
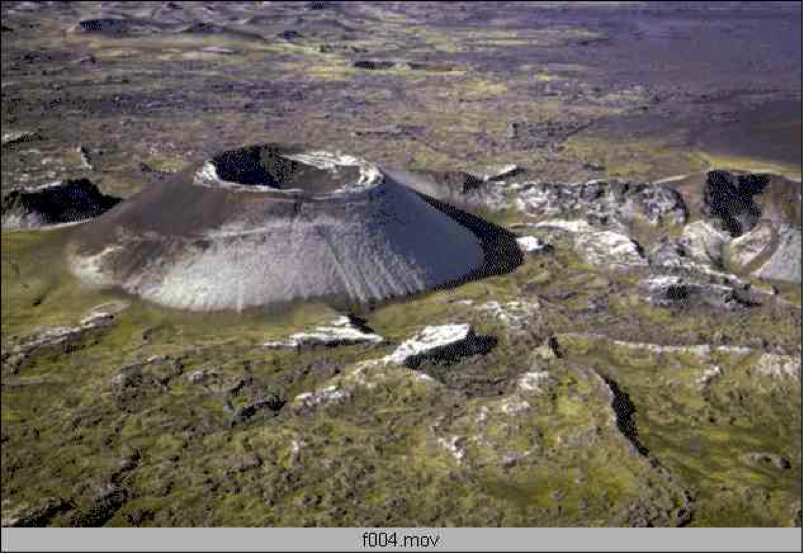
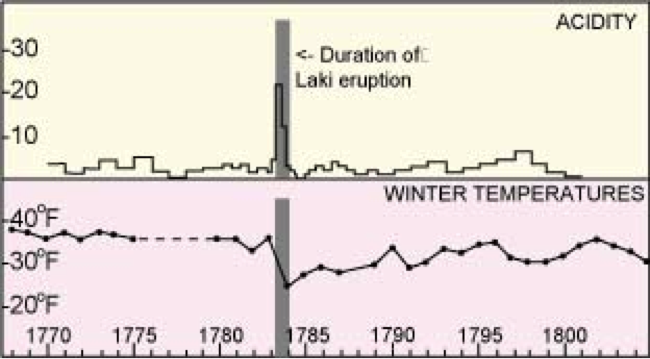
Perhaps the most impactful (more so than Pinatubo and Krakatoa) was Iceland’s Laki in 1783.
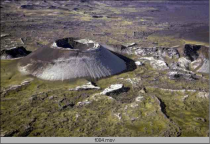
Laki, Iceland, 1783 Enlarged
The Laki eruption lasted eight months during which time about 14 cubic km of basaltic lava and some tephra were erupted. Haze from the eruption was reported from Iceland to Syria. In Iceland, the haze lead to the loss of most of the island’s livestock (by eating fluorine contaminated grass), crop failure (by acid rain), and the death of one-quarter of the human residents (by famine). Ben Franklin noted the atmospheric effects of the eruption (Wood, 1992).
It is estimated that 80 Mt of sulfuric acid aerosol was released by the eruption (4 times more than El Chichon and 80 times more than Mount St. Helens).
The climatic effects of the Laki eruption are impressive. In the eastern United States, the winter average temperature was 4.8 degrees C below the 225 year average. The estimate for the temperature decrease of the entire Northern Hemisphere is about 1 degree C. The The top graph shows change in acidity in micro equivalents H+ per kg in the Greenland icecap. The bottom graph represents the winter temperature records in the eastern United States. From Sigurdsson (1982).
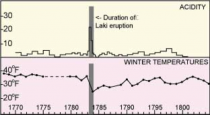
In North America, the winter of 1784 was the longest and one of the coldest on record. It was the longest period of below-zero temperatures in New England, the largest accumulation of snow in New Jersey, and the longest freezing over of the Chesapeake Bay. There was ice skating in Charleston Harbor, a huge snowstorm hit the south, the Mississippi River froze at New Orleans, and there was ice in the Gulf of Mexico.
The Laki eruption illustrates that low energy, large volume, long duration basaltic eruptions can have climatic impacts greater than large volume explosive silica-rich eruptions. The sulfur contents of basaltic magmas are 10-100 times higher than silica-rich magmas (Palais and Sigurdsson, 1989). The sulfur dioxide is what forms the sulfate aerosols which reflect radiation.
How does sun play a role? I believe the sun drives the oceanic cycles which drive the weather. See the details of how here. Volcanism is the wildcard amplifier. See how the TSI as compiled by Hoyt/Schatten/Willson matches the ocean cycles and temperatures.
These are the major league players in our climate. CO2 didn’t make the team.