


By Joseph D’Aleo, CCM, AMS Fellow, WeatherBell Co-Chief Meteorologist
June temperature and precipitation rankings are in.
Enlarged. Warmest in Texas, Second warmest in Oklahoma.
Enlarged Driest in New Mexico. Fourth driest in Oklahoma. Fifth driest in Texas. Wettest in California.
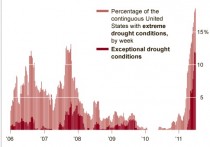
Texas and Oklahoma has felt the brunt of the 14 state drought that has plagued the south this past winter and into the summer. Almost 20% of the United states is said to have been affected by drought.
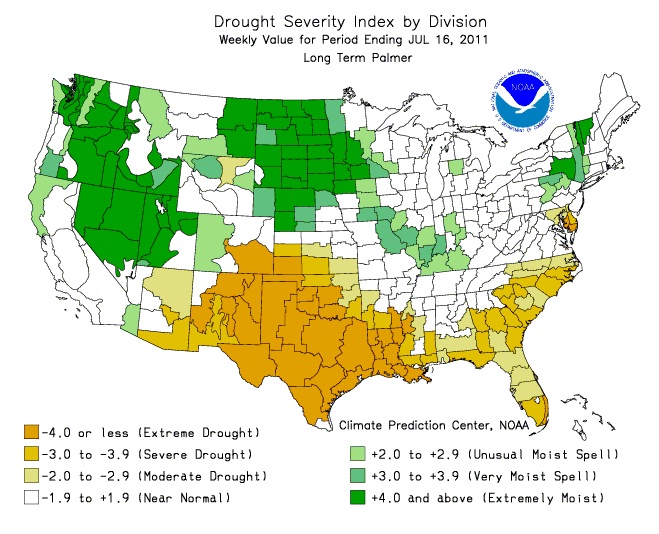
The traditional Palmer Drought Severity Index through Saturday looks like this.
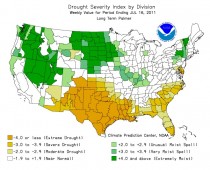
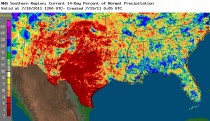
Slow improvement has occurred further east along the Gulf Coast and in the desert southwest as seen in this shorter term drought blend. More rains have fallen since the 9th in Louisiana.
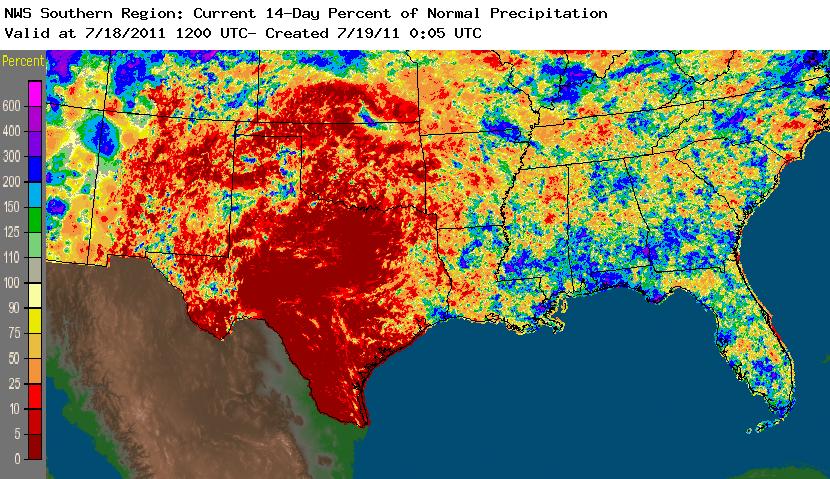
The precipitation anomalies in the last 14 days from Louisiana east have been in many areas well above normal, making a dent in the drought. Reportedly up to 13 ionches fell in parts of Lourisiana in the latest heavy rains. Little help has come to most of Texas.
In an earlier post we showed how since south central drought relates to the strength of La Nina in the prior winter and this winter ranked the second strongest on record, a severe Texas drought is not surprising.
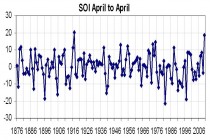
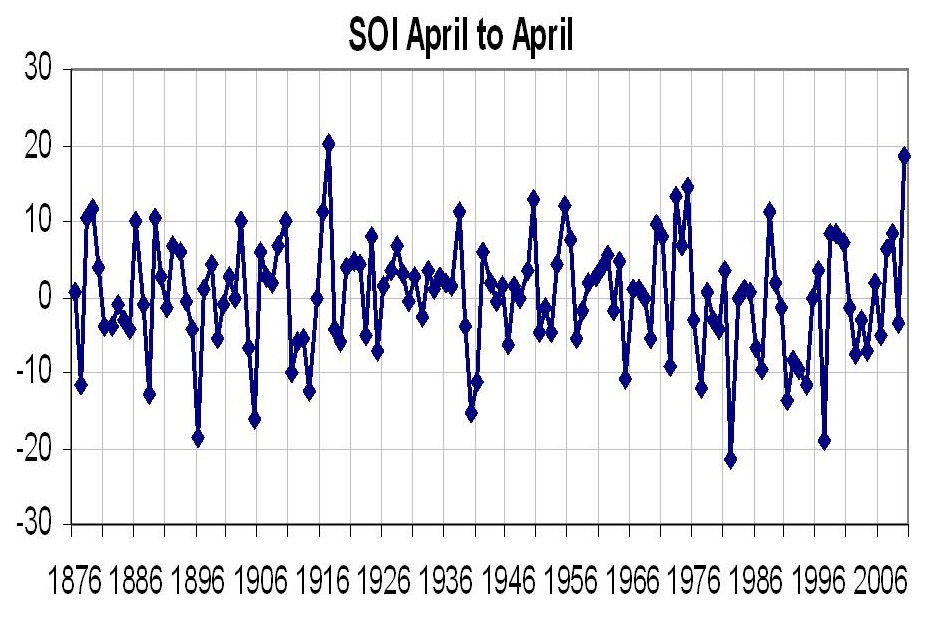
Here was the Southern Oscillation Index (SOI) since 1876. The only strong La Nina from this atmosphere ENSO emasure was in 1918.
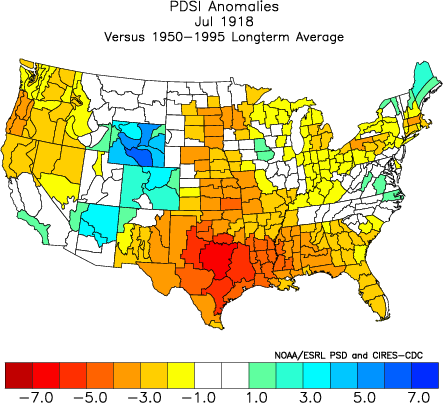
Here was the Palmer Drought Severity Index in July 1918.

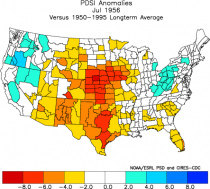
The Multivariate Enso Index or MEI bottomed out in 1956, the only period sincce 1950 with a stronger La Nina. Here was the Palmer Drought Severity Index in July 1956
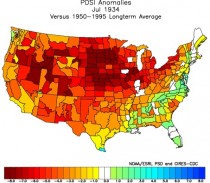
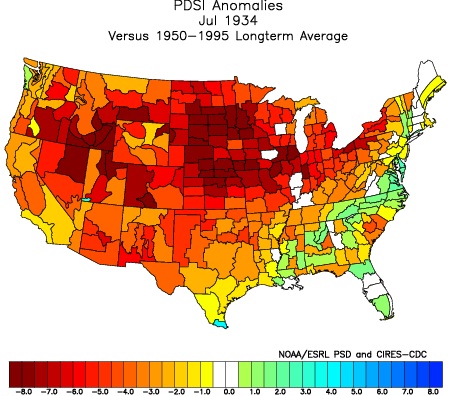
Compared to the near 20% of the country in serious drought, the 1950s when up to 60% was affected and especially the 1930s when 80% of the United States felt the effect of drought and heat.
The 1930s drought peaked in 1934. the drought was centered further north in 1934.
Though the heat wave has spread into the wet areas further north this week creating a literal sauna, the rains and cooling will return there n the next 8 days but the drought will persist in parts of the southern plains. The next 8 day total rainfall shows this. The heat ridge ring of fire is very evident actuyally shrinking a bit as some showers coming to the southern parts of Texas.
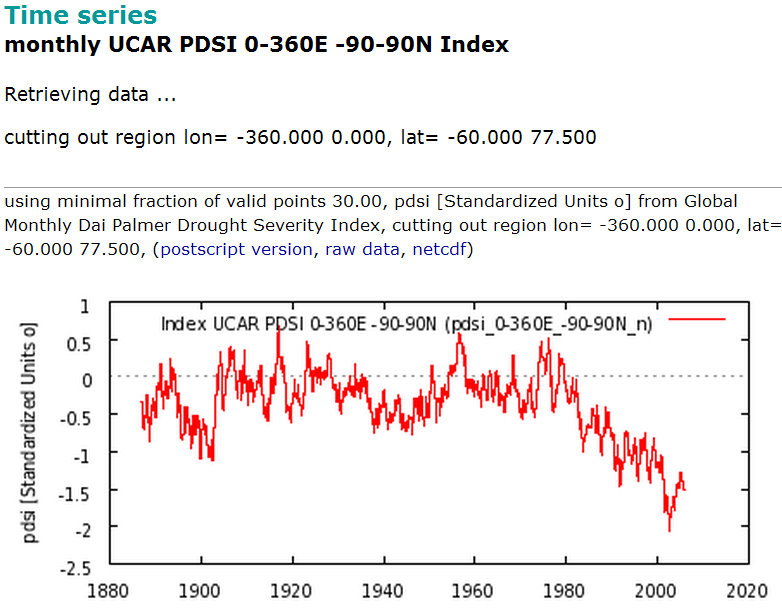
A plot of the worldwide data for the Palmer Drought Severity Index shows that there has been an unprecedented decrease in world drought severity over the past 30 years, possibly due to the plant enhancing increase of CO2.

Enlarged H/t Hockey Stick for this graphic.
Co Chief Meteorologist Joe Bastardi and I post everyday on weather and climaate issues on WeatherBell.com. For the hobbyiests, our premium blog has daily posts like this and daily Weatherbell blog and FOX Business videos and access to model and other data. We both focus on the short, medium and long range weather and climate and our insight may help your business and personal planning. In our commercial section we have daily special reports for energy, agriculture, hedge funds and retail markets with outlooks for 20 days, months, and seasons. Please help us build that business. If you enjoyed Joe Bastardi’s posts and videos and Intellicast’s Dr. Dewpoint, this blog is for you.