


By Joseph D’Aleo, CCM
El Nino is still hanging on but likely not for very long. Warmer than normal water can still be seen along the equator in the tropical Pacific. It is even warmer in the sub-tropical North Atlantic because of the suppressed winter jet stream and subtropical high which meant lighter than normal winds and less clouds.
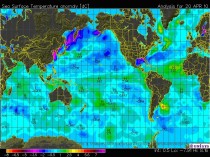
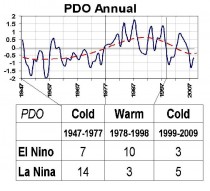
Signs of the demise of the El Nino are numerous. It is likely given the flip of the PDO which favors shorter El Ninos and stronger, more frequent and lengthy La Ninas that a moderate to strong La Nina is next in the cards this year and next.
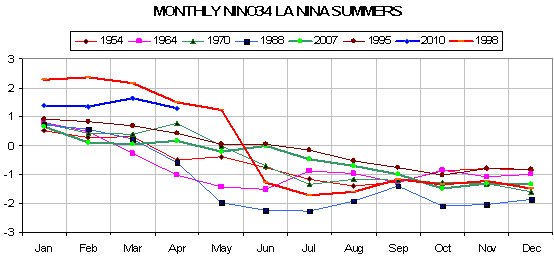
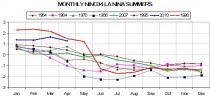
Notice in the temperature anomaly plot for NINO region 34 (region shown on the CDC map below)
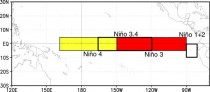
how we are somewhere between 1998’s super El Nino and a cluster of more moderate ones and how they declined quickly by the summer on the graph that follows (enlarged here). Values are given in STD of NINO 34 SSTA.
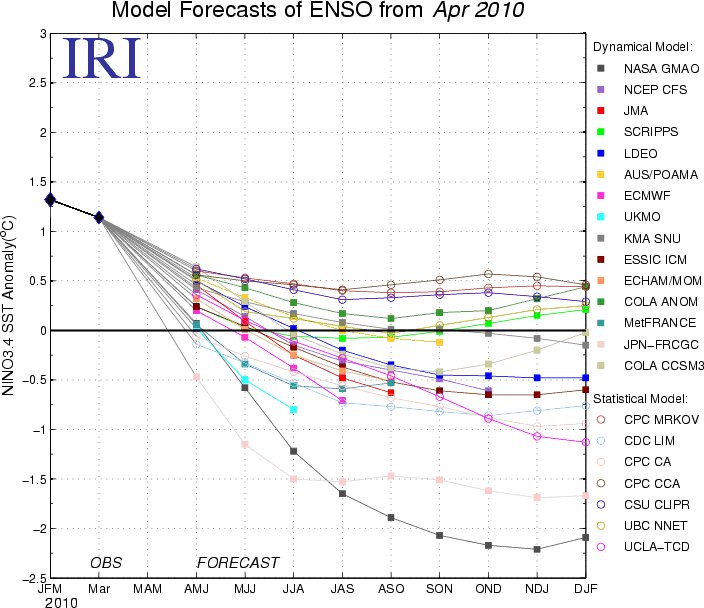
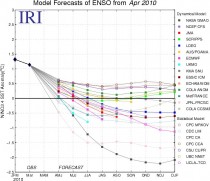
ENSO models, both dynamical (coupled air and ocean models) and statistical suggest a rapid cooling with all models dropping below threshold El Nino levels by summer (JJA - June-July-August) and perhaps half reaching La Nina values by summer or fall. As it declines, the Pacific Decadal OScillation will decline negative again as NOAA CDC models suggest.
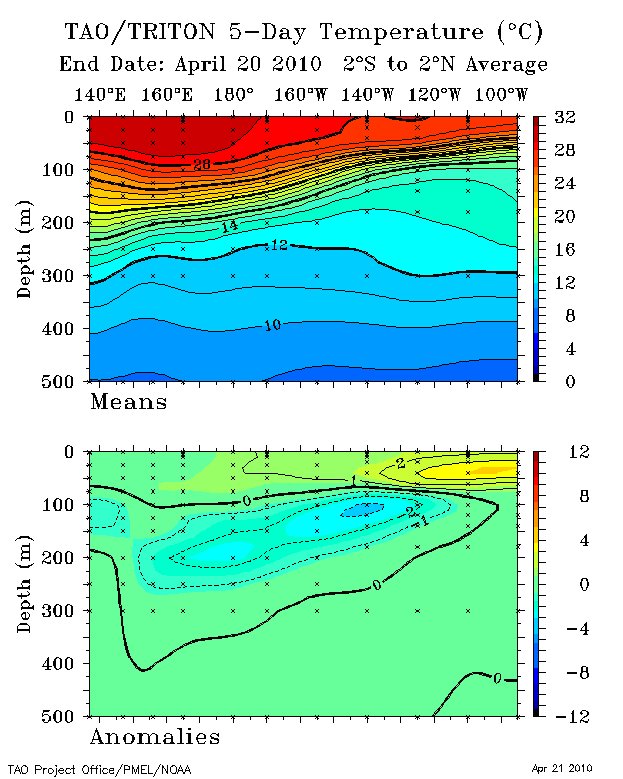
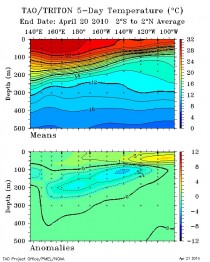
In the depth cross section across the entire tropical Pacific that is built from the TAO-Triton buoy data, we can see the warm water in the eastern top water which was 5C above normal has diminished as the water mixes with cooler surface water and the thermocline is lifted. Notice the developing strong cold pool not unlike that in 1998 at 100 meters across most of the Pacific. Notice the amazing cool down of NINO34 in 1998 from May to June in the multiyear graph above.
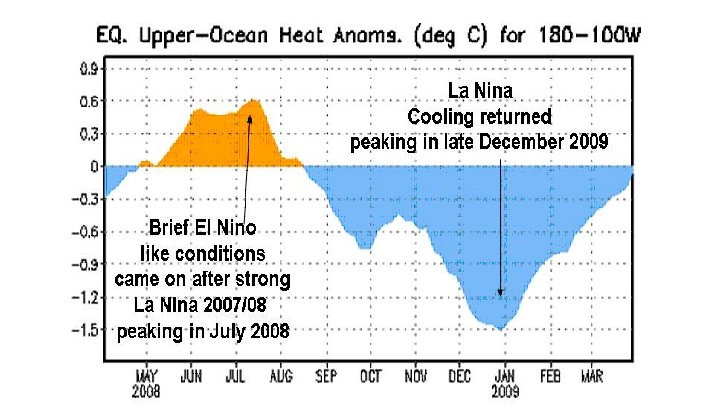
The El Nino followed two years of La Nina with below normal temperatures in NINO34 and in much of the Pacific leading to below normal ocean heat content in the tropical eastern half of the Pacific. A strong La Nina in 2007/08 was followed by a summer rebound then another dip in January.

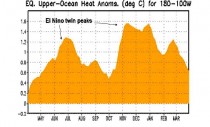
We can see in the heat content the last year, a peak last summer a fall decline and then a multi peak winter warming fed by westerly wind bursts this past winter, notice the decline as we started April.
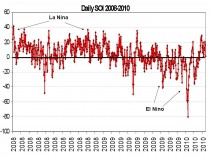
The Southern Oscillation Index which was in positive La Nina territory in 2007/08 and 2008/09 dropped into negative El Nino territory reaching an incredible 8 STDs in early 2010. It has rebounded to positive and usually leads the change of ENSO state by a few months given credence to a return of La Nina.
See much more on the possible implications for the summer and following winter (with recognition of the possible influence of the solar and volcano wildcards) here.
--------------------------
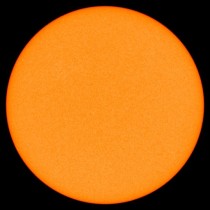
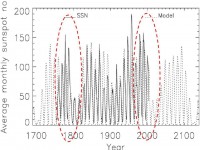
Sun back in a mini-slumber in the transition between solar cycles 23 and 24
The sun is back in a mini-slumber with 13 straight sunspotless days as of April 27 and now 790 for the transition from cycle 23 to 24 (the last 4 cycle transitions had between 220 and 310 such days).
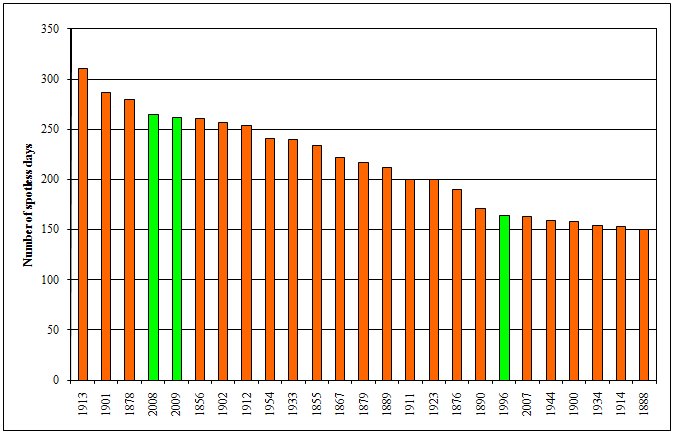
The last two years were 4th and 5th on the list of most sunpotless years since 1849 (below, enlarged here).
One has to wonder how many of the microdots that were counted as spots the last few years would have been seen 100 years ago. This site has an alternative count that thresholds the size.
Here is a brief section of Rupert Wyndham’s book most relevant to the topic:
The average length of solar cycles, from minimum to minimum, is 11 years. The solar minimum between cycles 23 and 24 occurred in December 2008, making cycle 23, at 12.5 years long, the longest since 1823. However, the sun remained in a quiescent state through most of 2009, with only intermittent cycle 24 sunspots occurring; by the end of 2009 there had been 771 days without sunspots during the transition.
It is established from observation that solar cycles longer than the 11 year average are followed by later cycles of lesser intensity, and, commensurately, a cooler climate[ii]. Solar Cycle 23 was 3 years longer than Cycle 22. Based on the theory originally proposed by Friis-Christensen and Lassen, this implies that cooling of up to 2.20 C may occur during Cycle 24 (compared with temperatures during Cycle 23) for the mid-latitude grain-growing areas of the northern hemisphere[iii].
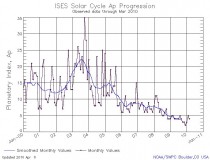
The Average Planetary Magnetic Index (AP index) is a commonly used yardstick to indicate the earth’s magnetic condition and its close relation to solar magnetic variability. Historically, this index recorded a lowest monthly value of 4 in January, 1932 - until recently. Between November, 2008, and September, 2009, the AP index returned persistent readings of 4’s and 5’s, sinking to 3’s in October and November, and finally to 1 in December - which is the lowest reading in the 165 years of observations since 1844[iv].
At the same time that the sun’s magnetic field was setting new record lows, the Northern Hemisphere winter turned into one of the most severe in decades. It was therefore not surprising that during 2009 NASA’s chief solar scientist, Dr David Hathaway, commented that “something like the Dalton Minimum - two solar cycles in the early 1800s that peaked at about an average of 50 sunspots - lies in the realm of the possible"[v]. Given the implications of the recurrence of the cold conditions that characterised the Dalton Minimum, it is, however, astonishing that the IPCC, and the governments that it advises, continue to ignore the implications of the cycle 23/24 solar transition, and the now probable outcome of significant cooling and decrease of crop yields over the next few decades.

---------------
Marshall Space Flight Center, NASA, 2010. Solar Cycle Prediction (Updated 2010/01/04).
[ii] Friis-Christensen, E. & Lassen, K., 1991. Length of the Solar Cycle: An Indicator of Solar Activity Closely Associated with Climate. Science 254, 698–700, doi: 10.1126/science.254.5032.698.
Archibald, D., 2006. Solar Cycles 24 & 25 and predicted climate response. Energy and Environment 17, 29-38.
Archibald, D, 2007. Climate outlook to 2030. Energy and Environment 18, 615-619.
Butler, C.J. & Johnston, D.J., 1996. A provisional long mean air temperature series for Armagh Observatory. Irish Astronomical Journal 21, 251-273.
Clilverd, M.A., Clarke, E., Ulrich, T., Rishbeth, H. & Jarvis, M.J., 2006. Predicting Solar Cycle 24 and beyond. Space Weather 4, S09005, doi:10.1029/2005SW000207.
[iii] Archibald, D., 2010 (Feb. 3rd). Solar Cycle 24 Update. .
[iv]Watts, A., 2010 (Jan. 7). Solar geomagnetic index reaches unprecedented low - only “zero” could be lower - in a month when sunspots became more active.
[v]Archibald, D., 2009. NASA now saying that a Dalton Minimum repeat is possible. July 29, 2009, Solar Cycle 25.