


By Oren Dorell, USA TODAY
March, April, May and June set records, making 2010 the warmest year worldwide since record-keeping began in 1880, the National Oceanic and Atmospheric Administration says. “It’s part of an overall trend,” says Jay Lawrimore, climate analysis chief at NOAA’s National Climatic Data Center. “Global temperatures ... have been rising for the last 100-plus years. Much of the increase is due to increases in greenhouse gases.”
There were exceptions: June was cooler than average across Scandinavia, southeastern China, and the northwestern USA, according to NOAA’s report.
If nothing changes, Lawrimore predicts:
•Flooding rains like those in Nashville in May will be more common.
“The atmosphere is able to hold more water as it warms, and greater water content leads to greater downpours,” he says.
• Heavy snow, like the record snows that crippled Baltimore and Washington last winter, is likely to increase because storms are moving north. Also, the Great Lakes aren’t freezing as early or as much. “As cold outbreaks occur, cold air goes over the Great Lakes, picks up moisture and dumps on the Northeast,” he says.
• Droughts are likely to be more severe and heat waves more frequent.
• More arctic ice will disappear, speeding up warming, as the Arctic Ocean warms “more than would happen if the sea ice were in place,” he says. Arctic sea ice was at a record low in June.
Marc Morano, a global-warming skeptic who edits the Climate Depot website, says the government “is playing the climate fear card by hyping predictions and cherry-picking data.”
Joe D’Aleo, a meteorologist who co-founded The Weather Channel, disagrees, too. He says oceans are entering a cooling cycle that will lower temperatures.
He says too many of the weather stations NOAA uses are in warmer urban areas.
“The only reliable data set right now is satellite,” D’Aleo says.
He says NASA satellite data shows the average temperature in June was 0.79 degrees higher than normal. NOAA says it was 1.22 degrees higher.
ICECAP NOTE: UAH RELEASE: Global composite temp.: +0.44 C (about 0.79 degrees Fahrenheit) above 20-year average for June. All temperature anomalies are based on a 20-year average (1979-1998) for the month reported.) Notes on data released July 7, 2010:
Global average temperatures through the first six months of 2010 continue to not set records, according to Dr. John Christy, professor of atmospheric science and director of the Earth System Science Center at The University of Alabama in Huntsville. June 2010 was the second warmest June in the 32-year satellite temperature record and the first six months of 2010 were also the second warmest on record.
Compared to seasonal norms, temperatures in the tropics and the Northern Hemisphere continued to fall from May through June as the El Nino Pacific Ocean warming event fades and indications of a La Nina Pacific Ocean cooling event increase. The warmest Junes on record were June 1998 at 0.56 C warmer than seasonal norms, June 2010 at +0.44 and June 2002 at +0.36.
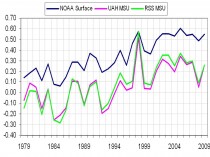
Satellite lower troposphere temperatures and global station data has been diverging in recent decades. NOAA announced that for the globe June 2009 (for the globe) was the second warmest June in 130 years falling just short of 2005. In sharp contrast to this NASA, The University of Alabama Huntsville MSU satellite assessments had June as the 15th coldest and Remote Sensing Systems (RSS) 14th coldest in 31 years.
Here is a plot of the NOAA global versus the satellite global since 1979 (enlarged here).
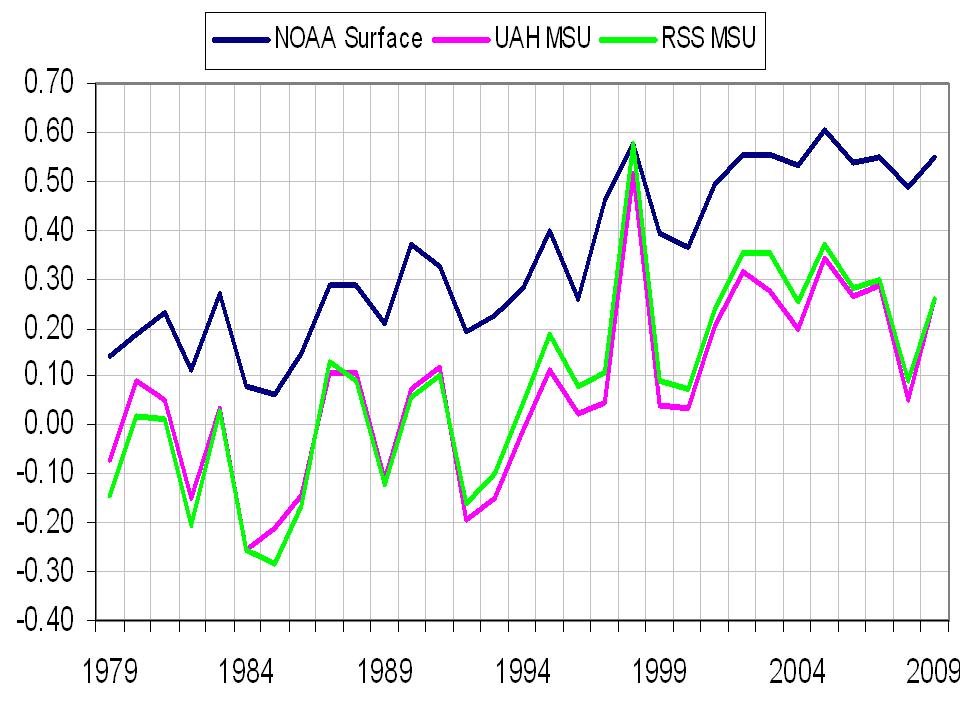
Climate models according to Ben Santer of Lawrence Livermore Labs modelling center predict the lower troposphere should warm (1.2X) more than the surface because that is where the greenhouse gases are. That would look like this (enlarged here).
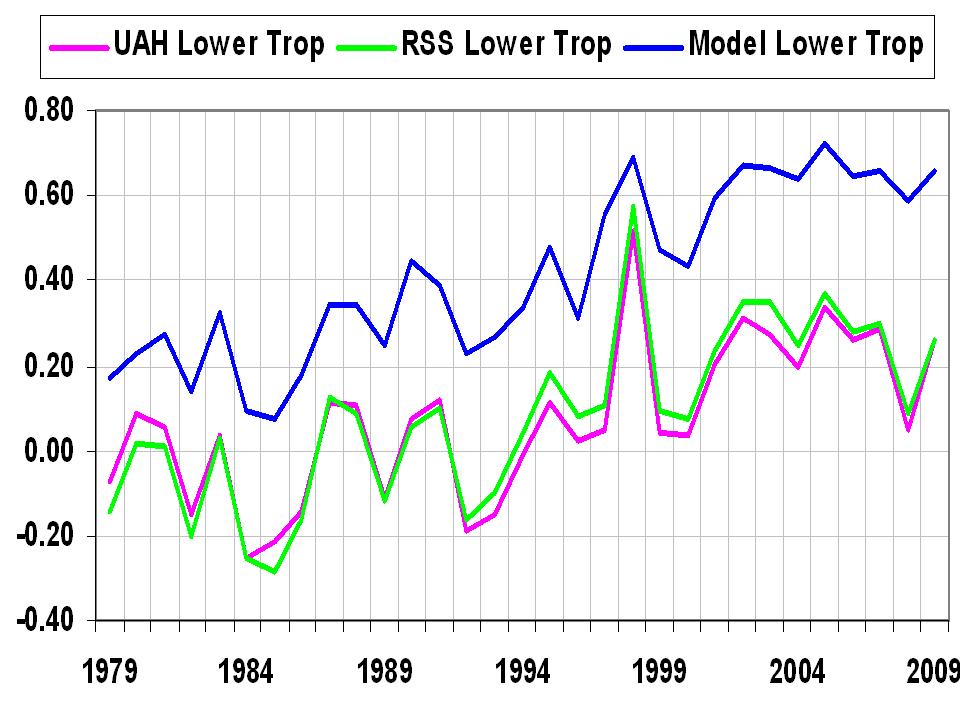
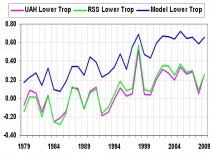
This implies that the greenhouse theory /models are in error and/or surface data is seriously compromised by other factors like land use and urbanization or more likely both. See more here.
Given the onset of La Nina and rapid cooling of the Pacific and some cooling in the eastern Atlantic due to upwelling (and soon the tropical and western Atlantic from heat extraction by tropical systems- western Gulf has already cooled from Alex and TD), oceans should continue to cool and like in 2007, temperatures globally should drop significantly. 2010 will likely fall in the top 5 but not be the warmest ever. The top 5 ranking is guaranteed by all the issues identified here. Reality is something else.
Comments from Richard Keen on the Lawrimore story: Lawrimore’s comment..."Heavy snow, like the record snows that crippled Baltimore and Washington last winter, is likely to increase because storms are moving north. Also, the Great Lakes aren’t freezing as early or as much. “As cold outbreaks occur, cold air goes over the Great Lakes, picks up moisture and dumps on the Northeast,” he says.” ...shows a complete lack of understanding of weather (which makes up climate). East coast snows are caused by lows off the coast, and if the storms move north, Baltimore, Philadelphia, NYC et al. find themselves in the warm sectors of the lows, and enjoy warm southerly winds and rain. Furthermore, during the snow storms, the winds are from the northeast bringing moisture from the Atlantic (hence the name “nor’easter” for these storms); very little of the moisture comes from the Great Lakes. One of Philadelphia’s snowiest winters was 1978-79, when the Lakes were all but frozen over. Along the east coast, a region that averages very near freezing during the winter, the limiting factor for snow storms is not moisture, but temperature. Most storms are rain.
Now, the spot check. NOAA’s calculation of the global temperature is based on their analysis of departures at 2000 or so grid points. One of those points included my weather station at Coal Creek Canyon, Colorado, a location with no UHI or other troublesome influences. The NOAA map of June anomalies for the US, based on an unknown selection of stations, has Coal Creek sitting on the +4F contour. The Coal Creek record is long enough to calculate 30-year normals, and June 2010 comes in at +1.0F above normal. That’s 3 degrees less than the NOAA estimate for the same location, which is the difference between June being in the top 3 or being in the middle third. Now, this is simply a spot check of one of NOAA’s 2000 grid points, but it leads to the question of how far off are the other grid points?
Cheers, Dr. Richard Keen
See also Marc Morano’s full text of his very detailed compilation of responses to NOAA’s Lawrimore on Climate Depot here.