


By Joseph D’Aleo, CCM
In an important paper in 1991, Friis-Christensen et.al. compared the average temperature in the northern hemisphere with the average solar activity defined through the interval between successive sunspot maxima. The more active the sun - the shorter the interval: the solar cycle runs more intense and the higher the global temperatures. Even the finer structures in the two curves had similar appearances.
The long standing observation site at Armagh in Northern Ireland shows similar results. Again you can see shorter cycles are warmer and longer colder.
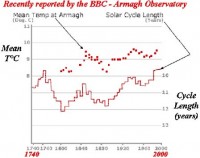
See this paper on cycles seen in the Armagh data set here
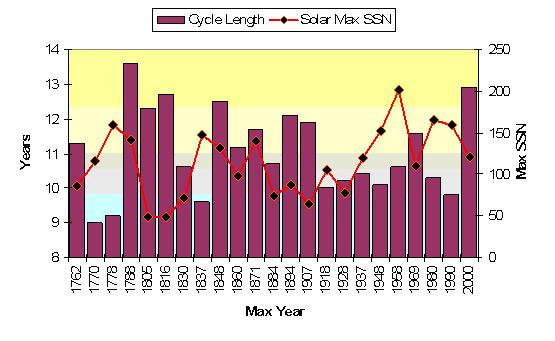
In general the longer cycles are also associated with diminished sunspot activity. I have plotted solar cycle length (columns and sunspot numbers since sunspot cycles were first numbered back in the middle 1700s.

See larger size graph here
The Armagh plot goes back to cycle 4, Friis Christensen around cycle 10. You can see the long cycles around the cold Dalton Minimum in the early 1800s and again in the cold late 1800s to early 1900s. The decreasing length and increasing SSNs accompanied a rise in temperatures in the first half of the 1900s and again late in the century. Note the longer cycle 20 with a dip in sunspot numbers that accompanied the cooling in the 1960s into the 1970s. The current cycle (23 which peaked in 2000) length is still TBD but is likely to be at least close to 12 years. This would imply the cooling that appears to have started in 1998/99 or 2001/02 depending in data set used is real and will continue/accelerate.
Read more here Also note Anthony Watts has posted several solar stories over at his blog with some very intersting comments and he has posted a new story there now with Basil Copeland entitled Evidence of a Significant Solar Imprint in Annual Globally Averaged Temperature Trends - Part 1 in which by proper filtering extratcs the 22 year Hale solar Cycle in the temperature data.