


By Joseph D’Aleo, CCM, WeatherBell Analytics Chief Forecaster
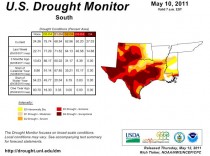
Texas is experiencing what may be their worst drought in history based on October to April rainfall thanks to a strong La Nina and a cold PDO. 76% of the state’s winter wheat was rated poor to very poor in this week’s report.
How about long term trends? Well given the cold PDO which favors more frequent and longer La Ninas has started its likely two to three decade domnance, drought is likely to be a more frequent visitor to the state in the next decade or two than it was in the El Nino rich PDO warm phase from 1979 to 1998.

Let’s look at the longer term trend. Here we will refer to the work of Texas State Climatologist John Neilson Gammon and his Assistant State Climatologist, Brent McRoberts.
Reference: Neilson-Gammon, J., 2011: Our New Analysis of United States Precipitation Trends. Climate Abyss Chron Blog.
Issues with the Climate Division data compiled from COOP stations were addressed by the authors in their attempt to better assess long term precipitation across the United States. Though climate models suggest increasing drought across the southern states, the cleaned up data showed instead long term positive trends and the likelihood that the changes were due largely to natural variability.
John Neilson Gammon, the state climatologist for Texas, notes :“The COOP network is our primary source for climate data for the United States since the 1890s. Observations include daily maximum and minimum temperatures, precipitation, and snowfall. A unique aspect of the COOP network is that almost all of the observations are taken by volunteers, making it an impressive example of coordinated, dedicated effort having an enduring impact.
There are two primary ways that COOP data get combined into coherent, long-term data sets. One is by using a subset of stations that have particularly long-term records: the United States Historical Climatology Network (USHCN). The other is by combining the COOP observations into regional averages, known as climate divisions.
The climate division data is the most common tool for monitoring month-to-month variations in the climate. When the National Oceanic and Atmospheric Administration (NOAA), which by the way administers the COOP network, says that Texas had the driest seven consecutive months on record this past October through April, they’re using the climate division data to make that statement.
There’s one big problem with using the climate division data to make that sort of statement, or to determine in general how climate has changed over time: COOP stations come and go. Volunteers move, or stop taking measurements. New volunteers might live in a wetter or warmer part of the climate division, making the new climate division averages wetter or warmer than before. Plus the climate division data before 1931 was reconstructed based on statewide averages because many parts of the country didn’t have enough stations within each climate division”.
Barry Keim (the Louisiana State Climatologist) and others have looked at a few parts of the country and found that these sorts of changes can seriously affect the long-term record. Brent McRoberts, Assistant Texas State Climatologist estimated the precipitation at every COOP station site whenever an actual observation was unavailable. He used periods when station data overlapped with neighboring station data to determine the correlation between adjoining stations, and used the most highly correlated stations for estimating any missing data.
Reference: McRoberts, D.B, Nielsen-Gammon, J.W,, 2011, New Homogenized Climate Division Precipitation Data Set for Analysis of Climate Variability and Climate Change, Journal of Applied Meteorology, Submitted August 2010, Accepted for publication 2011. (doi: 10.1175/2010JAMC2626.1)
The resulting climate division precipitation averages, which we called FNEP data, are more accurate than the standard NOAA climate division averages.
Another characteristic of the FNEP data is that the resulting long-term trends in precipitation are more consistent from state to state. Furthermore, we examined a few examples of differences between FNEP and the regular COOP, and each difference was attributable to changes in the station distribution or the 1930 change. Here;s what thee FNEP data shows:
Enlarged.
Greens and blues are upward, yellows and reds are downward. The transition from dark green to light blue corresponds to an upward trend of 10% per century.
Most of the United States has had an increase in recorded precipitation over the past 115 years of record-keeping. Gammon estimated that part of the increase (maybe 3%) could be due to improved rain gauge technology reducing evaporation out of the gauge, but the rest of it appears to be real. The only areas without a strong trend are the northern Rocky Mountains and parts of the Southeast. Nowhere is there a substantial downward trend.
The author notes: “This trend pattern is not consistent with the climate projections for increasing Tyndall gases, which basically have the northern United States getting wetter and the southern United States getting drier. There’s no sign of the long-term drought that’s supposed to be gripping the Southwest, although to be fair the rising temperatures in the region are increasing evaporation.”
The Texas upward trend may be surprising to those living through what might turn out to be one of the worst droughts on record. But think about the worst drought years:1917-1918, 1925, and 1951-1956. It was much drier before the 1950s than after. Our recent dry years have alternated with very wet years.
That can be seen in the NCDC Texas Climate-at-a-Glance annual precipitation. It exhibits a slight upward trend of 0.08 inches/decade for the period form 1895 to 2010.
Summary: The NCDC Coop station based data and FNEP analysis show the recent October to April period the driest in record for Texas, an analysis of long term trends showed no increase in drought but instead a positive precipitation trend.
A thorough analysis of precipitation data across the United States shows a tendency for increases over the last century. This is true even in the southern United States where greenhouse theory suggests increasing drought and dryness. The authors had no definitive reason why the precipitation does not behave as climate models predict, speculating modeling errors, natural variability, or other factors not properly considered such as aerosols or irrigation/land use changes.
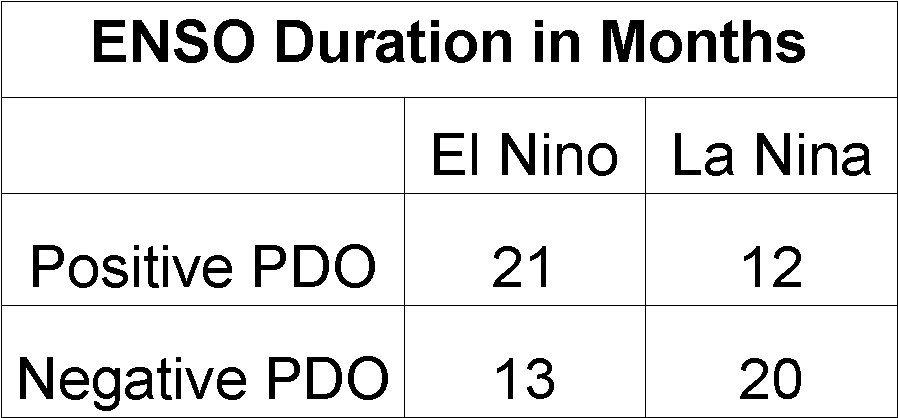
The PDO related alternating favored ENSO state and the significant correlation of Texas preicpitation with ENSO suggests despite this upward trend, a higher frequency of Texas drought in the La Nina dominate years ahead.
See also Global Scan of Impact Areas, this week’s crop progress report and more on this post on WeatherBell. See WeatherBell’s Joe Bastardi on Fox Business this afternoon on his weekly weather impact review.