


Update: see HERE how weather satellites show no ‘global warming’ for 18 1/2 years. No N. Pole warming for nearly 14 years. No S. Pole warming for 37 years! U.S. has had no warming for 18 years!
--------------
SAN FRANCISO, CA - A new study about the surface temperature record presented at the 2015 Fall Meeting of the American Geophysical Union suggests that the 30-year trend of temperatures for the Continental United States (CONUS) since 1979 are about two thirds as strong as officially NOAA temperature trends.
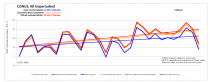
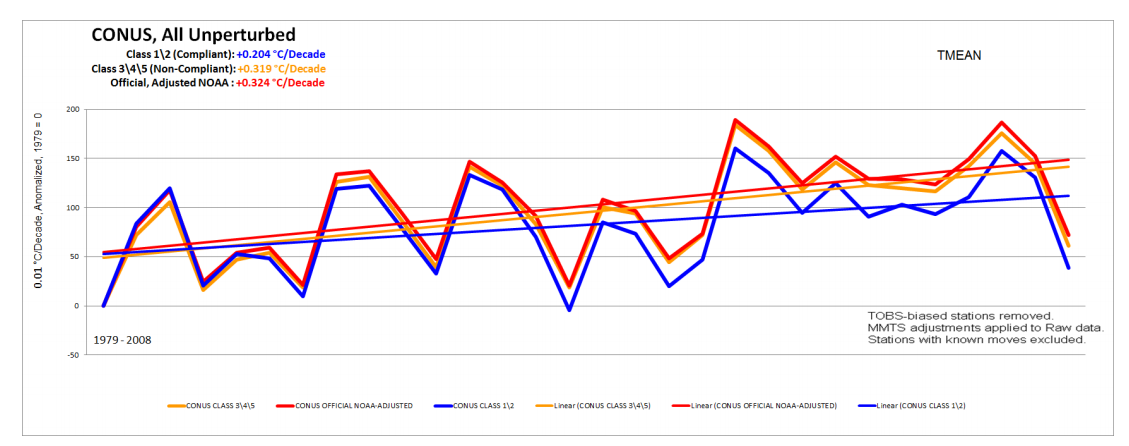
Figure 1 - Comparisons of 30 year trend for compliant Class 1,2 USHCN stations to non-compliant, Class 3,4,5 USHCN stations to NOAA final adjusted V2.5 USHCN data in the Continental United States
Using NOAA’s U.S. Historical Climatology Network, which comprises 1218 weather stations in the CONUS, the researchers were able to identify a 410 station subset of “unperturbed” stations that have not been moved, had equipment changes, or changes in time of observations, and thus require no “adjustments” to their temperature record to account for these problems. The study focuses on finding trend differences between well sited and poorly sited weather stations, based on a WMO approved metric Leroy (2010)1 for classification and assessment of the quality of the measurements based on proximity to artificial heat sources and heat sinks which affect temperature measurement.
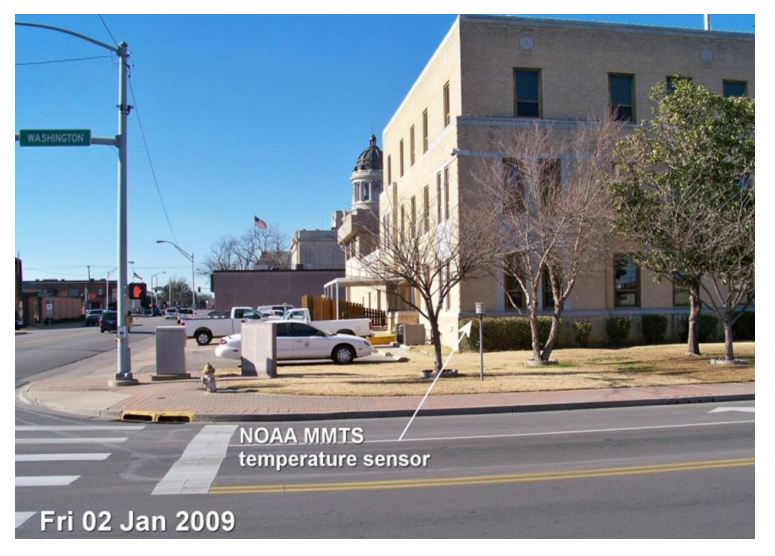
An example is shown in Figure 2 below, showing the NOAA USHCN temperature sensor for Ardmore, OK.

Figure 2 - USHCN Temperature sensor located on street corner in Ardmore, OK in full viewshed of multiple heatsinks.
Following up on a paper published by the authors in 2010, Analysis of the impacts of station exposure on the U.S. Historical Climatology Network temperatures and temperature trends2 which concluded:
Temperature trend estimates vary according to site classification, with poor siting leading to an overestimate of minimum temperature trends and an underestimate of maximum temperature trends, resulting in particular in a substantial difference in estimates of the diurnal temperature range trends....this new study is presented at AGU session A43G-0396 on Thursday Dec. 17th at 13:40PST and is titled Comparison of Temperature Trends Using an Unperturbed Subset of The U.S. Historical Climatology Network
A 410-station subset of U.S. Historical Climatology Network (version 2.5) stations is identified that experienced no changes in time of observation or station moves during the 1979-2008 period. These stations are classified based on proximity to artificial surfaces, buildings, and other such objects with unnatural thermal mass using guidelines established by Leroy (2010)1. The United States temperature trends estimated from the relatively few stations in the classes with minimal artificial impact are found to be
collectively about 2/3 as large as US trends estimated in the classes with greater expected artificial impact. The trend differences are largest for minimum temperatures and are statistically significant even at the regional scale and across different types of instrumentation and degrees of urbanization. The homogeneity adjustments applied by the National Centers for Environmental Information (formerly the National Climatic Data Center) greatly reduce those differences but produce trends that are more consistent with the stations with greater expected artificial impact. Trend differences are not found during the 1999- 2008 subperiod of relatively stable temperatures, suggesting that the observed differences are caused by a physical mechanism that is directly or indirectly caused by changing temperatures.
Key findings:
Google Earth imagery, and curator interviews have yielded a well-distributed 410 station subset of the 1218 station USHCN network that is unperturbed by Time of Observation changes, station moves, or rating changes, and a complete or mostly complete 30-year dataset. It must be emphasized that the perturbed stations dropped from the USHCN set show significantly lower trends than those retained in the sample, both for well and poorly sited station sets.
1. Comprehensive and detailed evaluation of station metadata, on-site station photography, satellite and aerial imaging, street level These differences are significant in Tmean, and most pronounced in the minimum temperature data (Tmin). (Figure 3 and Table 1)
2. Bias at the microsite level (the immediate environment of the sensor) in the unperturbed subset of USHCN stations has a significant effect on the mean temperature (Tmean) trend. Well sited stations show significantly less warming from 1979 - 2008.
3. Equipment bias (CRS v. MMTS stations) in the unperturbed subset of USHCN stations has a significant effect on the mean temperature (Tmean) trend when CRS stations are compared with MMTS stations. MMTS stations show significantly less warming than CRS stations from 1979 2008. (Table 1) These differences are significant in Tmean (even after upward adjustment for MMTS conversion) and most pronounced in the maximum temperature data (Tmax).
4. The 30-year Tmean temperature trend of unperturbed, well sited stations is significantly lower than the Tmean temperature trend of NOAA/NCDC official adjusted homogenized surface temperature record for all 1218 USHCN stations.
5. We believe the NOAA/NCDC homogenization adjustment causes well sited stations to be adjusted upwards to match the trends of poorly sited stations.
6. The data suggests that the divergence between well and poorly sited stations is gradual, not a result of spurious step change due
to poor metadata.
The study is authored by Anthony Watts and Evan Jones of surfacestations.org , John Nielsen-Gammon of Texas A&M , John R. Christy of the University of Alabama, Huntsville and represents years of work in studying the quality of the temperature measurement system of the United States.
Lead author Anthony Watts said of the study: “The majority of weather stations used by NOAA to detect climate change temperature signal have been compromised by encroachment of artificial surfaces like concrete, asphalt, and heat sources like air conditioner exhausts. This study demonstrates conclusively that this issue affects temperature trend and that NOAA’s methods are not correcting for this problem, resulting in an inflated temperature trend. It suggests that the trend for U.S. temperature will need to be corrected.” He added: “We also see evidence of this same sort of siting problem around the world at many other official weather stations, suggesting that the same upward bias on trend also manifests itself in the global temperature record”.
The full AGU presentation can be downloaded here.
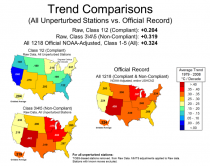
Figure 3 - Comparisons of well sited (compliant Class 1&2) USHCN stations to poorly sited USHCN stations (non-compliant, Classes 3,4,&5) by CONUS and region to official NOAA adjusted USHCN data (V2.5) for the entire (compliant and non-compliant) USHCN dataset.
[1] Leroy, M. (2010): Siting Classification for Surface Observing Stations on Land, Climate, and Upper-air Observations JMA/WMO Workshop on Quality Management in Surface, Tokyo, Japan, 27-30 July 2010
[2] Fall et al. (2010) Analysis of the impacts of station exposure on the U.S. Historical Climatology Network temperatures and temperature trends