


By Joseph D’Aleo. CCM
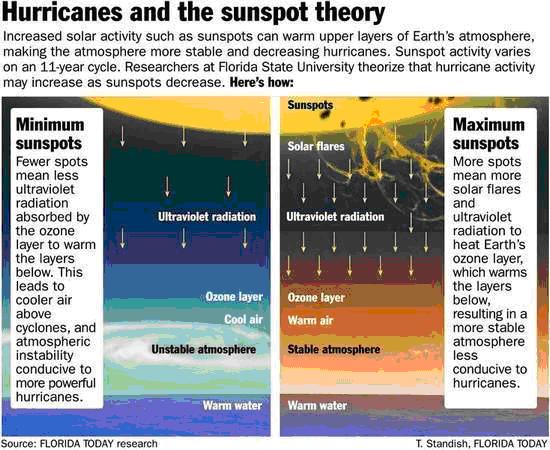
Recent research by Robert Hodges and Jim Elsner of Florida State University (GRL June 2010) found the probability of three or more hurricanes hitting the United States goes up drastically during low points of the 11-year sunspot cycle related to reduced ultraviolet radiation during the quiet sun which leads to less warming of the upper atmosphere and thus greater instability of the atmosphere. Their work was published this month in the scientific journal Geophysical Research Letters (Elsner, J. B., T. H. Jagger, and R. E. Hodges (2010), Daily tropical cyclone intensity response to solar ultraviolet radiation, Geophys. Res. Lett., 37, L09701, doi:10.1029/2010GL043091).
For hurricanes to form, the atmosphere must cool fast enough, at the right heights, to make it unstable enough for storm clouds to form. This thunderstorm activity enables heat stored in the ocean to be unleashed, developing into tropical cyclones. As the “heat-engine theory” of hurricanes goes, storm strength decreases when the layer near the hurricane’s top warms.
The sun’s yearly average radiance during its 11-year cycle only changes about one-tenth of one percent, according to NASA’s Earth Observatory. But the warming in the ozone layer can be much more profound, because ozone absorbs ultraviolet radiation. Between the high and low of the sunspot cycle, radiation can vary more than 10 percent in parts of the ultraviolet range, Elsner has found (figure below, enlarged here).
Baldwin and Dunkerton (2004) had found similarly, although solar irradiance varies 0.1- 0.15 (this cycle) over the 11 year cycle, radiation at longer UV wavelengths increased by several (6-8% or more) percent with still larger changes (factor of two or more) at extremely short UV and X-ray wavelengths.
Energetic flares increase the UV radiation by 16%. Ozone in the stratosphere absorbs this excess energy and this heat has been shown to propagate downward and affect the general circulation in the troposphere.
Both the production and destruction of ozone in the stratosphere are exothermic (heat releasing) processes. The ozone in the stratosphere is produced by photochemical reactions involving O2. When diatomic oxygen in the stratosphere absorbs ultraviolet radiation with wavelengths less than 240 nm, it breaks apart into two oxygen atoms.
O2(g) + uv light -> 2 O(g)
(light wavelength < 240 nm)
The resulting oxygen atoms combine with O2 molecules to form ozone.
O(g) + O2(g) -> O3(g)
This reaction is exothermic, and the net effect of the previous two reactions is the conversion of three molecules of O2 to two molecules of ozone with the simultaneous conversion of light energy to heat. Ozone absorbs ultraviolet radiation with wavelengths as long as 290 nm. This radiation causes the ozone to decompose into O2 molecules and oxygen atoms.
O3(g) + uv light -> O2(g) + O(g)
(light wavelength < 290 nm)
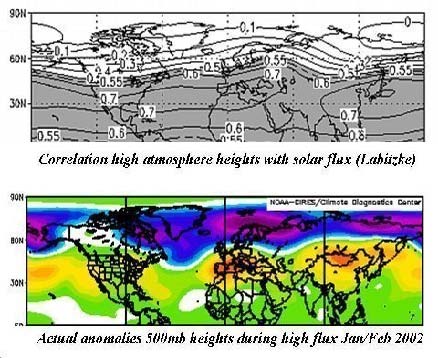
Labitzke and Van Loon (1988) and later Labitzke in numerous papers has shown that high flux (which correlates very well with UV) produces a warming in low and middle latitudes in winter in the stratosphere with subsequent dynamical and radiative coupling to the troposphere. Shindell (1999) used a climate model that included ozone chemistry to reproduce this warming during high flux (high UV) years.
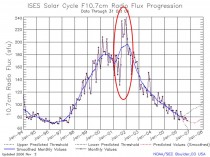
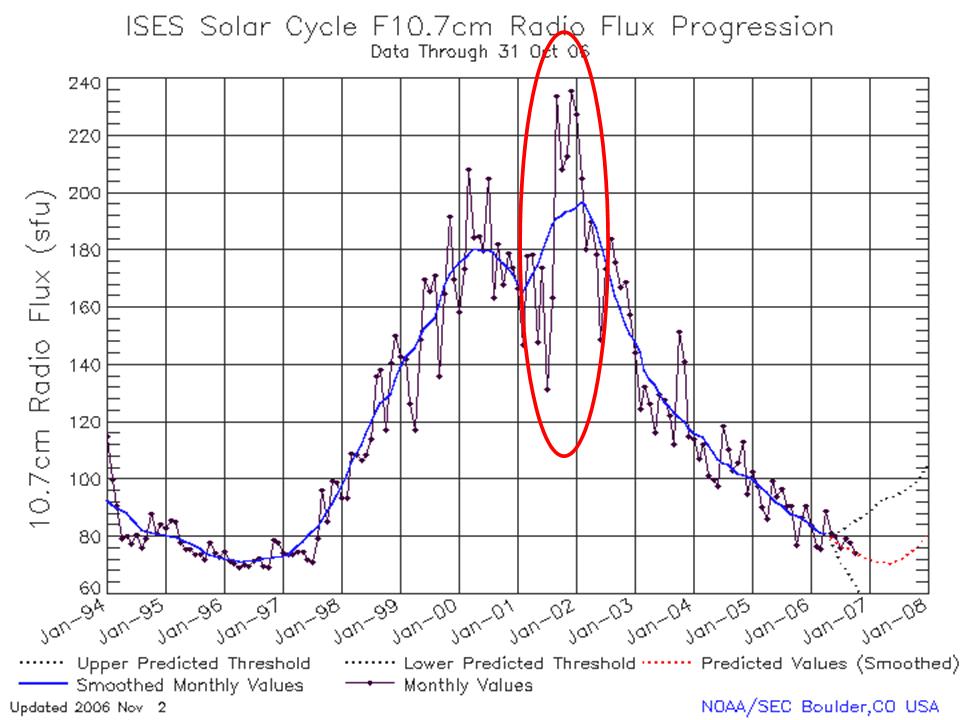
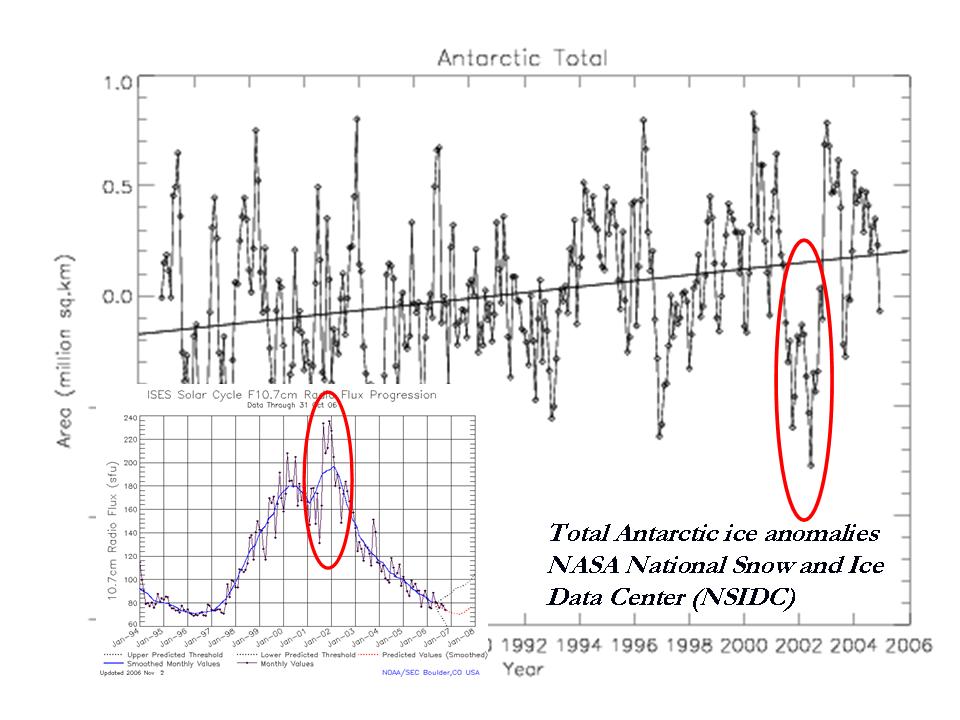
NOAA SEC solar flux (10.7cm) during cycle 23. Note the second solar max with extremely high flux from September 2001 to April 2002.
The winter of 2001/02 (figure above, enlarged here), when cycle 23 had a very strong high flux second maxima provided a perfect verification of Shindell and Labitzke and Van Loon’s (figure below, enlarged here) work.
Labitzke correlated stratospheric heights with solar flux and actual height anomalies in the mid-troposphere during the high flux mode of the second solar max in early 2002.
The warming that took place with the high flux from September 2001 to April 2002 caused the northern winter polar vortex to shrink and the southern summer vortex to break into two centers for the first time ever observed. This disrupted the flow patterns and may have contributed to the brief summer breakup of the Larsen ice sheet (figures below enlarged here, here and here).
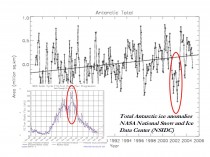
NASA NSIDC satellite derived Total Antarctic ice extent anomalies from 1979 to 2005. Note the dropoff with the Larsen ice sheet break-up in the summer of 2002 corresponding to major atmospheric changes during the high flux second solar max.

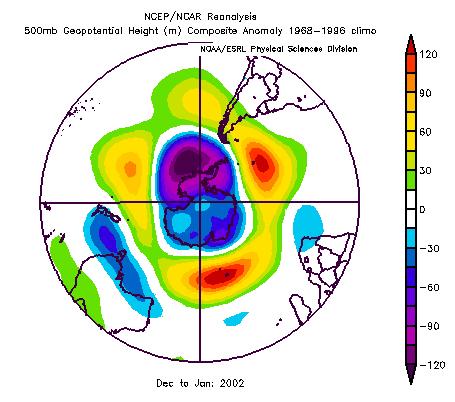
December 2001 to January 2002 500mb height anomalies for Southern Hemisphere. Note the ring of warming with the high flux induced UV ozone chemistry as a ring surrounding a shrunken polar vortex as seen in the Northern Hemisphere. Note how the vortex actually became a dipole with weakness in center. The changing winds and currents very likely contributed to the ice break of the Larsen ice sheet.
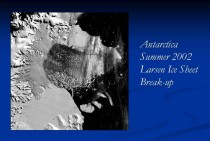
Larsen ice sheet break up late summer 2002 following strong solar flux break-up of southern polar vortex.
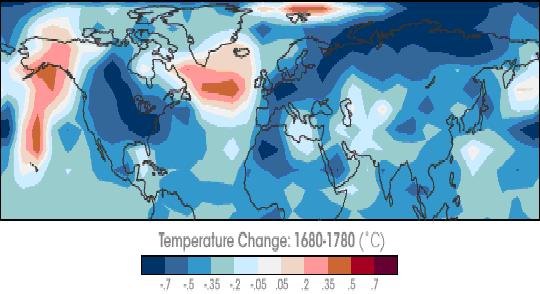
NASA reported on the use of the Shindell Ozone Chemistry Climate Model to explain the Maunder Minimum (Little Ice Age) (below, enlarged here).
Shindell ozone chemistry model forecast of the difference between the quiet solar period of the Maunder Minimum and the active late 18th century.
Their model showed when the sun was quiet in 1680, it was much colder than when it became active again one hundred years later. “During this period, very few sunspots appeared on the surface of the Sun, and the overall brightness of the Sun decreased slightly. Already in the midst of a colder-than-average period called the Little Ice Age, Europe and North America went into a deep freeze: alpine glaciers extended over valley farmland; sea ice crept south from the Arctic; and the famous canals in the Netherlands froze regularly - an event that is rare today.”
The UV is only one candidate solar related variance that may influence climate. Though the IPCC and alarmist scientists like to point to the small changes in the brightness as not being of significance and thus prove that the sun does not rule the climate, these other factors collectively likely make the sun the primary candidate for climate change - even the warming from 1977 to 1998 that is above and beyond the urbanization and land use change effects. It may be the sun works through the oceans as an intermediary or amplifying factor by influencing the multidecadal oscillations as Scafetta (2010) and others have suggested.
References:
Baldwin, M.P., Dunkerton, T.J.: (2004) The solar cycle and stratospheric-tropsospheric dynamical coupling, JAS 2004
Elsner, J. B., T. H. Jagger, and R. E. Hodges (2010), Daily tropical cyclone intensity response to solar ultraviolet radiation, Geophys. Res. Lett., 37, L09701, doi:10.1029/2010GL043091
Labitzke, K., The global signal of the 11-year sunspot cycle in the stratosphere: Differences between solar maxima and minima, Meteorol. Zeitschift, 10, 83-90, 2001.
Scafetta, N. “Empirical analysis of the solar contribution to global mean air surface temperature change” Journal of Atmospheric and Solar-Terrestrial Physics 71 1916-1923 (2009), doi:10.1016/j.jastp.2009.07.007
Scafetta, N., Empirical evidence for a celestial origin of the climate oscillations and its implications. Journal of Atmospheric and Solar-Terrestrial Physics (2010), doi:10.1016/j.jastp.2010.04.015
Shindell, D.T., D. Rind, N. Balachandran, J. Lean, and P. Lonergan, Solar cycle variability, ozone, and climate, Science, 284, 305-308, 1999a.
See more here.