


By Ken Gregory
The IPCC used the CO2 forcing of 3.71 W/m2. They multiply this by a feedback factor of 3.08, which boosts the total forcing due to CO2 to 11.4 W/m2. Monckton’s summary shows that 76% of this feedback factor is due to clouds and water vapour (with lapse rate change). But both of these feedbacks are the wrong sign! Roy Spencer shows that clouds cause a negative feedback, not positive, based on satellite data. He shows that modeler have interpreted cloud changes as a feedback, instead of a cause of temperature change. This reversal of cause and effect makes cloud seem like a positive feedback, when they actually cause a negative feedback. But more importantly, the IPCC assumes that water vapour causes the largest positive feedback, but the Hartcode simulation runs using the NOAA water humidity data shows that water vapour causes a large negative feedback. You have seen my graph of relative humidity before which is linked here.
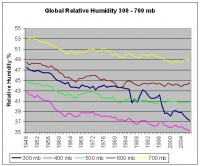
All climate models assume that relative humidity remains approximately constant with global warming. So if CO2 initially causes a small warming, this causes an increase in water content in the models, resulting is a large positive feedback But the data shows a 21% drop of relative humidity at about 9 km altitude, just where the predicted hot spot is missing, directly contradicting the models.
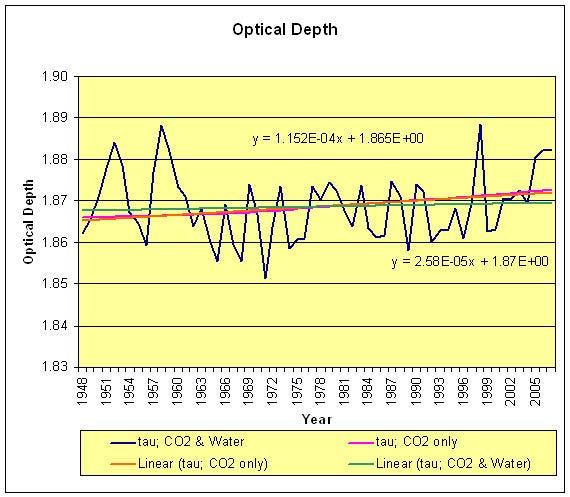
The Hartcode simulation makes no assumptions of how the greenhouse effect works, or how much temperatures changes with optical depth changes. (Optical depth is related the surface radiation flux Su by Su = OLR(1+tau +exp(-tau))/2, where tau = optical depth). Here is a graph showing the optical depth changes over the last 60 years (water vapour and CO2), and the change due to CO2 only.
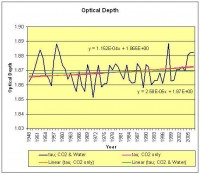
Look at the pink curve, CO2 only. This is with water vapour held constant and CO2 only changing. The trend (orange line) shows an increase of 1.152 10-4 X 60 years = +0.0069, or about +0.37% in 60 years, confirming our belief the CO2 has a tiny direct effect on temperature.
The blue curve shows the optical depth including CO2 and water vapour. Note that water vapour varies much more that CO2. But instead of causing a huge positive feedback, water caused a strong negative feedback, and reduced the optical depth trend (green line) to 2.58 10-5 X 60 years = + 0.0015, or about 0.083% in 60 years. This means that water vapour has offset 78% of the greenhouse effect of CO2 change over the last 60 years. This is very significant! Note also that there has been a dramatic drop in water vapour at all altitudes in 2008, which is not included in the above calculations. I do recognize that the early NOAA data might be less accurate than more recent data, but this is what the data shows.
This data supports Miskowski’s theory of the greenhouse effect. Miskolcki shows the standard theory uses inappropriate boundary conditions. When real boundary conditions are used, he shows that the atmosphere maintains a saturated greenhouse effect, controlled by water vapor content. I encourage you to review this article, based on a draft by Dr. Noor van Andel. In summary, I think there are two main reasons climate models fail: 1. water vapour causes a negative feedback, not a large positive feedback, 2. clouds cause a negative feedback, not a positive feedback. See PDF here.