


This letter was sent to NASA GISS’s James Hansen by Arvind Kumar after he noticed that the anomalies he had downloaded each year had changed with each new update.
Dear Dr. Hansen,
I see that the numbers in the data set here keep changing. I know that there were reports that you revised them once to make 1934 the hottest year on record and this was due to a bug. However, when I go to archive.org, I find that the numbers for specific years change arbitrarily and I have picked dates after you made the change. Perhaps it is not arbitrary, and maybe this is the famous “Mike’s Nature Trick” that everyone speaks of? Can you please explain why the numbers for the same year keeps changing?
Here are links and the data sets for 01/10/2006, 10/14/2007, 02/21/2008 and current date.
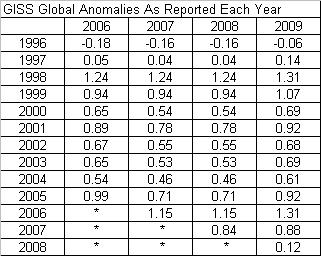
The numbers for the Annual Mean from the four links for many of the years are not constant but are as follows (enlarged here):
It is disturbing because it appears that the numbers are touched every year so that the claim of the current year being the “hottest on record” or the “second hottest on record” can be made. This would be consistent with, for example, 2005 when the number was first .99 but needed to be wound down to .71 the next year when the numbers for 2006 came out so that the 2006 number was significantly higher than the number for 2005. Subsequently, the 2005 number had to be increased in order to make the average for the decade higher.
Thanks,
Arvind
Arvind then documented the year to year changes here.
Well the answer came from E. M. Smith of the Musings from the Chiefio site:
“It is inherent to the way GIStemp runs that every month will produce a new and different history.
EACH and EVERY time the input data changes (by, for example, having a new month of data as time passes) will produce a different set of ‘homogenization’ adjustments and different UHI adjustments and GRID Box adjustments.
One example: All records shorter than 20 years are disposed. If a record is 19 years 11 months long, it is simply thrown away. In the next month, ti will be 20 years old, and so kept. Suddenly there are 20 years of history for this new record and just as suddenly it will be used to fill in missing data in other temperature series for the past 20 years. More perniciously, it will also participate in UHI adjustments that may extend to the beginning of time in the data set (it can help determine the adjustment factor during the period of overlap, that may then be applied in far removed times.)
So it is simply to be expected that history, in GIStemp, is a polite fiction that is re-written on each monthly computer run. So you can point this out to Hansen and friends and they will simply nod approvingly.”