Aug 05, 2013
New papers call into question the global sea surface temperature record - Published in Ocean Science
Climate Deport and Hockeyschtick
New papers call into question the global sea surface temperature record
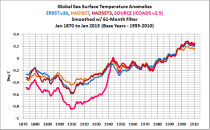
Two new companion papers published in Ocean Science call into question the data and methods used to construct global sea surface temperature records of the past 150 years. The authors find that measurements taken from ship engine cooling intakes can be “overly-warm by greater than 0.5C on some vessels,” which by way of comparison is about the same magnitude as the alleged global sea surface temperature warming since 1870.
Enlarged
Furthermore, the authors “report the presence of strong near-surface temperature gradients day and night, indicating that intake and bucket measurements cannot be assumed equivalent in this region. We thus suggest bucket and buoy measurements be considered distinct from intake measurements due to differences in sampling depth. As such, we argue for exclusion of intake temperatures from historical SST datasets and suggest this would likely reduce the need for poorly field-tested bucket adjustments. We also call for improvement in the general quality of intake temperatures from Voluntary Observing Ships… We suggest that reliable correction for such warm errors is not possible since they are largely of unknown origin and can be offset by real near-surface temperature gradients.”
Data sets combining ship intake and bucket measurements show ~0.5C warming since 1870, but this new paper argues that the two types of measurement are from different sampling depths and should not be combined. Graph source: Bob Tisdale via WUWT
For more on the ship intake vs. buckets issue and the questionable adjustments involved, see these posts at WUWT
Historical Sea Surface Temperature Adjustments/Corrections aka “The Bucket Model”…
Buckets, Inlets, SST’s and all that - part 1
Resolving the biases in century-scale sea surface temperature measurements reveals some interesting patterns
Comparing historical and modern methods of sea surface temperature measurement Part 1: Review of methods, field comparisons and dataset adjustmentsJ. B. R. Matthews School of Earth and Ocean Sciences, University of Victoria, Victoria, BC, Canada Abstract. Sea surface temperature (SST) has been obtained from a variety of different platforms, instruments and depths over the past 150 yr. Modern-day platforms include ships, moored and drifting buoys and satellites. Shipboard methods include temperature measurement of seawater sampled by bucket and flowing through engine cooling water intakes. Here I review SST measurement methods, studies analysing shipboard methods by field or lab experiment and adjustments applied to historical SST datasets to account for variable methods. In general, bucket temperatures have been found to average a few tenths of a degree C cooler than simultaneous engine intake temperatures. Field and lab experiments demonstrate that cooling of bucket samples prior to measurement provides a plausible explanation for negative average bucket-intake differences. These can also be credibly attributed to systematic errors in intake temperatures, which have been found to average overly-warm by >0.5C on some vessels. However, the precise origin of non-zero average bucket-intake differences reported in field studies is often unclear, given that additional temperatures to those from the buckets and intakes have rarely been obtained. Supplementary accurate in situ temperatures are required to reveal individual errors in bucket and intake temperatures, and the role of near-surface temperature gradients. There is a need for further field experiments of the type reported in Part 2 to address this and other limitations of previous studies.
Comparing historical and modern methods of sea surface temperature measurement Part 2: Field comparison in the central tropical Pacific J. B. R. Matthews1 and J. B. Matthews21 School of Earth and Ocean Sciences, University of Victoria, Victoria, BC, Canada2 Dr. J. B. Matthews Consulting, Tennis Road, Douglas, Isle of Man, British Isles
Abstract. Discrepancies between historical sea surface temperature (SST) datasets have been partly ascribed to use of different adjustments to account for variable measurement methods. Until recently, adjustments had only been applied to bucket temperatures from the late 19th and early 20th centuries, with the aim of correcting their supposed coolness relative to engine cooling water intake temperatures. In the UK Met Office Hadley Centre SST 3 dataset (HadSST3), adjustments have been applied over its full duration to observations from buckets, buoys and engine intakes. Here we investigate uncertainties in the accuracy of such adjustments by direct field comparison of historical and modern methods of shipboard SST measurement. We compare wood, canvas and rubber bucket temperatures to 3 m seawater intake temperature along a central tropical Pacific transect conducted in May and June 2008. We find no average difference between the temperatures obtained with the different bucket types in our short measurement period (∼1 min). Previous field, lab and model experiments have found sizeable temperature change of seawater samples in buckets of smaller volume under longer exposure times. We do, however, report the presence of strong near-surface temperature gradients day and night, indicating that intake and bucket measurements cannot be assumed equivalent in this region. We thus suggest bucket and buoy measurements be considered distinct from intake measurements due to differences in sampling depth. As such, we argue for exclusion of intake temperatures from historical SST datasets and suggest this would likely reduce the need for poorly field-tested bucket adjustments. We also call for improvement in the general quality of intake temperatures from Voluntary Observing Ships. Using a physical model we demonstrate that warming of intake seawater by hot engine room air is an unlikely cause of overly warm intake temperatures. We suggest that reliable correction for such warm errors is not possible since they are largely of unknown origin and can be offset by real near-surface temperature gradients.
Aug 03, 2013
Calling Mark Serreze, open sea water in death spiral too. Penguins won’t know what open sea water is
By Pierre Gosselin
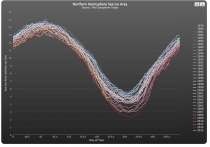
Remember a few years ago when Dr. Mark Serreze, Director of the National Snow and Ice Data Center, nsidc.org, talked about the Arctic being in a death spiral because of sea ice was disappearing due to man-made global warming? Well, I’ve found another one of his death spirals...this one in Antarctica, which has been breaking sea ice records daily.
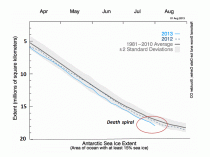
Antarctic Sea Ice chart inverted so that even alarmist scientists can read it.
Call it the Antarctic open sea water death spiral.
Remember that alarmist scientists normally only see warming death spirals, and not cooling ones. So to help them out, I’ve turned the Antarctic sea ice chart upside down. When you do that, the sea Antarctic ice chart looks like the summer Arctic ice melt. Now we can clearly see the Antarctic open-sea-water death spiral.
Soon penguins won’t know what open sea water is!
Of course, now we should all worry about albedo reflecting the heat back into space instead of getting absorbed by the dark sea water. This lack of heat will then cause accelerated ice growth. By 2050 the entire south pole may be covered with sea ice year round.
---------------
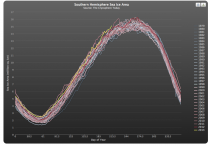
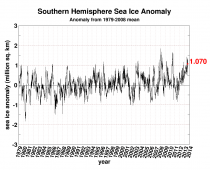
Note see the Cryosphere Today plots for the sea ice extent, highest for the day in the entire record and in a season that ranks #3 since 1979.
Enlarged
Enlarged
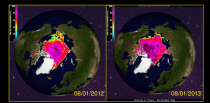
Meanwhile in the Northern Hemisphere, we are well above last year.
Enlarged
Enlarged
Enlarged
Jul 28, 2013
EPA and the Supreme Court - why the EPA needs to be stopped
UPDATE: Republican Study Committee Chairman Steve Scalise’s anti-carbon tax amendment passed the House today by a vote of 237 to 176 including 12 democrats. Passage of the amendment marks the first time the House has gone on record opposing a carbon tax.
“President Obama’s plan to impose a tax on carbon would cause household electricity rates to skyrocket while destroying millions of American jobs,” Scalise said. “The House sent a strong bipartisan message to President Obama that a tax on carbon would devastate our economy and he needs to drop any idea of imposing this kind of radical regulation.”
Also, Thursday’s a subpoena came from House Science, Space and Technology Committee Chairman Lamar Smith, Texas Republican, who said it’s been nearly two years since EPA promised to turn over the science it used to justify what Mr. Smith said were “costly” new regulations.
“The EPA should not base its regulations on secret data,” Mr. Smith said. “The EPA’s lack of cooperation contributes to the suspicion that the data sets do not support the agency’’s actions. The American people deserve all of the facts and have a right to know whether the EPA is using good science.”
Mr. Smith said Gina McCarthy, who was then deputy administrator and has since been approved as EPA administrator, promised to turn over the science data in 2011, but that the agency has failed to do so.
It was the science committee’s first subpoena in 21 years, Mr. Smith said.
--------
U.S. Closed for Business under Potential Ozone Regulations
Jack Gerard
Environmental benefits can be achieved without imposing massive costs that jeopardize job creation, economic growth, revenue generation and energy affordability. Yet that is just what many of the EPA’s current and proposed regulations threaten to do.
In 2008, the EPA approved new ozone standards of 75 parts per billion - the most stringent standards ever. Although these standards are only now starting to be implemented, the agency may lower the standards an additional 20 percent to 60 parts per billion in the coming months. These new standards could be the costliest EPA regulations ever:
97 percent of the population could be deemed out of compliance and subject to new emission reductions requirements.
Many communities could be forced to shut down business activity in a futile attempt to push ozone levels below background levels, stifling job creation and economic growth
Even pristine areas like Yellowstone National Park could be considered noncompliant due to naturally occurring levels of ozone.
Analysis of similar standards proposed and withdrawn in 2011 would have destroyed an estimated 7.3 million U.S. jobs and added $1 trillion in new regulatory costs per year between 2020 and 2030.
We’re already seeing reductions in ozone and particulate emissions under current standards, and these benefits will continue to accrue as the 2008 regulations are implemented. Since 1980, the amount of ground level ozone has decreased by 28 percent, while carbon dioxide emissions from energy dropped 12 percent between 2005 and 2012 to reach their lowest level since 1994.
Rather than propose unattainable new standards that are not justified under current health studies, EPA should determine reasonable controls for achieving the 2008 standards and give them a chance to work.
We’ve made great progress in improving our environmental performance. It’s possible to build on that progress without implementing unworkable standards that could do great damage to our economy while creating no discernible health benefits.

Enlarged
The house republicans are the only hope America has to avoid $8 gasoline and heating oil and an unprecedented economic crisis to go along with the daily growing list of scandals and disasters on Obama’s watch. Please call the house (202) 224-3121 and contact the democrats and republicans and encourage them to stand up to the EPA and the rest of Obama’s green goons. They may be on summer leave but you can leave messages. Contact them in your home state and tell them why it is the democrat leadership and the administration that has the science wrong. They need to hear from you.
---------
By Joseph D’Aleo, Icecap
In the process leading up to the EPA Endangerment Finding approval, I filed numerous comments that went into the record though they did not move the EPA off their position. Then worked with a great team of top leaders, scientists and lawyers on a science based Amicus brief to the DC Circuit Court. The liberal DC Circuit Court found in favor of the EPA but a minority opinion opened the door for a Cert petition to the Supreme Court (SCOTUS_ to review the DC court decision. The DC Circuit Court blocked the submission of the EPA’s own Inspector General’s report to the EPA chiding them for not doing its own scientific evaluation as required by the Information Quality Act.
Our top notch team of lawyers repackaged the arguments in an Amicus Brief to the SCOTUS, one of 9 such briefs. The EPA responded along with the NGOs (Sierra Club, World Wildlife Organization, etc) urging the court to ignore the science arguments we made.
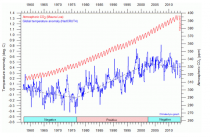
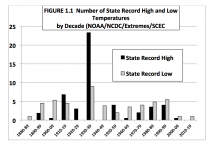
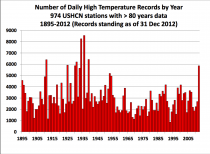
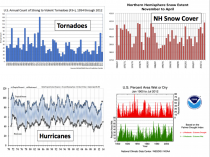
We had argued the three lines of evidence the EPA built its whole case in made were all falsified by actual data. The warming had stopped, the changes and extremes in the climate predicted with that warming were not occurring and their models, never validated, were failing miserably. Without the warming and the results predicted, their entire house of cards had collapsed.
EPA has its accomplices. To make claims about unprecedented warmth in recent decades, NOAA and NASA significantly modified the historical data with a major cooling of the previous warm blip in the 1930s. They couldn’t without detection modify the recent data to hide the current stasis and/or decline in global temperatures but could lower the past to make the recent data seem special. The liberal media was more than happy to hype every extreme weather event and the result as unprecedented. The universities purged the ranks of skeptics where possible and replaced them with environmental ‘scientists’ and other scientists more than willing to rake in big dollars as Eisenhower warned half a century ago. Jointly the scientists and universities were more than willing to accept some of the many tens of billions in grant bribes to build the case for their theory. The engorged liberal universities require a tuition increases a multiple of inflation rate with tuition loan debt now exceeding $1 trillion. Then there are the labs and NGOs and phony groups like the Union of Concerned Scientists and running tinker toy models and doing official looking reports that local and state politicians are using to spend billions of the state’s taxes to stop the rise of the sea (which data says will be just 6.7 inches the next century) and replace fossil fuels and hydropower with useless and unreliable wind and solar.
The message keeps morphing as forecasts fail - global warming becomes climate change which becomes climate disruption which is abandoned by focus on extremes. Even there when you look at the data it fails to demonstrate the claims made. But they are counting on the deafness to the truth by the liberal zealots and indifference of the low information voters.
Enlarged
Enlarged
Enlarged
Enlarged

Enlarged
The US Solicitor General, Department of Justice, and EPA attorneys filed their petition to the US Supreme Court requesting that it deny the petitions from the groups in which we and organizations such as SEPP participate asking for the court to review the decision by the US Circuit Court of Appeals upholding the EPA Endangerment Finding (EF) that greenhouse gas emissions (GHG), particularly carbon dioxide (CO2), endanger public health or welfare.
The standard asserted in the petition is quite loose. “Although it found some ‘uncertainties’ in the scientific data, the EPA ‘determined that the body of scientific evidence compellingly supports “the finding that greenhouse gases may reasonably be anticipated to endanger public health and public welfare by driving global climate change.”
Elsewhere the petition states: “… EPA explained that the global warming by greenhouses gas emissions will produce an increase in heat-related deaths; an increase in respiratory illness and premature death relating to poor air quality; and increased risk of death, injury, and disease relating to extreme weather events; and an increase in food- and water-borne diseases.” It goes on to state: “greenhouse gas pollution is reasonably anticipated to endanger public welfare by causing ‘net adverse impacts on U.S. food production and agriculture, with the potential for significant disruptions on crop failure in the future’” by endanger[ing] U.S. forestry in both the near and long term’"…
Each one of these claims echoed by the administration are patently false. The president hopes to bypass congress and use the EPA to destroy the coal and fossil fuel industry and substitute renewables. Such an effort was tried and failed miserably in Europe and many have been abandoned as wind and solar have proved unreliable and caused energy costs to skyrocket leading to thousands of excess deaths in the brutal winters the last 5 years (not to mention the literal millions of birds, many endangered, and insect controlling bats) Ironically emissions have risen more rapidly as fossil fuel plants had to be used in less efficient back up modes for use when the wind stops blowing and the sun isn’t shining.
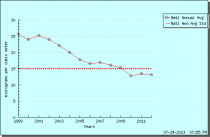
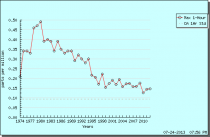
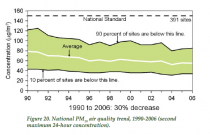
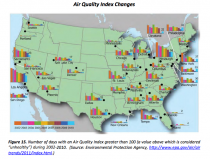
But you can expect more of the scare tactics like those used by our ideologue President in his shameful address on his climate plans filled with false claims and half truths and the false ads produced by the government subsidized American Lung Association (remember the infomercial and campaign ads with coughing child in the baby carriage near the capitol or child with oxygen masks) and the EPA itself claiming CARBON POLLUTION from fossil fuels is leading to increased asthma and has to be stopped. Natural gas plants are clean and even coal plants have scrubbers and emit mainly water vapor and CO2. CO2 is not carbon pollution. It is plant fertilizer. Every breath you take exhales 40,000 ppm CO2 into air with just under 400 ppm so it is clear increasing 1 to 2 ppm per year in ambient air isn’t a health hazard. Particulates from burning wood or coal without scrubbers can cause issues as can ozone in smog, but both have declined for decades in the EPA’s own data, so if asthma is increasing it is for other reasons (tighter insulated homes, better survival rates for premature babies, increased pets in the home, smoking, etc).
Here is the analysis of both particulates and ozone trends for the Southern California LA County air quality district and then the national trend as determined by the EPA.
Enlarged
Enlarged
Enlarged
Enlarged
Please help us fight the EPA and NGO’s efforts to destroy America’s energy future and enable their regulatory assault on industry and on our economy to get the green light (now it is yellow). If the SCOTUS decides in September to hear the case, we will only have a matter of weeks to respond. We have the teams ready, we would like to fund their efforts. All the work so far has been pro bono. Donations are needed small and large. Use the donation button on the left. Small donations are appreciated. But corporate help is critical. You pay a little now to save a lot (including maybe your business) later. Contact us at frostdoc@aol.com to give us your contact information so we can tell you how you can donate to C3 or C4 efforts.
Jul 25, 2013
NOAA: 2012 Heat Wave March and July explained by natural variability - similar to 1910, 1934
NOAA
The Making of An Extreme Event: Putting the Pieces Together
Randall Dole, Martin Hoerling, Arun Kuma, Jon Eischeid, Judith Perlwitz, Xiao-Wei Quan, George Kiladis, Robert Webb, Donald Murray, Mingyue Chen, Klaus Wolter, and Tao Zhang
NOAA Earth System Research Laboratory, Boulder, Colorado, NOAA Climate Prediction Center, Camp Springs, MD, University of Colorado, Cooperative Institute for Research in Environmental Sciences, Boulder, Colorado
Abstract
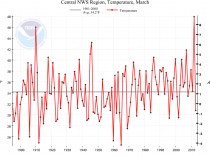
We examine how physical factors spanning climate and weather contributed to record warmth over the central and eastern U.S. in March 2012, when daily temperature anomalies at many locations exceeded 20C. Over this region, approximately 1C warming in March temperatures has occurred since 1901. This long-term regional warming is an order-of-magnitude smaller than temperature anomalies observed during the event, indicating the most of the extreme warmth must be explained by other factors. Several lines of evidence strongly implicate natural variations as the primary cause for the extreme event.
The 2012 temperature anomalies had a close analogue in an exceptionally warm U.S. March occurring over 100 years earlier, providing observational evidence that an extreme event similar to March 2012 could be produced through natural variability alone. Coupled model forecasts and simulations forced by observed sea surface temperatures (SSTs) show that forcing from anomalous SSTs increased the probability of extreme warm temperatures in March 2012 above that anticipated from the long-term warming trend. In addition, forcing associated with a strong Madden-Julian Oscillation further increased the probability for extreme U.S. warmth and provided important additional predictive information on the timing and spatial pattern of temperature anomalies.

Enlarged
Enlarged
The results indicate that the superposition of a strong natural variation similar to March 1910 on long-term warming of the magnitude observed would be sufficient to account for the record warm March 2012 U.S. temperatures. We conclude that the extreme warmth over the central and eastern U.S. in March 2012 resulted primarily from natural climate and weather variability, a substantial fraction of which was predictable.
Note: like March 2012 and March 1910, July 2012 was an outlier similar to July 1934, and 1901 on the warm side and July 2009 to 1992, 1950 and 1915 on the cold side.
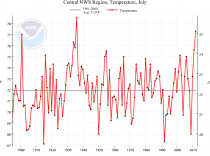
Enlarged
--------
Arctic cold and snowstorm
Joseph D’Aleo, CCM
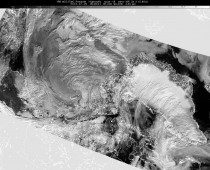
Remember a year ago when few days of July ‘warmth’ with strong blocking over Greenland had the media abuzz. Last July a brief spell of temperatures in the mid 30s had caused some surface slush formation on top of the 1 to 1.5 mile thick Greenland ice. The NASA sensors merely color-coded the phase of the water: ice (white), mixed water and ice (rose) and none (land grey). Rose meant some surface liquid. It quickly refroze in a few days even before the flurry of news stories hyping it stopped.
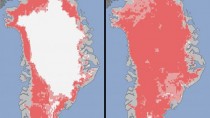
Enlarged

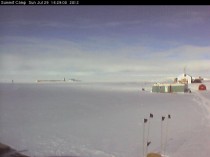
You can see the ice at the summit was very much still in evidence.
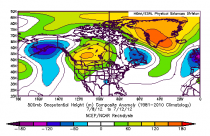
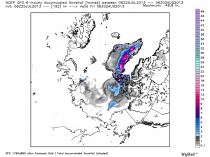
Well a year later, an interesting opposite scenario with a deep, cold arctic low is bringing snow to the arctic and Greenland in late July.
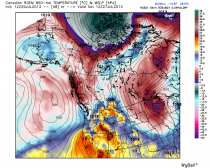
The upper low is seen at 500mb and the cold air at 850mb.
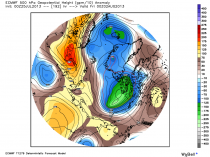
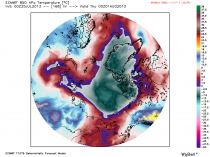
See the snow forecast the next 8 days on the arctic ice and Greenland.
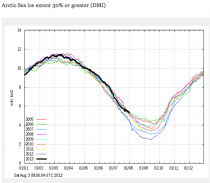
What about the arctic ice? Running well above last year and 2007. Strong polar systems with winds can move ice around and compact the ice or push it out of the arctic into the Atlantic so predictions of where we end up next month are still difficult. As I have posted, the Atlantic and Pacific Decadal Oscillations control the ice extent. We have been in modes that favored the decline of ice since 1995 which will soon change.
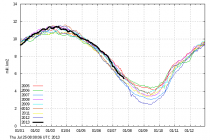
Arctic Sea ice extent 30% or greater (DMI) Enlarged
Jul 21, 2013
Idso’s Rebuttal to Scott Doheys Senate testimony on ocean acidification
By Judith Curry
Scott Doney’s testimony
Excerpts from Doney’s recent congressional testimony [link]
Rebuttal
Craig Idso has written comprehensive rebuttal to the NRDC film “Acid Test: The Global Challenge of Ocean Acidification.” [link]
So what’s the story here? Are coral reefs really in their last decades of existence? Will the shells of other calcifying marine life also dissolve away during our lifetimes? The NRDC film certainly makes it appear that such is the case; but a little scientific sleuthing reveals nothing of substance in this regard. In fact, even a cursory review of the peer-reviewed scientific literature reveals that an equally strong case, if not a more persuasive one, can be made for the proposition that the ongoing rise in atmospheric CO2 concentration will actually prove a boon to calcifying marine life. Sadly, however, the NRDC chose to present an extreme one-sided, propagandized view of ocean acidification; and in this critique we present the part of the story that they clearly don’t want you to know. [25 pages of text, 13 pages of references]
From the Conclusions:
In conclusion, based on the many real-world observations and laboratory experiments described above, it is clear that recent theoretical claims of impending marine species extinctions, due to increases in the atmosphere’s CO2 concentration, have no basis in empirical reality. In fact, these unsupportable contentions are typically refuted by demonstrable facts. As such, the NRDC’s portrayal of CO2-induced ocean acidification as a megadisaster-in-the-making is seen, at best, to be a one-sided distortion of the truth or, at worst, a blatant attempt to deceive the public.
Surely, the NRDC and the scientists portrayed in their film should have been aware of at least one of the numerous peer-reviewed scientific journal articles that do not support a catastrophic, or even a problematic, view of the effect of ocean acidification on calcifying marine organisms; and they should have shared that information with the public. If by some slim chance they were not aware, shame on them for not investing the time, energy, and resources needed to fully investigate an issue that has profound significance for the biosphere. And if they did know the results of the studies we have discussed, no one should ever believe a single word they may utter or write in the future.
Finally, if there is a lesson to be learned from the materials presented in this document, it is that far too many predictions of CO2-induced catastrophes are looked upon as sure-to-occur, when real-world observations show such doomsday scenarios to be highly unlikely or even virtual impossibilities. The phenomenon of CO2-induced ocean acidification is no different. Rising atmospheric CO2 concentrations are not the bane of the biosphere; they are an invaluable boon to the planet’s many life forms.
JC comment: So whose view of the ocean acidification is correct: Doney’s or Idso’s? In this instance, it is instructive for me to describe my own reasoning process, since I come to this topic with very little first hand knowledge, beyond understanding the basic chemistry of the problem.
When I saw Scott Doney listed as a witness for this hearing, I was very pleased, since he is a scientific heavy hitter on this subject. However, upon reading the first page of his testimony, the following statement raised my skeptical hackles, especially since their was no evidence or reference to support this:
Today the surface ocean is almost 30% more acidic than it was in pre-industrial times.
I found Doney’s testimony to be highly normative, something that I am not a fan of in testimony by scientists. I did a word search, looking for ‘uncertain’, ‘disagreement’, ‘debate’, ‘unknown’. The only statements I found were:
Decisions should incorporate precautionary considerations to account for the fact that potential carbon dioxide thresholds are presently unknown for many aspects of ocean acidification.
The potential biological consequences due to acidification are slowly becoming clearer at the level of individual species, but substantial uncertainties remain particularly at the ecosystem level.
For these reasons, Doney’s testimony didn’t score too high on my credibility meter, in spite of my acknowledgement of his expertise and stature in the field.
I figured that there has to be another side to this story, so I did a quick Google search and spotted Idso’s document. Idso’s document clearly states that there is another side to this story. Idso’s approach is more credible IMO, since he acknowledges that there are two sides to the story, that at this point may be equally plausible. I searched for the same 4 words; only spotted one use of ‘unknown’, so I am not sure how useful my little litmus test was.
The issue is this: failure of the ‘mainstream’ experts to adequately discuss uncertainty and alternative viewpoints leaves a void to be filled by the likes of Idso, with the inadvertent effect of elevating Idso’s essay more than it probably deserves.
That said, I cannot personally judge whether Doney’s or Idso’s arguments are better scientifically, without digging into the primary literature myself; and even then I am not sure how confident I would be in my own ability to assess this.
|


