Apr 04, 2022
From the archives - Pew Research Findings of what real scientists believed…
By Kenneth Richard, No Tricks Zone 2016
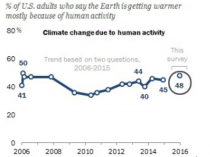
Americans’ beliefs about climate change were recently surveyed by the Pew Research Center, and the results were made public a few days ago. Pew pollsters found that a combined 51% of Americans agree that (a) there is no clear evidence the Earth is warming, or (b) natural factors are the main cause of climate changes. Therefore, just 48% of Americans believe the Earth is getting warmer, and this warming is mostly caused by humans. This belief percentage has essentially remained unchanged for the last 10 years, or since the survey was first conducted in 2006.
Enlarged
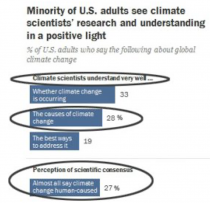
One key question in the survey pertained to American’ perception of the scientific “consensus”. The Pew Research Center found that just 27% of Americans believe that “almost all” climate scientists maintain the belief that changes in climate are mostly caused by humans.
Of course, the presupposition underpinning this opinion question is the claim that upwards of 97% climate scientists - translated into “almost all” for the Pew survey - believe that climate changes since the mid-20th century have been mostly (i.e., more than 50%) caused by humans. This oft-cited 97% figure was derived from a subjective abstract-counting exercise conducted by “SKeptical Science” blogger John Cook and colleagues (Cook et al., 2013, “Quantifying the Consensus..."). Selected abstracts from 11,944 scientific papers published between 1991 and 2011 were used for the sample size, and of those papers just 65 (0.5% of the 11,944) were classified by Cook and his fellow raters as endorsing the specified Category 1 position that “Explicitly states that humans are the primary cause of recent global warming” (Legates et al., 2013). This wouldn’t do, of course. So, to ultimately reach the 97% endorsement percentage the Cook team had set out to obtain in the first place, they intentionally combined the (65) Category 1 quantified “consensus” statement papers with the (934) Category 2 and (2,933) Category 3 endorsement papers that only needed to state (2) or just imply (3) that humans are a cause of climate changes. These Category 2 and 3 papers did not quantify the contribution or indicate humans are a primary (>50%) cause of climate change, but they were nonetheless combined with Category 1 papers anyway.
Of course, nearly all scientists would agree that a human contribution greater than 0% exists, or that humans can be a cause - however modest - of some degree of climate change. So by combining the very high endorsement rates from Categories 2 and 3 (that even most skeptics acknowledge, as they agree humans contribute to climate change to some degree) with the negligibly small endorsement rates for Category 1 (just 65 papers), and by excluding many hundreds of papers from consideration that were published by scientists questioning the theory, Cook et al. (2013) were ultimately able to get away with proclaiming that 97% of scientists believe that climate changes since 1950 have mostly been caused by humans.
But as the evidence from the Pew survey indicates, despite their best efforts, John Cook and cohorts have not been able to convince the general public that subjective abstract-counting exercises are a sound or scientific means to gauge “consensus.” As mentioned, only 27% of Americans believe that “almost all” (i.e., 97%) climate scientists maintain the belief that humans are the primary cause of changes in the climate system. Not only that, just 28% Americans agree that climate scientists even understand ("very well") what factors cause climate changes.
Enlarged
And Americans may be right. According to analysis found in the peer-reviewed scientific literature (Prokopy et al., 2015, Lefsrud and Meyer, 2012, Stenhouse et al., 2016), surveys of professional climatologists, engineers, geologists, and agronomists indicate that the percentage of these scientists who believe that changes in the climate system are primarily caused by humans falls abysmally short of the claimed 97%. In fact, these studies reveal that only 53% of climatologists and meteorologists, 36% of professional engineers and geoscientists, and 19% of agronomists believe that changes in the climate system are mostly human-caused.
53% Of Climatologists Believe, 19% Of Agronomists Believe
In a survey of Midwest-based climatologists and agronomists (here called “extension educators” who have “at least a Masters degree” in agronomic sciences), just 53% of climatologists and 19.2% of agronomists believe that changes in the climate system are primarily caused by humans.
Prokopy et al., 2015
“In 2012, a total of 22 state and extension climatologists were selected through a purposive sample to represent main outlets of publicly available and location-specific climate information in the region. About 53% attributed climate change primarily to human activities.”
“Extension educators are a unique set of agricultural advisors who serve to connect and translate research from universities to farmers in order to decrease risk to the farm enterprise and increase productive capacity and resilience. Typically, Extension educators have at least a Masters degree and are trained in agronomic sciences, which may not include climate sciences. [O]ver 19% attribut[e] climate change primarily to human activities.”

Enlarged
36% Of Engineers, Geoscientists Believe
Among professional engineers and geoscientists trained in the physical sciences, only 36% are believers in the “consensus” position that humans are the “main or central” cause of changes in the climate system.
Lefsrud and Meyer, 2012 ”The largest group of APEGA respondents (36%) ,,, express the strong belief that climate change is happening, that it is not a normal cycle of nature, and humans are the main or central cause.”
53% Of Professional Meteorologists Believe
Stenhouse et al., 2016
Conflict about Climate Change at the American Meteorological Society: Meteorologists’ Views on a Scientific and Organizational Controversy
“A web-based survey was sent to all professional (i.e. non-student) members of the AMS in December 2011. Members who said the global warming of the last 150 years was mostly caused by human activity (53% of full sample). Members who are convinced of largely human-caused climate change expressed that debate over global warming sends an unclear message to the public. Conversely, members who are unconvinced of human-caused climate change often felt that their peers were closed-minded, and were suppressing unpopular views.”
Ninety-Seven Percent Bunk
To summarize, the American public is about as likely to believe that climate changes are mostly caused by humans as are meteorologists and climatologists (48% vs. 53%, respectively). And Americans in general are much more likely to believe that humans are the primary cause of climate changes as professionals trained in the physical sciences: 48% of U.S. citizens are believers, whereas ~20-35% of professionals with physical science degrees (engineers, Earth scientists, agronomists) are believers.
To put it non-delicately, the claim that “almost all” scientists (i.e., 97%) believe that most changes in the climate system are caused by humans is… bunk.
And most Americans already knew that.
Mar 02, 2022
Increasing Cold Extremes Worldwide: Is Global Cooling on the way?
Madhav Khandekar, Ray Garnett
Note: Update from UAH on February global lower tropospheric temperatures:
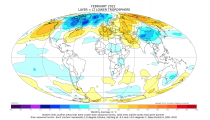
Enlarged
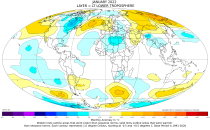
And January 2022:
Enlarged
February Temperatures (preliminary)
Global composite temp.:+0.00F equal to seasonal average
Northern Hemisphere:+0.02F above seasonal average
Southern Hemisphere:-0.04 F below seasonal average
Tropics: -0.43F below seasonal average
------------
In an earlier commentary, Madhav Khandekar pointed out that the year 2018 was one of the coldest and snowiest winters in Canada, especially in western Canada. For example, Calgary witnessed one of the largest snowfalls in recorded history, and Edmonton witnessed 127 consecutive days with below freezing temperatures. In Atlantic Canada, several snowstorms were recorded with snow falls amounting to 10 to 25 cms. Khandekar also pointed out extreme cold weather in Europe during late February 2018 with Moscow reporting 45 cm of snow and temperatures of at least -17C, and France shivering at below freezing temperatures between February 26 and 28.
Fast forward to last Christmas, when bitterly cold weather with wind-chill values of -50C and lower over much of western Canada. Since the new year 2022, we are in the throes of another dose of extreme cold weather from Vancouver to St. John’s, and even to the southeast USA to Greece and Turkey, to Japan, and northeast China.
Over North America, brutal and dangerous snowstorms made two visits in the first week of week of February producing dangerous winter conditions from Nova Scotia, Illinois, and Texas with power outages for over half a million residences. Surface transportation was disrupted in many US Midwest States, and over 6000 flights were cancelled on February 4th.
Even the tropical regions of northern India were not spared from brutally cold weather, where over 200 people died, most of the dead were elderly living in poorly built houses with no insulation or any heating system, unlike we have here in Canada.
What is annoying is that environmentalists and climate scientists (pundits?) keep talking about GW (Global Warming_ and the possibility of extreme heat, floods, and droughts. There is almost no mention of increases in cold extremes either in the climate science community or in the major news media. Climate activists keep talking about Climate Catastrophe or Climate Emergency with more extreme warm weather in future due to human-added CO₂. Many global leaders and multi-national Corporations have become members of the “net-zero by 2050” campaign, urging nations to limit C0₂ emissions to keep the earth’s mean temperature from rising beyond 1.5C. A warmer climate could precipitate a Climate Crisis In their minds.
What is the climate reality?
Based on the latest satellite data (Figure 1) the global mean temperature variation for January 2022 is a mere +0.03C above the 40-year average. A close analysis suggests that the earth’s climate may be cooling not warming. Observational evidence over many areas of the world definitely points to a cooling climate.
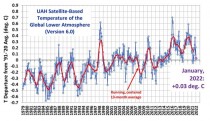
Figure 1. Running Average and January 2022 Average Temperatures
(Courtesy of Roy Spencer)
Has the climate stopped warming? There are many more issues with the hype about GW that needs to be assessed carefully. Unfortunately, the Canadian media and climate science community continues to push Global Warming that totally disregards the reality of the present trends
Figure 2 shows one M km2 (2%) increase in Northern Hemispheric (N.H.) snow cover from 1980 to 2021. Five of the 15 years since 2007 have been above the 42-year average. There is no evidence of the disappearing snow cover and milder winters that the IPPC predicted.
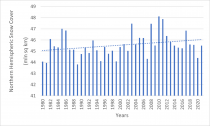
Figure 2. Winter N.H. snow cover extent 1980-2021
Source: Rutgers University Snow Lab
It is worth noting that the spike in N.H. snow cover in 2010 and 2011 coincided with the deepest solar minimum since 1913. The four years from 2007 to 2010 there were fewer than 15 sunspots a month.
On February 7th 2022, the Electroverse website describes how France is bracing for blackouts where old coal fire generating facilities are being fired up to cope the dropping temperatures. The website also reports that this has been Japan’s snowiest winter, and that scores of people have died in New Delhi. India’s cold wave has brought its first snowfall since 1958.
Finally, the important issue of a Climate Catastrophe thinking continues to gather steam with the “net-zero by 2050” theme. The obvious question for world leaders and the climate science community is: Is there a Climate Catastrophe?
There are many other important issues in the climate change science to be addressed but unfortunately they are not on the world’s agenda..
We close with photographs of extreme cold events from around the world courtesy of Electroverse (see www.electroverse.net).
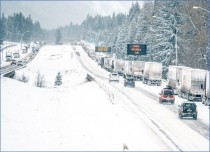
Jan. 6, 2022 Record-breaking snowstorms snarl transport across U.S. shutter the federal government and bring Washington D.C to a standstill with close to 12 inches of snow.

Jan. 21, 2022 Nashville, Tennessee, U.S. experiencing snowiest January since 1985.
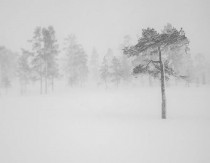
Jan. 24, 2022 Heavy snow in Athens, Greece
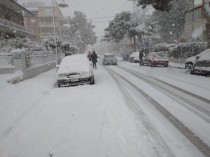
Jan. 24, 2022 Heavy snow in Athens, Greece
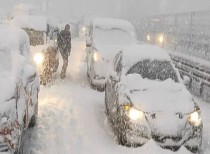
Jan. 25, 2022 Istanbul, Turkey

Jan. 18, 2022 Erbil, Iraq, reports -15C
References
IPCC 2007: Climate Change 2007: The Physical science basis: Contribution to the Working Group 1 to the fourth assessment report of the IPCC: Edited by S Solomon et al, Cambridge University Press,
Khandekar, M.L. and Garnett E.R. 2020 Global Warming (GW) & Extreme Weather (EW) Link: Are Cold Weather Extremes on the Rise? Earth & Environmental Science & Reviews ISSN: 2639-7455.
About authors
Madhav Khandekar holds a Ph D in Meteorology from the Florida State University USA (1968) and an M. Sc. in Statistics from Pune University India (1957). Khandekar has been working in weather and climate science for over 60 years and has published over 150 papers, reports, book reviews, and scientific commentaries. His current interest is global weather anomalies and extremes. He retired as a Research Scientist at Environment Canada in 1997 and lives in Toronto.
Ray Garnett has worked in Agro-Climatology for 45 years as an independent consultant and research analyst at the Canadian Wheat Board’s Weather and Planning Departments. Along with Dr. M.L. Khanderkar he co-founded the ad hoc Long-Range Weather and Crop Forecasting Working Group that organized meetings across Canada. In 2016 he was awarded the Andrew Thompson prize in Applied Meteorology given out by the Canadian Meteorological and Oceanography Society.
-----------
ICECAP NOTE:
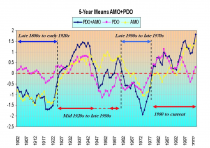
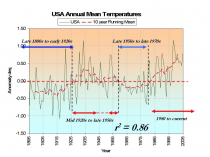
We are at a point where the long term cycles of temperatures and the real drivers, solar and ocean factors should kick us into a cold multi-decadal mode. The Russian Academy believes the sun is likely to enter a deep minimum like the Dalton or even Maunder Minimum.
Enlarged
Enlarged
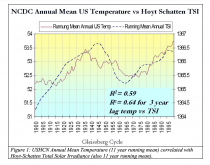
Enlarged
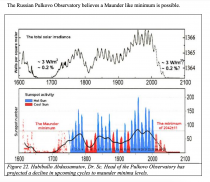
Enlarged
We had a preview in the harsh winters of 2013/14 and 2014/15. Weatherbell provided EIA of forecasts that Heating Degree Days would be 11% above normal (which verified) while the government forecasted normal. See the summary here. 2014/15 was the coldest and snowiest since 1717!
Feb 17, 2022
NOAA Ocean Service: 2022 The Next 30 Years of Sea Level Rise - junk science
Joseph D’Aleo, CCM
"Sea level along the U.S. coastline is projected to rise, on average, 10-12 inches (0.25 - 0.30 meters) in the next 30 years (2020 - 2050), which will be as much as the rise measured over the last 100 years (1920 - 2020). Sea level rise will vary regionally along U.S. coasts because of changes in both land and ocean height.”
Fact Check:
The claim that global warming is resulting in rising sea levels is demonstrably false. It really hinges on this statement: “Tide gauges and satellites agree with the model projections.” The models project a rapid acceleration of sea level rise over the next 30 to 70 years.” However, while the models may project acceleration, the tide gauges clearly do not.
All data from tide gauges in areas where land is not rising or sinking show instead a steady linear and unchanging sea level rate of rise near 4 inches/century, with variations due to gravitational factors.
It is true that where the land is sinking as it is in the Tidewater area of Virginia and the Mississippi Delta region, sea levels will appear to rise faster but no changes in CO2 emissions would change that. The implication that measured, validated, and verified Tide Gauge data support this conclusion remains simply false.
All such references rely on “semi-empirical” information, which merges, concatenates, combines, and joins, actual tide gauge data with various models of the reference author’s choosing. Nowhere on this planet can a tide gauge be found, that shows even half of the claimed 3.3 mm/yr sea level rise rate in “Tectonically Inert” coastal zones. These are areas that lie between regions of geological uplift and subsidence. They are essentially neutral with respect to vertical land motion, and tide gauges located therein show between 1 mm/yr (3.9 inches/century) and 1.5 mm/yr (6 inches/century rise). The late, great Swedish Oceanographer, Nils-Axel Morner, has commented on this extensively, and his latest papers confirm this ‘inconvenient truth’.
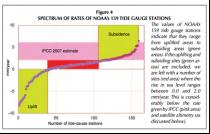
(Enlarged)
Holgate (2007) actually showed a slowing began in the late 20th century.
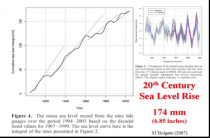
Source:
(Enlarged)
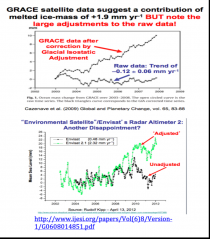
Furthermore, alarmist claims that “Satellites agree with the model projection” are false. Satellite technology was introduced to provide more objective measurement of the sea level rise because properly adjusted tide gauge data was not fitting Alarmists’ claims.
(Enlarged)
However, the new satellite and radar altimeter data lacked the resolution to accurately measure sea levels down to the mm level. Moreover, the raw data from this technology also conflicted with Alarmists’ claims. As a result, adjustments to this data were also made - most notably a Glacial Isostatic Adjustment (GIA). GIA assumes that basically all land is rebounding from long ago glaciations and oceanic basins are deepening. The assumption is that this rebounding is masking the true sea level rise. Alarmists continue to proclaim that their models project a rapid acceleration of sea level rise over the next 30 to 70 years, when those same models have failed to even come close to accurately predicting the past 25 years.
Natural Factors
Sea level rises are influenced by factors like El Nino and La Nina. El Nino’s produce warming and ocean expansion, increasing sea levels rises. La Nina’s produce cooling and ocean contraction and slower rises.
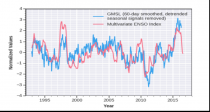
Source: UCO GMSL and the MEI (Enlarged)
Hansen had predicted in the late 1980s, flooding of the West Side Highway and water lapping on the steps of GISS in New York City within 20 years (by 2010). Sea levels have increased a little over an inch over that period. ABC predicted in that Manhattan would look like this by 2014. Again no appreciable change has occurred.

(Enlarged)
Global warming is not resulting in rising sea levels.
For much more detail see. Also see here how scientists were caught adjusting sea level data.
Feb 13, 2022
Evaluation of the Homogenization Adjustments Applied to European Temperature Records in GHCN
By Peter O’Neill etal
In this important paper, involving 17 co-authors from 13 European countries, we looked at the various “temperature homogenization adjustments” that have been applied to the European temperature records in the widely used “Global Historical Climatology Network” (GHCN) dataset over the last 10 years.
The GHCN dataset is the main data source for thermometer records used by several of the groups calculating “global warming” - including NOAA, NASA Goddard Institute and the Japan Meteorological Agency.
Because these thermometer records typically are several decades to centuries long, they often are contaminated by “non-climatic biases” whenever the weather station undergoes a major change, such as being moved to a new location or a change in the type of instruments used.
In an attempt to try to correct for these non-climatic biases, NOAA, the group in charge of the GHCN dataset had been running a computer program to try and statistically identify “non-climatic jumps” in the records by comparing each station record to 40 of its nearest neighbors. This process is called “temperature homogenization”, and until now, most groups had been assuming the process was working correctly.
However, for this study, we analyzed 10 years of different “homogenization adjustments” applied by NOAA to more than 800 European temperature records. We found that the adjustments NOAA was applying to each station record changed dramatically every time they re-ran their homogenization computer program! And they have been re-running this program almost every day since 2011.
We found that only 16% of the adjustments NOAA had been applying to the thermometer records were consistent from run to run.
Moreover, by compiling the “station history metadata” associated with each of the stations we analyzed from the various national meteorological services and other scientific studies, we were able to compare the adjustments applied by NOAA to the documented station changes that were known to have occurred. We found that less than 20% of the adjustments NOAA had been applying corresponded to any event noted by the station observers - such as a change in instrumentation, station move, etc.
The findings of our study suggest that many of the “homogenization adjustments” that have been applied to the main thermometer records used for studying climate change over the last 10 years may have been spurious.
We conclude our study by making various recommendations for how these problems might be resolved with more careful scrutiny of the data.
See Tony Heller’s killer video here on how the US state data is corrupted with these ‘adjustments’.
See this paper I authored “A Critical Look at Surface Temperature Records” for Evidence Based Climate Science in 2011 here. See a major compilation of earlier studies SURFACE TEMPERATURE RECORDS: POLICY-DRIVEN DECEPTION? here
See are more recent history of the issues here.
Feb 09, 2022
All downhill from here
Climate Nexus Special
09 Feb 2022 | News Roundup
The New York Times “Climate Fwd.” runs a touching feature on West Windsor, VT, rocked by the closure of the local ski resort “because of erratic snowfall and mismanagement”, whose plucky inhabitants responded by creating “a model for how a small ski area and its community can thrive in the era of climate change” that replaced bad private enterprise with good government and downhill skiing with mountain biking, endurance running and… um...downhill skiing. Actually there’s no less snow there than there ever was. Still, beware, because “A 2019 study showed that in northeastern states besides Vermont, at least half of ski areas will close by the mid 2050s if high greenhouse gas emissions continue.” Yeah, we heard that one before. So a modern news story doesn’t describe something that happened, or even check if it did. Instead it describes something that the writer thinks should have happened and some scientists say eventually will except it’s a scientifically impossible scenario. And they wonder why their circulation is falling faster than snow in a Vermont winter.
In case anyone at the paper still remembers when fact-checking meant checking facts not censoring opinions, the study in question wasn’t even published in 2019. It was published in 2017. And it’s remarkably coy about details like whether RCP 8.5 is lurking amid the moguls. Instead it basically looked at a bunch of papers saying climate change would wipe out skiing and found a strong tendency for them to say skiing would be wiped out by climate change. And also that papers saying climate change will wipe out skiing are a growth industry, in case you’re on the scrounge for a grant in order to study vital questions like whether skiers are unhappy if there’s not enough snow.
Incredibly, they are. The researchers “found that in general demand related to ski lifts (e.g. revenues, skier days, number of transported people) is more sensitive to a lack of snow than overnight stays.” And no sum is too high for that kind of insight.
Speaking of insights, an accompanying Times piece describes one enthusiastic skier at the tiptop of Mt. Ascutney pointing to other snow-covered peaks with ski resorts and lamenting that more than a decade ago they would get lots of snow and it would “just bypass Ascutney”. We couldn’t win”. Put that together with the fact that bad management closed the resort and you get...nothing. Not a decrease in snow. Not a hit of climate change. Not even an estimate of when it hit. Was it already causing less snow on this one mountain though not others nearby in 2010? In 2005? Never? (Mind you a new paper says fisheries will be rocked as “On average, the ToE of the deoxygenation signal in the mesopelagic zone is projected to emerge in 2021” if… we use RCP 8.5. So it’s here now, unless it’s not. But far too late to finish off that resort which, in any case, is open under new management.)
Still, let’s not nitpick. How bad is the snowfall crisis in the area now? Well, it turns out the actual town of West Windsor now gets a mere 76 inches of snow a year, doubtless baffling local children whenever it does fall in a thick white blanket every year. And a resort inexplicably located on nearby bare-dirty-rock Mt. Ascutney, home of the failed resort, boasts that “Alpine skiers have been thrilled about Ascutney’s varied terrain and friendly appeal for over 60 years” before inviting you to experience “8 trails/ 26 acres of skiable terrain for all ability levels/ a 450-foot vertical drop/ the longest run of 3100 feet.” Who are these fools to think you can ski there?
By the way, for non-skiers, “alpine” isn’t a creative climate-era alternative to “downhill” skiing. It is downhill skiing. And Wikipedia reports that one of Ascutney’s hated rivals, the cleverly named “Killington Mountain Resort & Ski Area” (see, it’s a mountain resort and ski area on Mt. Killington), “is the largest ski area in the eastern U.S., and has the largest vertical drop in New England at 3,050 feet (930 meters). Since 2013-14 ski season, it has been called the ‘Beast of the East.’” Not, be it noted, “the place there used to be snow”.
To be fair, in what the Times calls “the era of climate change”, Killington has a mere 155 runs, of which just 39% are black diamond, as part of a complex with only 21 lifts barely capable of taking 37,000 people up the mountain per hour to enjoy its feeble 10 feet of natural snow per year plus the artificial stuff. And if it sounds bleak, nearly Okerno Mountain Resort, rated “the Top US Family Snow Resort” by Parents Magazine back in 2010, is even smaller than Killington despite getting 16.6 feet of snow a year.
If you’re now thinking whoa, that’s too much snow, it’s also close to Mount Sunapee with just eight feet of the stuff. But it somehow maintains 66 runs, while a fourth local competitor, Stratton Mountain, has 99 runs and 15 feet of snow. As for poor doomed barren Ascutney it gets… what’s this? Over sixteen feet of snow a year? (And if you care about the global ski industry crisis, with CO2 skyrocketing, January temperatures in Germany have been falling since 1988, presumably melting the nearby Alps and ruining Austria’s ski industry too.)
If you’re not a skier you might be wondering what all the fuss is about. So are we, but for a different reason. We’re worried about the incredible failure of media outlets to check basic facts when peddling climate change. There isn’t the slightest indication that skiing in Vermont is in any kind of danger, nor that Mount Ascutney is not getting snow. Ottawa gets under six feet a year and it sometimes feels like a lot. They get nearly three times that.
The Times hallucinated the whole thing. Typically. This sort of story gets published nowadays without any sort of editorial oversight or scruples. The end of winter as we know it, unnoticed. And to think people sometimes doubt the urgency of the climate crisis.
See this fact check on the claims of disappearing snow here.
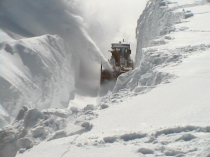
Given the NYT’s litany of failed claims over the years, you might expect this is more likely the situation in the not to distant future plowing access roads to the slopes.
|


