Jun 27, 2009
US Government’s Climate Con-job
Paul Driessen
Suppose a company doctored data, misrepresented study findings, replaced observations with computer simulations, and hired PR flacks to promote its new “wonder drug.” News stories, congressional hearings and subpoenas would be in overdrive. Fines and jail sentences would follow. And rightly so. But the standards change when “climate catastrophe” is involved.
The White House has made global warming the centerpiece of its revenue-raising and energy policies. A House of Representatives 1,201-page bill would tax, regulate and penalize all US hydrocarbon energy use, to “save the planet from climate disaster.” The Senate promises an August vote. But average global temperatures peaked in 1998 and since have fallen slightly, even as carbon dioxide levels continue to climb. Thousands of scientists say CO2 has little effect on planetary temperatures, and there is no climate crisis. Few developed countries are ready to commit economic suicide, by agreeing to reduce their CO2 emissions by a fraction of what the House bill demands for the United States.
Americans are beginning to realize the legislation would cost millions of jobs and trillions of dollars for a hypothetical 0.1 degree F reduction in global temperatures. Most put global warming dead last in a Pew Research list of 20 concerns. The government’s answer to these inconvenient truths is simple.
Issue another report by government scientists carefully selected to exclude any who don’t subscribe to climate Armageddon. Ignore contrary data and analyses. Crank out more bogus computer-generated worst-case scenarios. Hire an activist media firm that specializes in environmental scare campaigns. And spend tens of millions hyping every imaginable climate disaster:
Rising sea levels, floods in lower Manhattan, California beaches permanently submerged. Ferocious hurricanes, floods and droughts. Food shortages, epidemic diseases, a quadrupling of heat-wave deaths in Chicago. Aged sewer systems convulsing from massive storm runoff. Wildflowers disappearing from Rocky Mountain slopes and polar bears from the Arctic. Leisure time gone, as people struggle to survive. “Global Climate Change Impacts in the United States” is the “most up-to-date, authoritative, comprehensive” analysis ever done on how human-caused warming affects the United States, deadpans Obama “science” advisor John Holdren.
Actually, it’s the most flagrant attempted con-job and propaganda campaign in US history. If it helps Congress enact cap-and-tax legislation, it will give activists, courts and bureaucrats control over virtually every aspect of our lives. It will enable them to confiscate hard-earned dollars, convert them to payoffs for activists and companies that get on the climate-crisis bandwagon, consign uncooperative companies and scientists to the ash heap of history, and conceal the exorbitant costs of restrictive energy policies - on families, industries, jobs and transportation - until long after the bill becomes law.
The bogus “report” conflates and confuses human activities and emissions with the powerful natural forces that have caused major and minor climate changes and weather anomalies since the dawn of time - from the Carboniferous Period to the Age of Dinosaurs, from the Big Ice Ages and interglacial periods to the Little Ice Age, Roman and Medieval Warm Periods, Dust Bowl and countless others. It relies on conjecture, conformist thinking and conspicuous elimination of contrary, skeptical, realist scientists and studies that do not support climate cataclysm conjecture and ideology.
The authors “largely ignored” critical comments to earlier drafts and made the final version “even more alarmist” than infamous UN “summaries” of global warming “crises,” says Joseph D’Aleo, first director of meteorology at the Weather Channel and former chairman of the American Meteorological Society’s Weather Analysis and Forecasting Committee. The report is simply “wrong on many of its claims” and marks “an embarrassing episode for the authors and NOAA,” D’Aleo concludes.
University of Colorado environmental studies professor Roger Pielke, Jr. says the report “misrepresents” his own work, makes claims that are not supported by citations provided, relies heavily on analyses that were never peer reviewed, ignores peer-reviewed studies that reach opposite conclusions from those proclaimed by the report, and cites analyses that do not support conclusions rendered.
“I didn’t notice a single recognized hurricane expert in the list of authors,” says NOAA Hurricane Research Division scientist Stanley Goldenberg. The report relies heavily on surface temperature data from monitoring stations located next to parking lots and air conditioning exhaust ports - falsely skewing temperature records upward - other experts noted. It is lead-heavy on assumptions, assertions and speculation - hydrogen-light on evidence.
But the most egregious miscarriage of science in this agit-prop exercise is its near-total dependence on worst-case scenarios conjured up by computer models. That’s where it gets its litany of “Day After Tomorrow” Hollywood disasters. These climate models have never been validated by actual observations, notes Professor Robert Carter of the Marine Geophysical Laboratory at Australia’s James Cook University. Indeed, Australia’s own climate modeling agency (CSIRO) stresses that climate change scenarios are based on computer models that “involve simplifications of [real world] processes that are not fully understood. Accordingly, no responsibility will be accepted...for the accuracy of forecasts inferred” from its reports.
“Modeling results are interesting - but worthless for setting public policy,” says Carter. But that is exactly how they’re being used. Sure, it’s conceivable that Antarctica could melt, and cause sea levels to rise 20 feet, as Al Gore and the government con-artists suggest. Greenhouse gases would merely have to increase average annual Antarctic temperatures from their current -50 degrees F to +40 degrees for a century or two, to melt 200,000 cubic miles of South Pole icecaps. A mere 90-degree swing.
That may be as likely as having the planet overrun by raptors and T-rexes cloned from DNA in fossilized mosquitoes. But it’s conceivable. And in the realm of global warming politics, that’s all that matters. As MIT atmospheric physicist Richard Lindzen observes, “global warming has developed so much momentum that it has a life of its own, quite removed from science.”
As one climate activist group put it: “The task...is not to persuade by rational argument.” It is “to work in a more shrewd and contemporary way, using subtle techniques of engagement. The ‘facts’ need to be treated as being so taken-for-granted that they need not be spoken.” The strategy is to treat “climate-friendly activity as a brand that can be sold. This is the route to mass behavior change.”
This is the kind of science, transparency, honesty and accountability we have come to expect over “human-caused climate chaos.” If the congressional, administration and activist conspirators behind this massive deceit were in the private sector - peddling bogus drugs, rather than bogus science - they’d quickly become convicts. Instead of jail time, though, they’ll probably get bonus checks. See PDF.
Paul Driessen is senior policy advisor for the Committee For A Constructive Tomorrow and Congress of Racial Equality, and author of Eco-Imperialism: Green Power, Black Death.
Jun 21, 2009
The Wong-Fielding Meeting On Global Warming
By David Evans on Joanne Nova’s blog
Finally, the question we’ve all wanted to ask of the people in power: Where’s the evidence?
Senator Fielding holds a crucial vote on the proposed Emissions Trading Legislation. Fielding and four independent scientists faced the Minister for the Climate Change and Water, Penny Wong, The Chief Scientist, Penny Sackett, and Professor Will Steffan, director of the Climate Change Institute at the Australian National University. Read what happened from someone who was there. Joanne Nova
Guest Post by Dr David Evans
17 June 2009
Australia’s Parliament House
Introduction
Australian Senator Steve Fielding met with the Australian Minister of Climate Change, Senator Penny Wong, on 15 June 2009. Senator Fielding was seeking evidence that human emissions of carbon dioxide were the main cause of global warming; Senator Wong presumably wanted Senator Fielding’s vote for the upcoming Emission Trading Scheme legislation.

I was at that meeting, one of four independent scientists invited by Senator Fielding. Many people have asked me what happened, so I am replying to everyone at once like this. These are my impressions of the meeting, with special attention to the way the meeting was conducted and to the arguments used by the alarmists. This account is not primarily a science discussion; nor is it a record of who said what. I took some notes during the meeting, but otherwise it is written from memory over the next three days.
Meetings between official alarmist and skeptical scientists are so rare they are newsworthy in their own right (see, there was no debate). The aim here is to inform the public about what sort of things happen at an event like this. While it is not the aim of this account to persuade anyone of a point of view on the causes of global warming, obviously it will be told from my skeptical viewpoint. Read more of this fascinating encounter here.
Senator Fielding commendably attended the Heartland ICCC III in Washington, D.C. in early June to hear more of the alternative viewpoint on climate change not covered by the Australian media in order to make an informed decision. We hope that visit and this reported meeting will help inform enough Australian legislators to reject Rudd’s and Wong’s disastrous ETS. We wish more of our U.S. congressman and senators would perform due diligence on this important devisive issue to avoid making a wrong ill-informed decision on the Waxman-Markey cap-anfd-tax bill that would affect every American for decades to come in a very negative way.
Update: See this Real Politics story on Fielding “Could Australia Blow Apart the Great Global Warming Scare?”here.
Jun 20, 2009
NOAA a Major Outlier Again
By Joseph D’Aleo
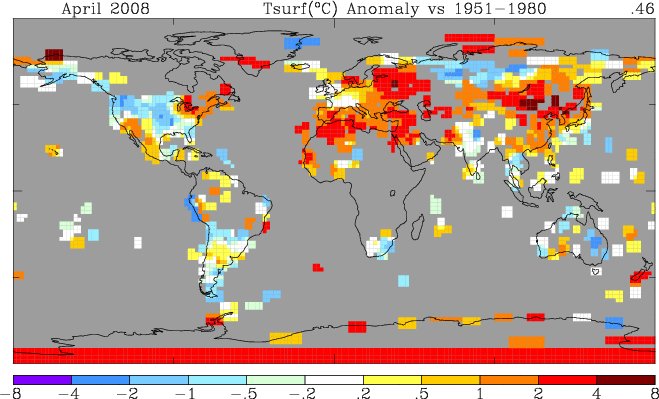
NOAA proclaimed May 2009 to be the 4th warmest for the globe in 130 years of record keeping. Meanwhile NASA UAH MSU satellite assessment showed it was the 15th coldest May in the 31 years of its record. This divergence is not new and has been growing. Just a year ago, NOAA proclaimed June 2008 to be the 8th warmest for the globe in 129 years of record keeping. Meanwhile NASA satellites showed it was the 9th coldest June in the 30 years of its record.
We have noted in the last year that NOAA has often become the warmest of the 5 major data sets in their monthly global anomalies. They were second place until they introduced a new ocean data set to be discussed later.
NOAA and the other ground based data centers would have more credibility if one of the changes resulting in a reduction of the warming trend and not an exaggeration which has been the case each time.
THE MANY ISSUES WITH THE STATION BASED DATA CENTERS
NOAA and the other station base data centers suffer from major station dropout (nearly 3/4ths of the stations) many of them rural, there has been a tenfold increase in missing months in remaining stations, no adjustment for urbanization even as the population grew from 1.5 billion to 6.7 billion since 1900 and documented bad station siting in the United States and almost certainly elsewhere. Also 70% of the earth is ocean and the methods for measurement there over the years have changed from ship buckets to ship intake to satellite surface sensing. Each measures a different level and produces different results. Transitioning was gradual making estimation more challenging.
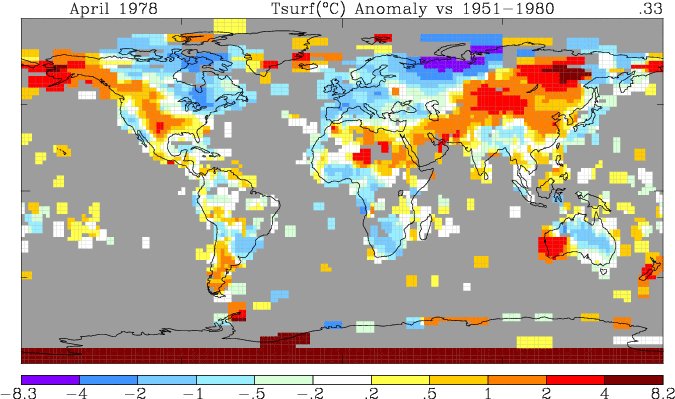
STATION DROPOUT
NOAA’s allowing over 2/3rds of the world’s stations to dropout in 1990. You can see the coverage difference between the stations on this GISS analysis of the NOAA gathered stations from 1978 versus that in 2008.
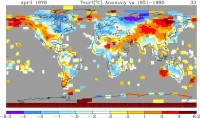
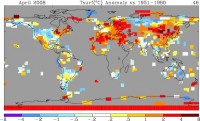
Notice the big gaps in Canada (where May was very cold), South America, Africa, western Asia, Greenland and Australia. Since many of these areas are more rural, this dropout led to more urban bias and thus warming.
URBAN HEAT ISLAND
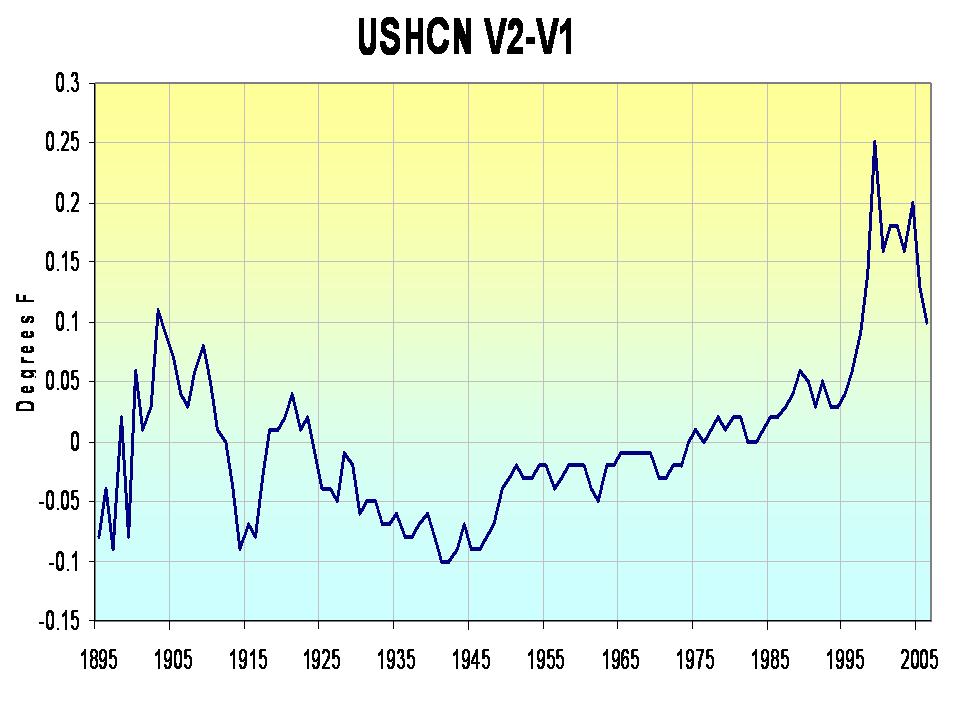
In the United States, NOAA has removed the US Urban Heat Island (UHI) adjustment and performs no UHI adjustment on global data. This is despite the facts that NCDC’s own Director Tom Karl in Kark et al (1988 J Climate) in Urbanization: its detection and effect in the United States climate record, showed the importance of urban adjustment and the Hadley Centre’s Phil Jones (2008) in Jones et al. ”Urbanization effects in large-scale temperature records, with an emphasis on China”, showed UHI’s contamination of data in China. There are many other peer review papers supporting the need for UHI adjustment even for smaller towns to determine climate trends. The removal of the UHI adjustment resulted in an enhanced warming trend as you would expect but an oddball cooling in the 1930s.
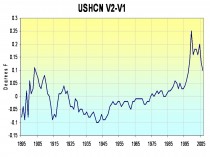
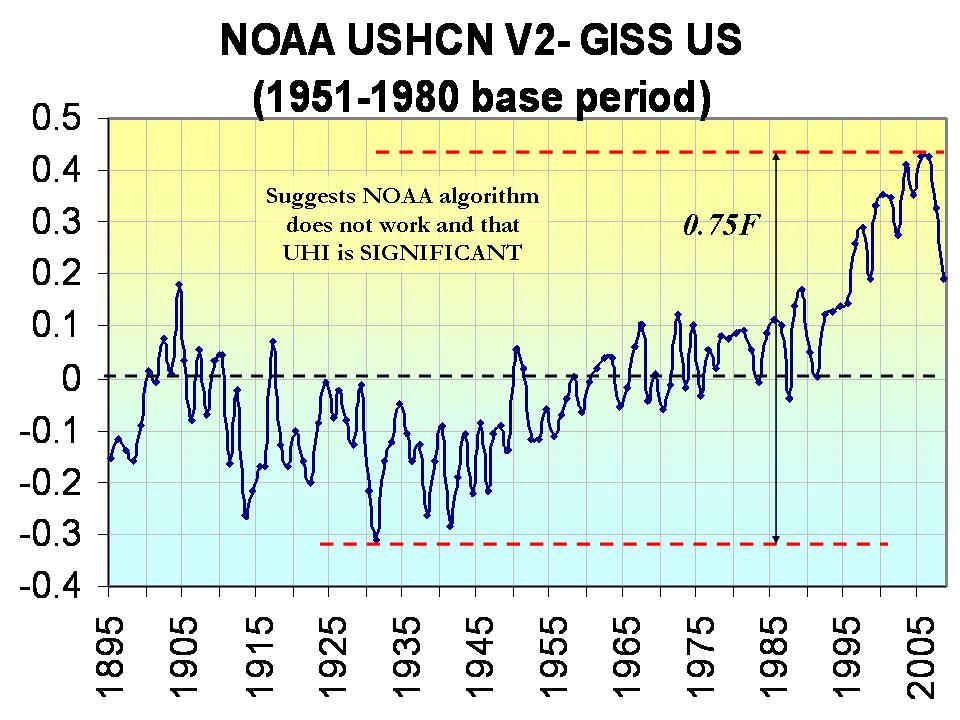
Removal of the UHI for the US resulted in a warming relative to GISS (which still does a UHI adjustment that seems to work for the US) with UHI in the United States of an amazing 0.75F since 1940.

See larger image here.
A new paper coming soon to Nature claims to have forund the CO2 temperature relationship (they say a linear one) but all they found was the urban heat island effect.
BAD SITING
Anthony Watts has clearly shown increasingly bad siting can lead to warm bias here. “During the past few years a team of more than 650 volunteers visually inspected and photographically documented more than 860 of these temperature stations. We were shocked by what we found. We found stations located next to the exhaust fans of air conditioning units, surrounded by asphalt parking lots and roads, on blistering-hot rooftops, and near sidewalks and buildings that absorb and radiate heat. We found 68 stations located at wastewater treatment plants, where the process of waste digestion causes temperatures to be higher than in surrounding areas.
In fact, we found that 89 percent of the stations - nearly 9 of every 10- fail to meet the National Weather Service’s own siting requirements that stations must be 30 meters (about 100 feet) or more away from an artificial heating or radiating/reflecting heat source. In other words, 9 of every 10 stations are likely reporting higher or rising temperatures because they are badly sited. The conclusion is inescapable: The U.S. temperature record is unreliable. The errors in the record exceed by a wide margin the purported rise in temperature of 0.7C (about 1.2F) during the twentieth century. My report is available in full as this PDF document here. See also in this new post how even when siting or equipment errors are discovered, the bad data and in this case a string of false records are let stand.
TURNING TO THE OCEANS
Now having gotten all the warmth possible out of the land temperatures, they turn to the oceans, so promising as they cover 70% of the earth’s surface. It appears they have found more warming there be reanalysis of past data.
Thanks to Bob Tisdale, we have a better idea why that is the case with his story “Recent Differences Between GISS and NCDC SST Anomaly Data And A Look At The Multiple NCDC SST Datasets” covered in the recent WUWT post Something hinky this way comes.
NOAA has a revised warmer sea surface data set now implemented that is significantly warmer than the prior and the current version used by GISS.
See large image here.
SATELLITE A BETTER WAY
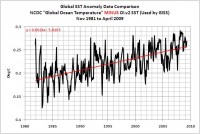
Satellite are widely believed to be the most reliable source of reliable trend information if you can calibrate the differences as one bird gets phased out and a new one goes online. UAH and RSS have gotten very good at this in a very cooperative way in recent years.
When you compare the satellite trends of both UAH and RSS with NOAA, you see an increasing warm bias in the NOAA data which explains why months with major cold in the news get ranked so high by NOAA and not by the satellite sources. The difference is approaching 0.5C (almost 1F).
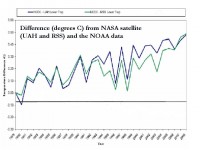
See larger image here.
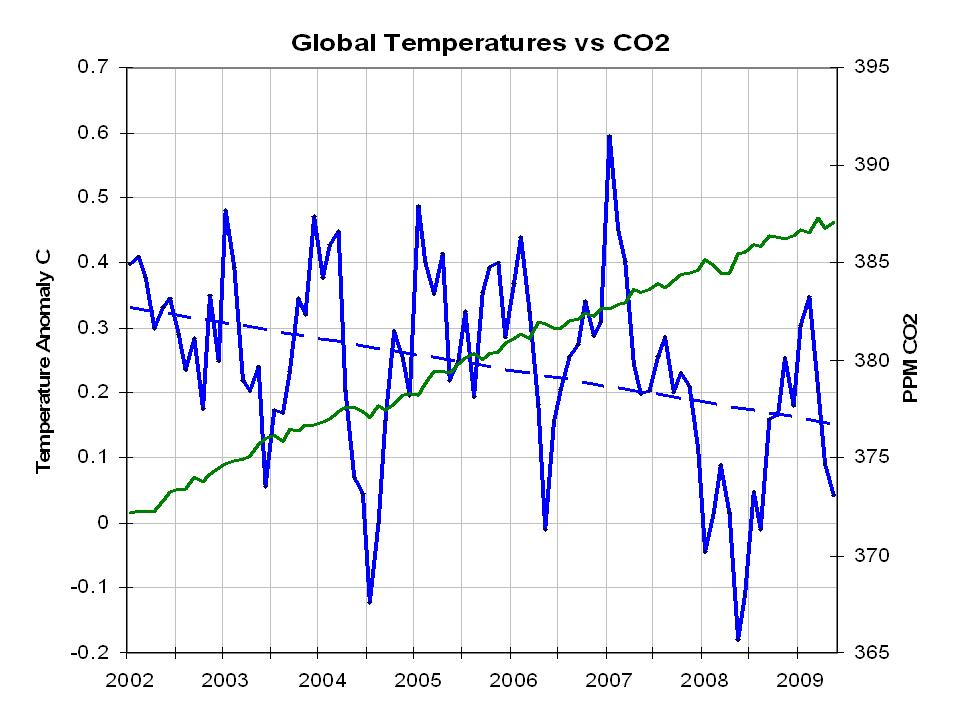
The satellite data is regarded even by NOAA administration to be the most reliable but they don’t use it in releases as it is only available for 30 years. It has shown a cooling since 2002.
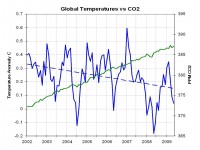
See larger image here.
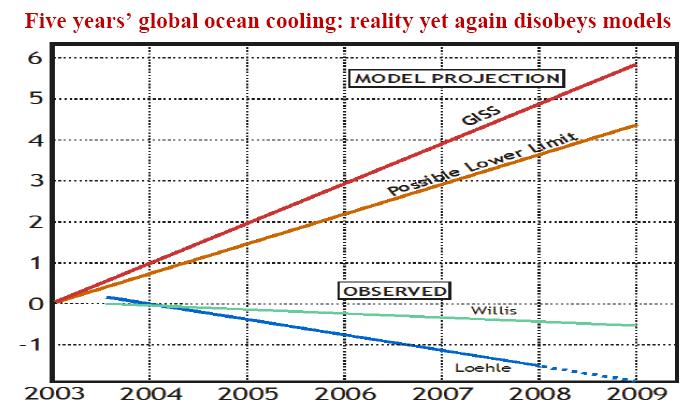
OCEAN HEAT CONTENT
Roger Pielke Sr. advocates using ocean heat content as a measure of climate change. Bill DiPucchio showed how using Pielke’s Willis (2008) data and Loehle’s data since 2003 deployment of the Argo buoys, ocean heat content has fallen as well.
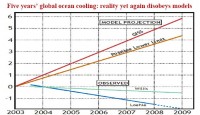
See larger image here.
These all suggest we ignore NOAA’s nonsense global monthly press releases and follow instead the satellite and ocean temperature trends. See PDF. A much more detailed assessment is being submitted to the EPA and will be posted next week after the EPA deadline.
Jun 20, 2009
“World cooling has set in and it will stay colder for at least 100 years predicts scientist”
By Piers Corbyn, WeatherAction
"World cooling is here to stay and the new round of climate alarmism just announced by UK Government ministers and the Met Office of more extreme weather and warming in coming decades driven by mankind has no merit and is defied by the facts and front-line science”, said Piers as his forecast from three weeks ahead was confirmed for the formation of the first East Pacific typhoon of the season off Mexico.
“Ministers have been saying a lot about accountability recently so now let’s apply that to climate change policy and scrutinize what they are up to in the light of the facts and the application of sound science. “Will Minister Benn - and his opposite numbers in other parties - place before Parliament the evidence on which they base their climate change policies? Or are we to be led into more climate alarm taxes and charges’ and a new war against nothing based on bogus compter models? “
“Climate alarmism is not based on sound science but on a political agenda which has become a new religion to justify any policy or scheme which politicians and self-serving green ideologues, deluded researchers, businesses, oil magnates and the nuclear industry want to adopt. All their long-range models have failed so far so why should anyone believe them? On the other hand our solar based long range weather and climate forecasts have proven power, so why don’t politicians listen?” “We need an independent public inquiry now into climate alarmism and conflicts of interest involving funding bodies which must be based on testable science; or” - he asked - “Will we have to wait for an enquiry when its too late where we in 5 years time will belatedly ask politicians:
- Why did so many children starve to death from food and fuel price rises caused by biofuels and costly energy projects?
- Why was the development of Africa held back in the name of green ideology?
- Why did they repeatedly fail to act on extreme weather event warnings which killed thousands but were ignored because the science used in those forecasts didn’t accord with the new green religion?
- Why did the UK Government continue to rely on failed forecasting systems which cost the UK economy 3billion pounds in the winter of 2008/9 when road salt ran out because the Met Office had forecasted a mild winter.
“Unless the climate circus is stopped we will see another round of hand-wringing in 5 years time against ‘irresponsible risk taking’ in the promotion of the green bubble of false value which has already burst in Spain in 2008” warned Piers. “The facts are:
1. Contrary to the projections of the UN and Governments the world has been cooling since 2002/3 while CO2 has been rising rapidly. (More here and here).
2. Global warming is over and it never was anything to do with mankind. There is no evidence that CO2 fluctuations in the last 200, 2,000 or 20,000 years have caused warming or climate change, in fact the evidence is the other way around. (See Challenge here )
3. There is no evidence of more extreme weather events or increases in the rate of sea level rise or changes in glaciers corresponding to CO2 increases since the industrial revolution. (See Effects of CO2 Nicholson & Soon)
4. All changes in the Arctic and Antarctic follow natural and highly variable patterns which are not new or special and have been recorded for over a thousand years and have been very well known to the British navy for a long time and available in the Met Office library The Antarctic has been cooling for decades and the Arctic has started to cool in the last year or two. Break-up of ice is a natural process - like the falling down of old trees - and has been happening for millions of years before news media noticed it.
5. All the UN & Govt forecasts of ongoing warming this century have failed and the UN has still refused to produce evidence of their claims despite reasonable requests by an international group of science experts. (See Letter to UN Sec General 14 July 2008 )
6. Extreme weather and climate change events can be predicted months or years ahead using solar activity whereas standard meteorology and CO2 dogma cannot do this. (PowerPoint & Audio of Piers Corbyn’s & Other Presentations at International Climate Change Conference New York 8-10 March 2009 - section V track 1 see slide 28 for world Temperature forecast to 2030. Scroll for speeches by Prof Bob Carter, Prof Richard Lindzen, Lord Monckton and others). A Layman’s Explanation of Why Global Warming Predictions by Climate Models are Wrong by Dr Roy Spencer here.
7. The Met office long range forecasts for summer 2007, summer 2008 and winter 2008/09 were the opposite of what occurred while solar-based (Solar Weather Technique) forecasts correctly foresaw the floods, more floods and heavy snow in each of those seasons. (Met Office barbecue summer forecast seriously misleading.)

“Met office season ahead forecasts have consistently failed as they are failing again this summer. For how long will the public have to wait before this circus is called to account. Will the BBC do its duty and expose failed science or will they continue their cover-up?” asked Piers. See World cooling has set-in warns astrophysicist - BBC & ‘Global Warming apologists’ challenged to end ‘cover-up’
Jun 17, 2009
First Ever Ice Wine in Brazil
Team Vinicola Perico, Vinicola Vineyards in Santa Catarina, Brazil
Our friend at the METSUL, Alexandre Aguiar reports that for the first time ever in Brazil icewine has been produced in this unusually cold June in Southern Brazil. This is a release on the Vinicolo Vineyard website. The following is a rough web based translation from Portuguese to English. The original Portuguese story is here.
With pleasure we inform that the Perico team yesterday registered in its vineyards, located in the farm Boy God, District of the Perico in Joaquin - Santa Catarina, a phenomenon of the nature, the most waited of this time: the ice wine. The temperatures had fallen well below-freezing and the thermometers had marked - 7.5 C. A dream if became reality: the harvest of the grapes congealed for this so wonderful act of the nature.

With this, the Vinicola Perico, will be first ever vineyard in Brazil to produce ICEWINE (Wine of the Ice), a natural licoroso wine, with raised amount of residual sugar of the proper grape.

The process of production of the Icewine, consists of mature grapes and extreme cold at-6 C, in this condition, the water that if find in the interior of the berries of the grapes congeal and the ice separates the rich juice in sugar. When the grapes are just right, they’re carefully picked by hand. Grapes in this condition have a very low yield - often an entire vine only makes a single bottle. That’s why ice wine can be so expensive and is often sold in half-bottles only ... but it’s worth it! After this long harvest process, the grapes go through weeks of fermentation, followed by a few months of barrel aging in new barrels of French oak, Allier forest. The wine ends up a golden color, or a deep, rich amber. It has a very sweet (of course) taste. After vinificado we will have the pleasure to present this great BRAZILIAN only ICEWINE, which happens in Austria, Germany, north of Italy and Canada. See photos of our vineyard to the dawn, before and after the sun rose. More photos on home page..
We have posted stories on how this cold spring has caused agricultural problems in many locations worldwide. See this post . See David Archibald’s post originally on Icecap in which he forecasted these agricultural issues reposted with comments on Watts Up With That here. See Bloomberg post on spring wheat concerns in Canada due to a very cold May. See more on Spring in Canada here and here.
Despite all these anecdotal evidences of global cooling, NOAA announced May 2009 was the 4th warmest in 130 years of record keeping (and manipulation) with an anomaly of +0.53C just a week after the University of Alabama using the NASA MSU satellite data assessed the global anomaly at just +0.043C, making it the 15th coldest in 31 years. Anthony and I will surely have more to say on this unlikely divergence soon.
|

