Apr 17, 2009
SPPI Monthly CO2 Report
Edited by Christopher Monckton on SPPI
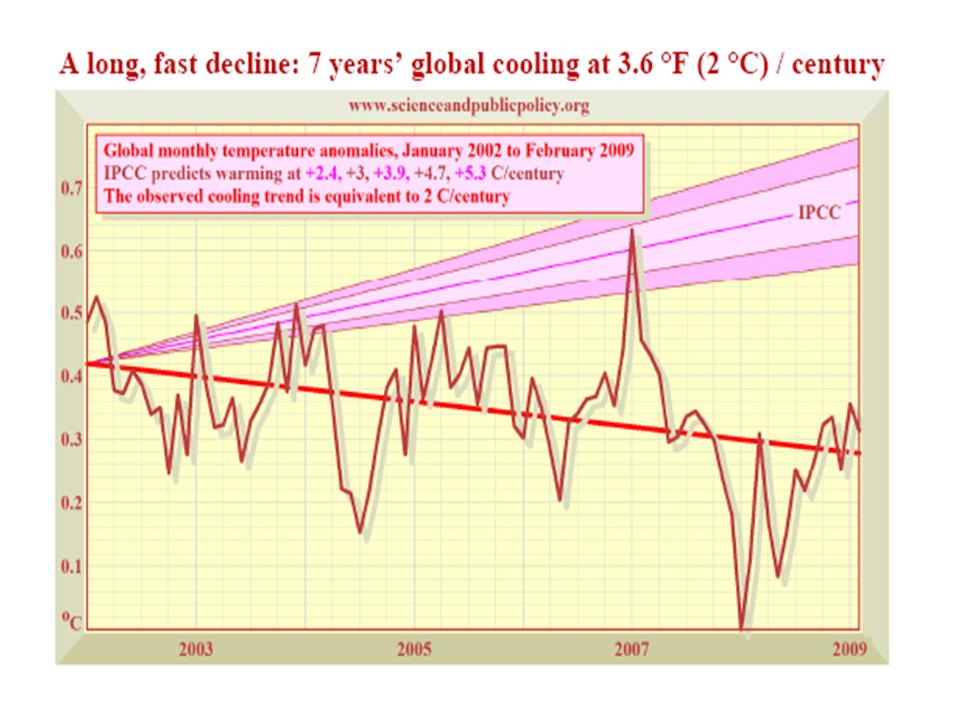
SPPI’s authoritative Monthly CO2 Report for March 2009 demonstrates that all global-temperature datasets show rapid global cooling for seven full years, at a rate equivalent to 2 C (3.6 F) per century.
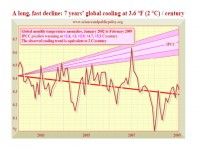
See larger image here.
Other main points:
Since Al Gore’s climate movie An Inconvenient Truth was launched in January 2005, global cooling has occurred at the equivalent of 10 F (5.5 C) per century. If this rapid cooling were to continue, the Earth would be in an Ice Age by 2100.
The UN’s climate panel, the IPCC, had projected temperature increases at 4.5 to 9.5 F (2.4 to 5.3 C) per century, with a central estimate of 7 F (3.9 C) per century. None of the IPCC’s computer models had predicted a prolonged cooling.
The IPCC’s estimates of growth in atmospheric CO2 concentration are excessive. They assume CO2 concentration will rise exponentially from today’s 385 parts per million to reach 730 to 1020 ppm, central estimate 836 ppm, by 2100.
However, for seven years, CO2 concentration has been rising in a straight line towards just 575 ppmv by 2100. This alone halves the IPCC’s temperature projections. Since 1980 temperature has risen at only 2.5 F (1.5 C) per century.
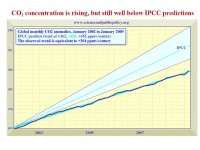
See larger image here.
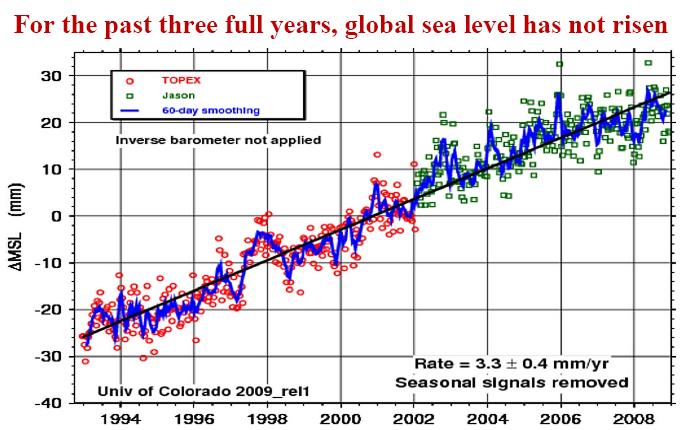
Sea level rose just 8 inches in the 20th century and has been rising at just 1 ft/century since 1993. Though James Hansen of NASA says sea level will rise 246 feet, sea level has scarcely risen since the beginning of 2006.
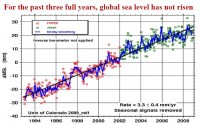
See larger image here.
Sea ice extent in the Arctic has now recovered to the 30-year average. In the Antarctic, sea ice extent reached a record high late in 2007, and has remained plentiful since. Global sea ice extent shows little trend for 30 years.
The Accumulated Cyclone Energy Index is a 24-month running sum of monthly energy levels in all hurricanes, typhoons and tropical cyclones. The Index shows that at present there is less severe tropical-storm activity than at any time in 30 years.
Satellite measurements prove that official predictions overestimate CO2’s effect on temperature 15-fold.
Proof that CO2’s warming effect is exaggerated
LAST MONTH Science Focus calculated that the UN had approximately (and perhaps inadvertently) doubled the value of each of four parameters, and had then multiplied them together, causing a 15-fold exaggeration of the anthropogenic increase in global surface temperature. This month, with grateful acknowledgement to Professor Richard Lindzen, we provide real-world confirmation of our theoretically-calculated conclusion.
In addition to any long-term trends, temperature fluctuates on shorter time scales - years to decades. These natural variations are associated with the internal dynamics of the ocean-atmosphere system. Examples include the El Nino Southern Oscillation and the Pacific Decadal Oscillation. These fluctuations must excite the feedback mechanisms that we have just described. When they lead to warmer temperatures, heat radiation escaping from Earth to space should increase, but positive feedbacks should inhibit the outgoing radiation by virtue of the enhanced ‘blanketing’, which, if the UN’s models are right, should typically reduce the escaping heat radiation by a factor of about 3 compared with what one would see in the absence of feedbacks.
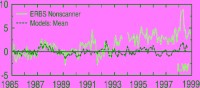
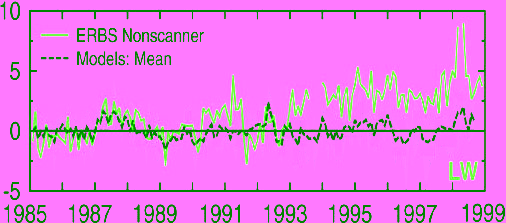
See larger image here. Observed (green) long-wave flux anomalies for the tropics against the mean of five climate model simulations (black) using observed sea surface temperature, and the total range of model-predicted anomalies (gray band). Source: Wielicki, B.A., T. Wong et al. 2002. Evidence for large decadal variability in the tropical mean radiative energy budget. Science 295: 841-844.
Satellite measurement: We can measure the escaping heat radiation using satellites. If the satellite data were to confirm the predictions made by the computer models on which the UN relies, we should have solid evidence that the modeled feedbacks were correct. However, it turns out that the satellite data do not confirm the UN’s predictions.
Read full detailed reports and see more images and also some new paper reviews here.
Apr 17, 2009
‘We ♥ CO2’: Reform Party of BC
Garrett Zehr, the Tyee
The debate over the carbon tax is proving that politics really does make for strange bedfellows. Joining the British Columbia New Democratic Party in vowing to axe the tax is the Reform Party of B.C., who have adopted the slogan, “We ♥ CO2.”
“We will repudiate the tax - it’s a scam,’ said Reform leader David Hawkins. The party would also set out to prove that the accepted carbon-driven model for explaining climate change is “scientific fraud.” Also lining up behind the NDP in railing against the carbon tax are the B.C. Conservatives, who have made the issue one of the six main planks of their platform.
Not only would they give the taxation of carbon the boot, the party also proposes getting rid of B.C.’s property transfer tax and lowering personal and corporate taxes.
Those supporting the carbon tax are also parties that often don’t see eye to eye. The tax, brought in by the B.C. Liberal Party, has received much support from the Green Party of B.C. “I do want to commend the B.C. Liberals for introducing the carbon tax and tax shifting,” said party leader Jane Sterk last fall. The Greens want a carbon tax in combination with a cap and trade climate policy and also propose higher taxes on polluting industries. See story here.
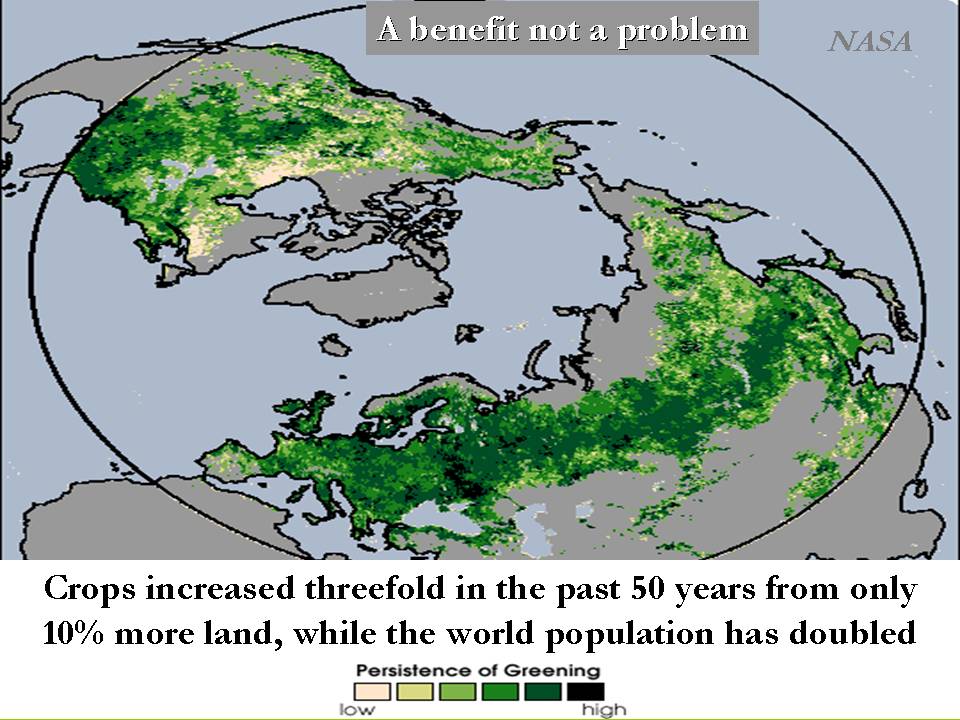
Good luck to the Reform Party. Bring sanity to Canadian politics and give ‘agita’ to B.C. IPCC alarmist modeler Andrew Weaver and the phonies at desmogblog. Kudos to Hans Schreuder who has a blog site I Love My CO2 that has been vindicating this harmless gas. CO2 is actually a highly beneficial gas that acts as a plant fertilizer which has helped according to NASA to increase crop yields in the Northern Hemisphere by 30% with just 10% more land over the last 50 years, feeding millions more of the world’s people.

See larger image here.
Apr 14, 2009
Peter Foster: An Inconvenient Film
By Peter Foster, The National Post
Gore is about to feature in a new movie, but he’s not going to like it very much. Titled Not Evil Just Wrong: The True Cost of Global Warming Hysteria, the film presents a devastating account of the shaky foundations and hefty price of Mr. Gore’s brand of self-interested and hypocritical alarmism. Created by the Irish film making duo of Phelim McAleer and Ann McElhinney -who made another excellent documentary about the “dark side of environmentalism” called Mine Your Own Business - Not Evil provides the perfect rebuttal to Mr. Gore’s An Inconvenient Truth.
Despite being chock-a-block with inaccuracies and misrepresentations, Mr. Gore’s movie has frightened schoolchildren all over the world, driven the public policy debate, and garnered both an Academy Award and a Nobel Peace Prize for its star. Not Evil - which is due to be released later this year - will appear at a crucial time. The world’s crisis-beset nations are due to meet in Copenhagen in November to concoct a new policy straitjacket to succeed the meddlesome but utterly failed Kyoto Accord. If global warming’s U.N.-based ringmasters have their way, this will lead to a slashing of industrial production in developed countries and to a huge extension of boondoggle redistributionist schemes to fund “green” technologies in developing countries.
Alternating credible skeptics with arresting imagery, the film makes clear that the science, far from being settled, has been comprehensively misrepresented by the likes of NASA’s James Hansen, who is to Al Gore and climatology what Trofim Lysenko was to Joseph Stalin and agronomy.
There is a wonderful scene of Mr. Hansen becoming almost discombobulated at the very mention of Stephen McIntyre, the maverick Canadian who, with the help of Guelph economist Ross McKitrick, took on the UN climate change establishment over the so-called “hockey stick” temperature graph, and won. Mr. Hansen claims that paying attention to such inconvenient truths amounts to just “clouding the issue”
The film dramatically outlines the dreadful damage already done by environmental hysteria, in particular the millions of unnecessary deaths caused by the campaign against DDT. That campaign started with Rachel Carson’s Silent Spring, which was at the root of the modern environmental movement in every sense. Despite the World Health Organization’s lifting of the DDT ban, Al Gore remains devoted to Ms. Carson’s memory. And methods. As Patrick Moore, one of the founders of Greenpeace but now a skeptic, points out, radical environmentalists “care more about fish eggs than they do about children.” Meanwhile kids are shown fretting about about imminent global inundation and the deaths of polar bears.
Just as Mine Your Own Business showed how opposition to mining in developing countries comes often not from the “grassroots” but from well-funded multinational NGOs with as little concern for local employment as they have for truth, so Not Evil Just Wrong further demonstrates environmentalists’ disregard for humanity, and in particular the poor.
Perhaps the most memorable scene in Mine Your Own Business was that of the WWF’s local representative in Madagascar, Mark Fenn, who was leading opposition to a development by Rio Tinto. The appalling Mr. Fenn, who owned a $35,000 catamaran and was building a local luxury home, claimed that poor people were happier, and that if the locals had more money they would “just spend it.” The film makers have come up with similar buffoons for their new movie, including a Bible-thumping environmentalist in Uganda who opposes using DDT and claims that the U.S. never experienced malaria and Hollywood actor Ed Begley, who suggests that Fijians are “happy with nothing.”
Not Evil Just Wrong which will be released later this year - is an important film that deserves the widest possible distribution, both in theatres and schools. The only quibble that I have with it is that its title might be too generous to those it exposes. To find out more about the movie and the fundraising campaign to help its distribution visit its website.
Apr 14, 2009
Gore’s Current Media Pulls IPO, Citing Poor Conditions
By John Letzing, MarketWatch
SAN FRANCISCO (MarketWatch) - Current Media Inc., the television and Internet firm co-founded by Al Gore with the intention of “democratizing media,” has shelved plans for an initial public offering of its stock. San Francisco-based Current said in a public filing on Friday that it has requested the withdrawal of an IPO registration statement initially filed in January of 2008.

“In light of current market conditions, the registrant has determined not to proceed at this time with the public offering,” the filing read. In its IPO registration filing, updated in May of last year, “participatory media company” Current said its revenue is derived from affiliate fees from the likes of Comcast Corp. (CMCSA) , while a much smaller portion comes from advertising fees from firms including General Electric Co.
According to the registration filing, Current had $17 million in revenue and a net loss of $5.7 million for the three months ended in March, 2008, and was available in roughly 56 million subscriber households. The company also said it intended to use proceeds of the IPO to help repay $43 million in debt and for general purposes.
Current launched Current TV in 2005, and also operates Current.com. The company is focused on younger viewers while relying heavily on so-called “user-generated” content contributed by non-staff reporters. “We believe there is a significant gap between what is being delivered by traditional sources of TV and what is demanded by young adults,” Current said in its IPO registration filing. Former Vice President Gore serves as Current’s chairman and board director, while other directors have included supermarket magnate Ronald Burkle and former MTV Networks President Mark Rosenthal.
See this story here. Current recently made headlines when two of its staff journalists were detained by North Korean guards while working near the Chinese border. North Korean media has reported that the reporters are expected to stand trial for “hostile acts.” See story on that here.
Apr 12, 2009
Global warming endangers U.S. corn production, study says. WRONG!
By Jim Tankersley
Global warming could rob the U.S. economy of $1.4 billion a year in lost corn production alone, a national environmental group estimated in a report released Thursday. The Environment America study, based on government and university data, projects that warming temperatures will reduce yields of the nation’s biggest crop by 3% in the Midwest and the South compared with projected yields without further global warming.Iowa would be hit hardest, losing $259 million a year in corn revenues, followed by Illinois at $243 million. California, which leads the country in agriculture but doesn’t grow much corn, would take an estimated $4.7-million hit.
The study doesn’t directly address other crops, but one of its main sources, a 2008 government report on the effects of warming on agriculture and natural resources, suggests that California’s signature fruit and vegetable harvests could suffer even more than corn if temperatures rise. “Corn likes it cool, but global warming is raising temperatures across the nation,” said report author Timothy Telleen-Lawton in a news release. “Hotter fields will mean lower yields for corn, and eventually, the rest of agriculture.”
Telleen-Lawton said the estimates of revenue loss were tied to expected increases in temperature and carbon dioxide levels that could be reached within the next few decades if steps were not taken quickly to cut the amount of greenhouse gases emitted into the atmosphere. The report is a direct challenge to other studies, often cited by critics of government efforts to curb greenhouse gas emissions, that project moderate warming would increase crop yields.
Higher carbon dioxide levels would help plants grow, Princeton University physicist William Happer, a critic of emissions limits, told a Senate committee this year. “Crop yields will continue to increase as CO2 levels go up,” he said in submitted testimony, “since we are far from the optimum levels for plant growth.” Icecap Note: this is supported by NASA satellite monitoring which shows a ”greening of middle latitudes”, an increase in yields of 30% and 10% more acreage in the last 50 years due in large part to higher CO2. More vigorous plants are also more drought resistant. This has enabled us to feed more of the world’s people.
The report by Environment America, an environmental advocacy group, contends that damaging effects from warming would far outweigh a carbon-fueled yield boost. “Not all the effects of global warming will be bad for agriculture; growing seasons will be longer, and increased carbon dioxide levels encourage plant growth,” the report says.
“But global warming will make some of the challenges that agriculture faces significantly worse, including increasing temperatures, more damaging storms, ozone pollution, and spreading pests, weeds, and diseases.” The report doesn’t attempt to quantify losses from storms, floods, insects and ozone pollution related to global warming. It calculates damages based on warming temperatures, which could rise above corn’s optimum growing range of 64 to 72 degrees Fahrenheit during the growing season. It also says farmers can help fight global warming—and the government can encourage their efforts—in part by turning some of their land into wind and solar energy farms.
But the report stays silent on the fate of perhaps the most touted—and politically controversial—intersection of U.S. agriculture and global warming: corn ethanol, which proponents call a path away from fossil fuels but which critics say could cause as much global warming harm as good. See story here.
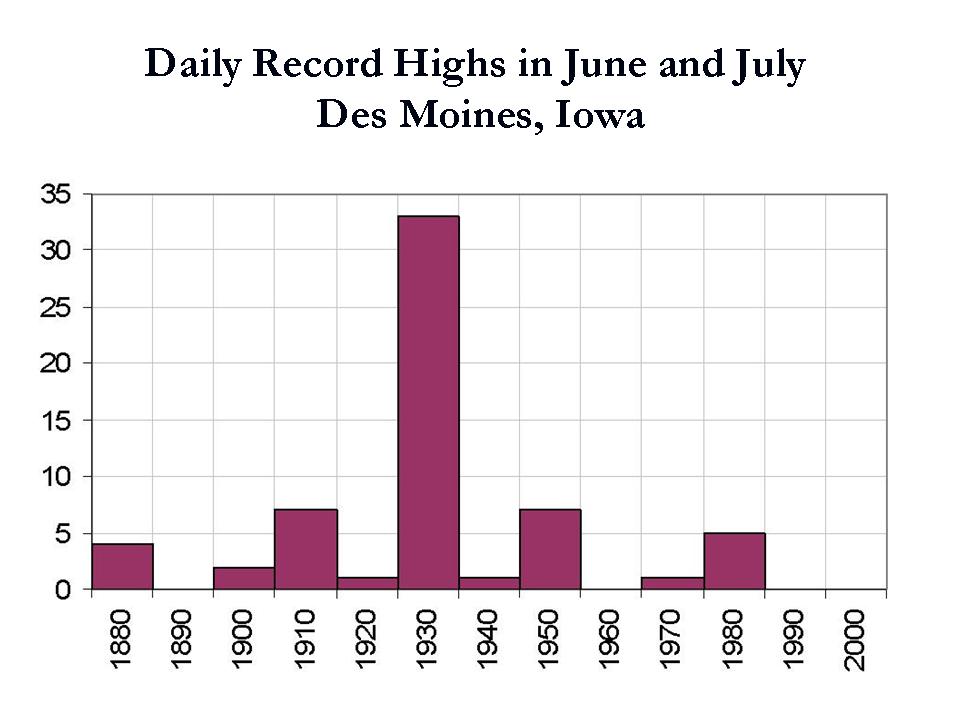
Icecap Note: Iowa was mentioned as being vulnerable to more heat. Actual Des Moines, Iowa data says otherwise. Out of the 61 record highs for June and July, 33 occurred in the 1930s, 5 in 1988 and NONE since.
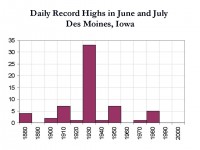
See larger image here.
Most of the warming globally has been in urban areas, in winter and at night. None of these apply to farmland. Also temperatures globally have been on the decline in the last 7 years. Agricultural areas tend to have elevated nighttime readings and lower daytime temperatures due to enhanced moisture due to evapotranspiration (see Christy study here).
|

