May 09, 2009
Have Changes In Ocean Heat Falsified The Global Warming Hypothesis?
By William DiPuccio on Climate Science
The Global Warming Hypothesis
Albert Einstein once said, “No amount of experimentation can ever prove me right; a single experiment can prove me wrong.” Einstein’s words express a foundational principle of science intoned by the logician, Karl Popper: Falsifiability. In order to verify a hypothesis there must be a test by which it can be proved false. A thousand observations may appear to verify a hypothesis, but one critical failure could result in its demise. The history of science is littered with such examples.
A hypothesis that cannot be falsified by empirical observations, is not science. The current hypothesis on anthropogenic global warming (AGW), presented by the U.N.’s Intergovernmental Panel on Climate Change (IPCC), is no exception to this principle. Indeed, it is the job of scientists to expose the weaknesses of this hypothesis as it undergoes peer review. This paper will examine one key criterion for falsification: ocean heat.
Ocean heat plays a crucial role in the AGW hypothesis, which maintains that climate change is dominated by human-added, well-mixed green house gasses (GHG). IR radiation that is absorbed and re-emitted by these gases, particularly CO2, is said to be amplified by positive feedback from clouds and water vapor. This process results in a gradual accumulation of heat throughout the climate system, which includes the atmosphere, cryosphere, biosphere, lithosphere, and, most importantly, the hydrosphere. The increase in retained heat is projected to result in rising atmospheric temperatures of 2-6C by the year 2100.
In 2005 James Hansen, Josh Willis, and Gavin Schmidt of NASA coauthored a significant article (in collaboration with twelve other scientists), on the “Earth’s Energy Imbalance: Confirmation and Implications” (Science, 3 June 2005, 1431-35). This paper affirmed the critical role of ocean heat as a robust metric for AGW. “Confirmation of the planetary energy imbalance,” they maintained, “can be obtained by measuring the heat content of the ocean, which must be the principal reservoir for excess energy” (1432).
In 2007 Roger Pielke, Sr. suggested that ocean heat should be used not just to monitor the energy imbalance in the climate system, but as a “litmus test” for falsifying the IPCC’s AGW hypothesis (Pielke, “A Litmus Test”, climatesci.org, April 4, 2007).
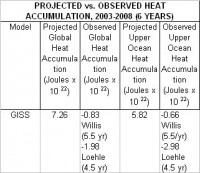
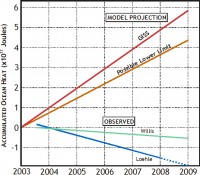
A comparison of these projections to observed data is shown below. Despite expectations of warming, temperature measurements of the upper 700m of the ocean from the ARGO array show no increase from 2003 through 2008. Willis calculates a net loss of -0.12 (plus or minus 0.35) x 1022Joules per year (Pielke, Physics Today,55) from mid-2003 to the end of 2008 (Dr. Pielke received permission from Josh Willis to extend the ARGO data to the end of 2008).
According to a recent analysis of ARGO data by Craig Loehle, senior scientist at the Illinois-based National Council for Air and Stream Improvement, the loss is -0.35 (plus or minus 0.2) x 1022Joules per year from mid-2003 to the end of 2007 (see Loehle, 2009: “Cooling of the global ocean since 2003.” Energy & Environment, Vol. 20, No. 1&2, 101-104(4)). Loehle used a more complex method than Willis to calculate this trend, enabling him to reduce the margin of error.
My calculations for observed global heat, shown below, are based on observed upper ocean heat. Since upper ocean heat is calculated to be 80% of the global total, observed global heat equals approximately 125% (1/0.8) of the observed upper ocean heat.
PROJECTED vs. OBSERVED HEAT ACCUMULATION, 2003-2008 (6 YEARS)
Model
Projected Global Heat Accumulation
Heat Deficit. The graph below shows the increasing deficit of upper ocean heat from 2003 through 2008 based on GISS projections by Hansen, Willis, Schmidt, et. al. Actual heat accumulation is plotted from observed data (using ARGO) and shows the overall linear trend (after Willis and Loehle). Seasonal fluctuations and error bars are not shown.
Read full post here.
May 04, 2009
AARI Predicts Arctic Cooling/Ice Recovery To Continue
By Joseph D’Aleo (h/t to Dr. Gary Sharp)
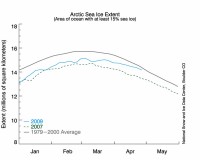
Arctic ice extent bottomed out in 2007, and has recovered the last two years as shown by this graph from the University of Illinois Cryosphere.
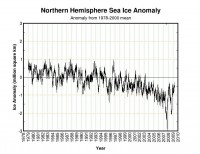
It has returned to very near the 1979-2000 year average (NSIDC). Had NSIDC used the entire period of record as their base period (1979-2008), we would be at or above the average.

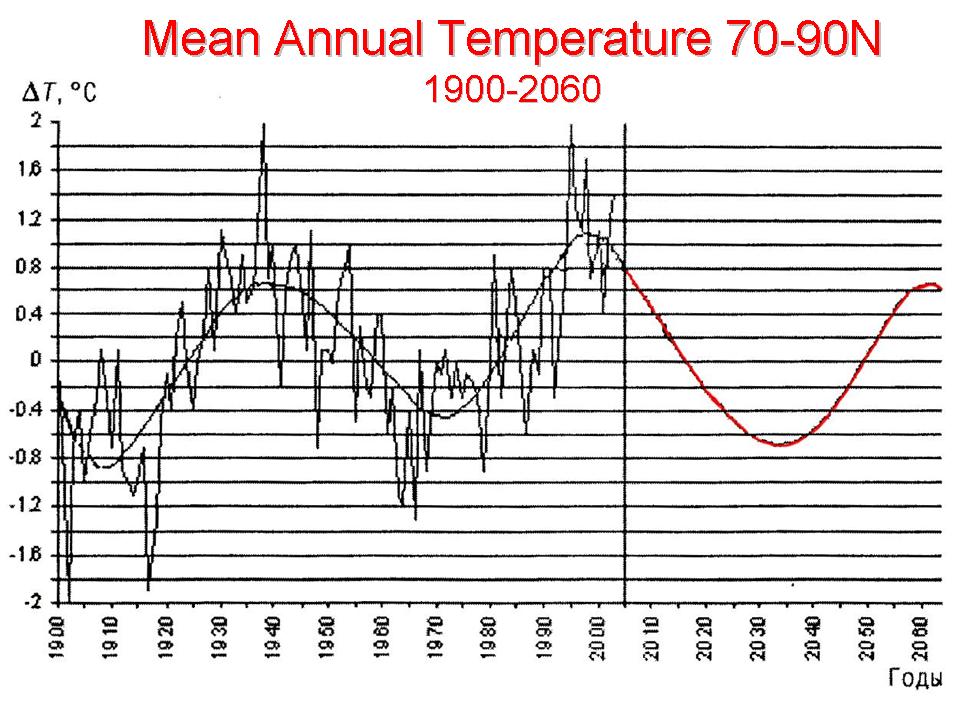
The most competent polar scientific organization, Arctic and Antarctic Research Institute (AARI) in St. Petersburg, Russia published recently 3 books summarizing scientific results of climate changes in the Arctic region for the last century. One of it dedicated to Arctic climate. Based on the results obtained they forecast coming temperature and sea ice cover area changes in the Polar seas for the next 10-20 years.
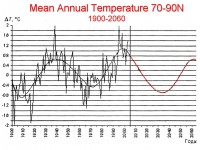
Anomaly of mean annual air surface temperature 1900-2006 in the zone of 70-90 N and its predicted trend (I.E.Frolov et al. Scientific research in Arctic. Vol. 2. Climatic changes in the ice cover of the Eurasian shelf seas. -SPb.: “Nauka”, 2007,158 p).
See large image here.
The authors showed that Arctic climate change is natural in origin and several orders of magnitude greater than the level of anthropogenic impact on the climate. Estimates of possible changes of Arctic air temperature and ice cover propagation area for the 21st century are given on a basis of the revealed stable cyclic oscillations of 10, 20 and 50 to 60 years. Read more here.
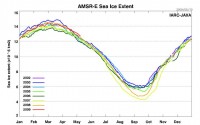
The IJIS JAXA AMSR-E data shows we are running higher than any of the years since 2002.
Apr 29, 2009
Inconvenient Eisdicken - “surprising results” from the Arctic
By Anthony Watts, Watts Up With That
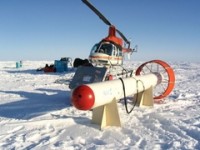
This is a news story from Germany outlining another Arctic ice measurement expedition. This one was conducted by flying the scientists across the north polar ice cap using the WWII era workhorse Douglas DC-3 airplane equipped with skis, and towing an airborne sounder twenty meters above the ice surface. It makes the Catlin Arctic Ice Survey look rather pointless, but then we knew that. BTW “Eisdicken” translates to “ice thickness”. - Anthony
Surprising Results: At the North Pole ice sheet is thicker than expected.
The research aircraft Polar 5 ended today in Canada’s recent Arctic expedition. During the flight, researchers have measured the current Eisstärke measured at the North Pole, and in areas that have never before been overflown. Result: The sea-ice in the surveyed areas is apparently thicker than the researchers had suspected.
Normally, ice is newly formed after two years, over two meters thick. “Here were Eisdicken up to four meters,” said a spokesman of Bremerhaven’s Alfred Wegener Institute for Polar and Marine Research. For scientists, this result is still in contradiction to the warming of the seawater.
Besides the Eisdicken was also the composition of the air are investigated. With the help of a laser, the researchers reviewed how polluted the atmosphere by emissions from industrialized countries. On the expedition, some 20 scientists from the U.S., Canada, Italy and Germany.

An ice thickness probe, the so-called EM-Bird, which is usually dragged below a helicopter, is now operated for the first time by a fixed-wing aircraft. The EM-Bird is towed under the hull of the aircraft by means of a winch for take-off and landing. For the surveys, the probe is towed on an 80 m long rope twenty metres above the ice surface. More extensive areas can now be investigated due to the longer range of the aircraft in comparison to a helicopter.
UPDATE: more on the EM-Bird probe (h/t to Ron de Haan)
Electromagnetic (EM) induction sounding for ice thickness measurements is a technique that can achieve long profiles of some kilometer length. The accuracy and robustness of the EM method has been evaluated by comparing coincident drill-hole and EM measurements. Read more (Poster, pdf, size: 156 kB). Sure beats hauling a sledge and a broken home-built ice radar around doesn’t it? Read more and see comments on this successful scientific expedition here and the other PR driven, BBC hyped but failed Catlin expedition that is likely reaching an end 542 km short of their goal with failed equipment and frostbite and in a blizzard here. Do expect a press release touting a successful Catlin mission carried by the BBC.
Here by the way is the latest NSIDC ice trace approaching the normal.
And finally note we continue to track ahead of all the years in the AMSR-E record (starting in 2002) in the IJIS-JAXA web site here.
Apr 28, 2009
The Pacific Ocean’s Influence on Climate Change: How Low Will the PDO Go?
By Jeremy Ross, PhD
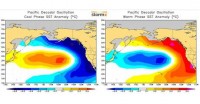
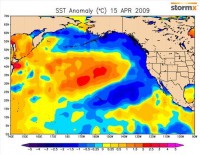
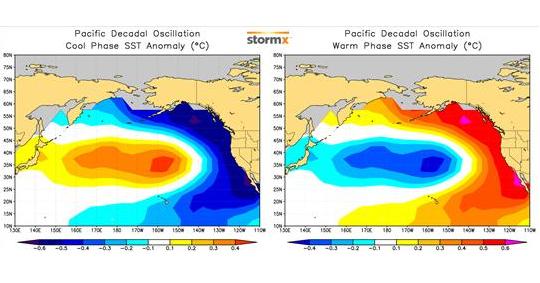
Long-term variations in ocean circulations produce pronounced patterns of sea surface temperature (SST) anomalies that directly impact weather and climate. The most influential long-term oceanic cycle is the Pacific Decadal Oscillation (PDO), a large-scale phenomenon in the North Pacific that produces inter-decadal oscillations of cool and warm SST anomalies, with each phase typically lasting 20 to 30 years. During the cool (negative) phase of the PDO, a large horseshoe-shaped area of cooler than average SST extends from the central equatorial tropics northeastward to the Mexican and U.S. coastlines, then northward along the Canadian and Alaskan coastlines. During the warm (positive) phase the pattern is reversed with warm SSTs replacing the cool SSTs. The Atlantic Ocean experiences a similar oscillation known as the Atlantic Multidecadal Oscillation (AMO) which has profound impacts on the number and intensity of Atlantic hurricanes as well as Arctic sea ice extent.
See larger image here.
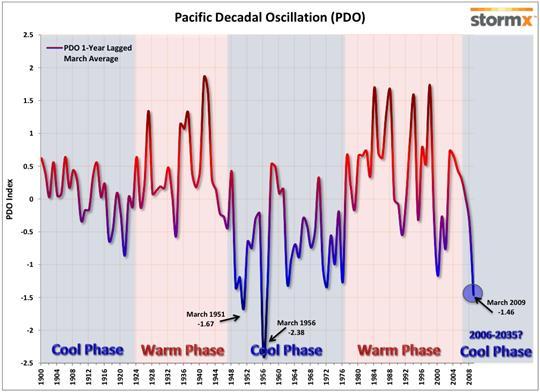
After a period of intense cooling in the 1950s, 1960s, and 1970s, the PDO returned to the positive phase during the late 1970s and remained generally positive through the late 1990s. Since 1999, a transition into the cool phase has been underway, and during 2008 the transition was completed as recent observations of the coastal waters have been among the coolest in the past 109 years.
See larger image here.
Long-term variations in ocean circulations produce pronounced patterns of sea surface temperature (SST) anomalies that directly impact weather and climate. The most influential long-term oceanic cycle is the Pacific Decadal Oscillation (PDO), a large-scale phenomenon in the North Pacific that produces inter-decadal oscillations of cool and warm SST anomalies, with each phase typically lasting 20 to 30 years. During the cool (negative) phase of the PDO, a large horseshoe-shaped area of cooler than average SST extends from the central equatorial tropics northeastward to the Mexican and U.S. coastlines, then northward along the Canadian and Alaskan coastlines. During the warm (positive) phase the pattern is reversed with warm SSTs replacing the cool SSTs. The Atlantic Ocean experiences a similar oscillation known as the Atlantic Multidecadal Oscillation (AMO) which has profound impacts on the number and intensity of Atlantic hurricanes as well as Arctic sea ice extent.
After a period of intense cooling in the 1950s, 1960s, and 1970s, the PDO returned to the positive phase during the late 1970s and remained generally positive through the late 1990s. Since 1999, a transition into the cool phase has been underway, and during 2008 the transition was completed as recent observations of the coastal waters have been among the coolest in the past 109 years.
The average PDO index from April 2008 to March 2009 was -1.46, the third lowest yearly averaged March value since 1900, trailing only March of 1956 and 1951. For the next two or three decades, North Pacific SST anomalies will favor the negative phase, and will likely produce exceptional climate patterns and weather events that have not been observed in more than three decades.

See larger image here.
The strongly negative PDO was influential in shaping North American climate during the past year. In 2008, Anchorage, Alaska, recorded only 2 days above 70 degrees F, the least number of days to exceed 70 since records began in 1917. The PDO strongly influenced the winter of 2008/2009 with dry conditions and warmth in the south central U.S. and snowy and colder than average temperatures in the Northern Plains. Although the PDO will continue to be the dominant climate driver for the remainder of 2009, its impacts will subside during the summer when the atmospheric flow weakens and climate is more strongly affected by local influences such as land conditions and proximity to water bodies.
Read more here.
Apr 27, 2009
Open Water at the North Pole 1958 and 1959
By Anthony Watts, Watts Up With That
What would NSIDC and our media make of a photo like this if released by the NAVY today? Would we see headlines like “NORTH POLE NOW OPEN WATER”? Or maybe “Global warming melts North Pole”? Perhaps we would. sensationalism is all the rage these days. If it melts it makes headlines.

From John Daly:
For example, one crew member aboard the USS Skate which surfaced at the North Pole in 1959 and numerous other locations during Arctic cruises in 1958 and 1959 said:
“the Skate found open water both in the summer and following winter. We surfaced near the North Pole in the winter through thin ice less than 2 feet thick. The ice moves from Alaska to Iceland and the wind and tides causes open water as the ice breaks up. The Ice at the polar ice cap is an average of 6-8 feet thick, but with the wind and tides the ice will crack and open into large polynyas (areas of open water), these areas will refreeze over with thin ice. We had sonar equipment that would find these open or thin areas to come up through, thus limiting any damage to the submarine. The ice would also close in and cover these areas crushing together making large ice ridges both above and below the water. We came up through a very large opening in 1958 that was 1/2 mile long and 200 yards wide. The wind came up and closed the opening within 2 hours. On both trips we were able to find open water. We were not able to surface through ice thicker than 3 feet.” - Hester, James E., Personal email communication, December 2000
Seadragon (SSN-584), foreground, and her sister Skate (SSN-578) during a rendezvous at the North Pole in August 1962:

And of course then there’s this famous photo:

The point illustrated here: the North Pole is not static, ice varies significantly. The Arctic is not static either. Variance is the norm.
There’s quite an interesting read at late, great John Daly’s website, including a description of “the Gore Box”. Everybody should have one of those. h/t to WUWT commenters Stephen Skinner, Crosspatch, and Glenn.
|

