Feb 15, 2009
Edinburgh Shivers During One of the Coldest-Ever Februarys
By Gareth Edwards
It’s official - Edinburgh is in the midst of one of the coldest Februarys on record, and the icy conditions are set to stay with us for up to a month. Weather experts say that with temperatures as low as -7C, and daily averages fluctuating between 2C and -3C, the city is in line to record its first sub-zero average February in more than a decade.
Yet while forecasters predict the mercury will struggle to climb above freezing for weeks to come, it is nowhere near Edinburgh’s worst winter. Records show that back in 1947, the average temperature for the area over February was a frosty -3C. The closest the Capital has come to a February that severe since then was back in 1986, when the temperatures dropped to an average -1.9C for the month.In recent years the trend has been for milder winters, making the current cold snap all the more unexpected.
Edinburgh was again covered with a blanket of snow yesterday, with forecasters predicting the wintry weather and snow showers would continue for the rest of the month.
A spokesman for the Met Office said: “Certainly in recent years we have seen the average temperature of January and February rise, so we are getting used to milder months at the start of the year. ‘As a result, there has been almost no lying snow around this time of year, which is why this is a bit unusual, and more of a shock. “The last two years have been especially mild. There is no sign of the cold weather front moving on anywhere for at least a few weeks, so it looks like the low temperatures could continue, which means the average temperature could be even lower.”
As the UK is gripped by one of the coldest months in recent memory, on the other side of the world Australia is recording temperatures of up to 46C, something which has not been seen there in almost a century. (which means it was very warm a century ago) In addition, the more tropical parts of the continent are suffering major floods as a result of relentless downpours.
This kind of extreme weather, with colder winters and hotter summers seen around the world, is, the Met Office says, in line with some climate change predictions the met office spokesman said reading off cue cards.
Dr Chris Merchant, a senior lecturer in meteorology at the University of Edinburgh, said that while recent cold weather in the UK may seem severe, it was not , on the far broader scale of the world climate, an extreme. “We are not having ‘extreme’ weather here in the UK, although it would be fair to say that it is a little unusual, as the winters in Scotland have been getting steadily milder over the past three decades,” he said. “There are so many different factors that can affect the weather though. For example, a lot can depend on the ocean being colder or warmer than usual in different places. Goode for you Dr. Merchant! “The weather over a month really is just weather though - climate is something that is measured over a 30-year period - so we can’t read too much into this.” See story here.
See also here how the cold and snow has killed off most of the early flowers typical of the climate of southwest Britain.
Feb 12, 2009
Another Unnecessary Climate Action Plan Endangers Washington State’s Economic Future
By Warren Cornwall, Seattle Times Environment Reporter
Report: Climate change to wallop state
Washington’s energy system is in for a double whammy from global warming, as rising demand for power-sucking air conditioners couples with a significant loss of summertime production from the region’s hydroelectric dams, according to a new University of Washington study.
The network of dams along Northwest rivers is a linchpin of the region’s economy, providing relatively cheap, abundant power that, as a bonus, doesn’t emit the greenhouse gases blamed for climate change. But that system is in for a shock as rising temperatures in the 21st century diminish winter snowpacks that provide water to turn power turbines in summer.
Summer production from the Columbia River hydropower system could drop by 16 percent by the 2040s, according to the new report by the UW’s Climate Impacts Group. Over the same time, demand to run air conditioners could increase in Washington, driven by rising temperatures and population growth, according to the report. “The losses of capacity are likely to cause a lot of problems,” said UW hydrologist Alan Hamlet, who wrote the sections of the report about energy. “It could even be made worse by the summertime increases in load.”
Those are just some of the potential problems ahead for the state, according to the report, which represents the most detailed attempt yet to forecast what climate change means for Washington. The report was funded by the Legislature in 2007.
Past climate reports have predicted some of the same impacts to the state, but none has been as comprehensive, said UW researcher and Washington State Climatologist Phil Mote, who worked on the study.
The analysis was based primarily on computer models used to forecast how the globe’s climate is likely to change in the future as greenhouse gases trap heat close to the Earth’s surface. These models predict a 3.5-degree Fahrenheit rise in average annual temperatures by the 2040s and 5.9 degrees by the 2080s, compared with average temperatures from 1970 to 1999.
The report comes as Gov. Chris Gregoire lobbies the Legislature to create new regulations forcing Washington industries to cut greenhouse-gas emissions.
The proposal has met with strong opposition from business groups and some lawmakers, who warn it could hurt industries struggling in the recession. Read more here.
The Governor, the Seattle Times and Phil Mote are all endangering their state and their already uncertain future. See how Mote was caught cherry picking the data here. See the real story that the changes are caused by the natural PDO and have nothing at all to do with greenhouse gases here. See how this cold PDO and its snow and cold has caught the state unprepared here.
We can only hope for the sake of the good people of Washington State that the Governor and the state climatologist get replaced and the plan discarded soon. The Seattle Times continued decline will take of that other problem before long.
Feb 11, 2009
The Collapse of Climate Policy and the Sustainability of Climate Science
By Roger Pielke Jr., Prometheus
The political consensus surrounding climate policy is collapsing. If you are not aware of this fact you will be very soon. The collapse is not due to the cold winter in places you may live or see on the news. It is not due to years without an increase in global temperature. It is not due to the overturning of the scientific consensus on the role of human activity in the global climate system.
It is due to the fact that policy makers and their political advisors (some trained as scientists) can no longer avoid the reality that targets for stabilization such as 450 ppm (or even less realistic targets) are simply not achievable with the approach to climate change that has been at the focus of policy for over a decade. Policies that are obviously fictional and fantasy are frequently subject to a rapid collapse.
The current shrillness that has been observed by many politically-active climate scientists and the feeding-frenzy among their skeptical political opposition can be explained as a result of this looming collapse, though many will confuse the shrillness and feeding-frenzy as a cause of the collapse. Let me explain.
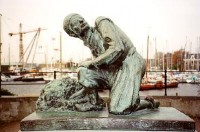
If you think that the current consensus on climate politics rests on a foundation called the scientific consensus, you might see signs of weakening in the political consensus as prima facie evidence that the scientific consensus must be itself weakening, or if you’d prefer, that people are making it look to be weakening, regardless of the reality. Thus, like the apocryphal Hans Brinker (pictured above), the politically active climate scientists are actively trying to plug holes in the dike, as the skeptics try to poke more holes. The climate scientists (and their willing allies) have taken their battle to the arenas of politics, waging a scorched earth campaign of bullying, name calling, threats, and obnoxiously absurd appeals to authority. The skeptics participate in similar fashion, and the result is an all out brawl that we see escalating still before our eyes. The skeptics think they are unraveling a mythical scientific consensus imposed by an evil elite, while the climate scientists think they are waging an all out battle of righteousness against know-nothing hordes. They are both wrong.
Climate politics is collapsing because of political realities, and not real or perceived changes in how people see the science. As I have often argued, in the ongoing battle between climate scientists and skeptics there will be disproportionate carnage, because the climate scientists have so much more to lose, and not just as individuals, but also for the broader field, which includes many people simply on the sidelines.
The collapse of the political consensus surrounding climate could well be an opportunity to recast decarbonization of the global economy and adaptation to climate impacts in a manner that is much more consistent with progress toward policy goals. If climate science can be saved from itself, that would be a bonus. However, for climate science I fully expect things to get worse before they get better, simply because the most vocal, politically active climate scientists have shown no skill at operating in the political arena. The skeptics could not wish for a more convenient set of opponents. Read more here.
Feb 10, 2009
Carbon Collapse: Plunging Price Threatens Green Dreams
By Sarah Arnott, UK Independent
The price of carbon has lost almost two-thirds of its value in the past six months, threatening future investments in the energy sector and undermining confidence in the second phase of Europe’s Emissions Trading Scheme (ETS). An EU permit to emit one tonne of CO2 cost 10.15 Euros (8.86 Pounds) at the end of last week, down from 28.50 Euros in mid-2008 and a far cry from forecasts of up to 40 Euros.
The most bearish experts are now predicting that the price could fall as low as 9 Euros as global recession, reduced manufacturing output, and the concomitant reduction in consumption of fossil fuels, feeds through to reduce the need for carbon emissions permits.
The danger is that business plans for infrastructure projects like power stations and wind farms will flounder. In the first phase of the EU ETS, which ran from 2005 to 2008, permits were vastly over-issued, pushing the price of carbon to less than 1 Euro and rendering the mechanism meaningless as a predictable revenue stream. A major price drop in the second phase of the scheme, which runs to 2012, could cause a repeat crisis of confidence by throwing future projections into question. Jeff Chapman, the chief executive of the Carbon Capture and Storage Association, said: “The problem is that investors can’t bank on a future value of carbon. It is impossible to take a project proposal to a bank based on a future price because we have seen the price collapse once before, and it is now doing it again.”
There are now questions about whether government policies might change as the economic climate worsens. Paul Golby, the chief executive of E.ON, said: “There is a confidence issue around whether governments will keep their nerve. The plan was to keep tightening the carbon market to push the price up and encourage low-carbon investment. The question now is whether governments back away from that, and seek to ameliorate the effect of the recession on hard-hit industries by keeping the carbon price low.”
Supporters of the trading scheme interpret the fluctuations of the carbon price in line with wider economic indicators as evidence of a mature and well-functioning market. Henrik Hasselknippe, the director of Carbon Analysis at PointCarbon, said: “What we are seeing now is carbon functioning as a commodity and reacting to the same fundamentals as any other market in the world. It would be much more worrying if carbon stayed high because that would indicate something was wrong.”
But the low price is already having a tangible effect. Under the Kyoto Protocol’s Clean Development Mechanism (CDM), industrialised countries can invest in overseas low-carbon projects as a cheaper alternative to pursuing such schemes at home. But with EU carbon prices coming down to within an ace of costs in China or India, the differential is no longer enough justification. “At the moment, people are holding off investing in these projects because profitability is dwindling with lower emissions prices,” Mr Hasselknippe said. “Saving just one extra euro isn’t enough to make people go to China.”
Despite the gloom in the rest of the economy, carbon trading has flourished since the start of phase two of the EU ETS last January, under which fewer permits were issued, and a proportion will be auctioned for the first time. Last year was a bumper year for the European Climate Exchange (ECX). Some 2.8bn tonnes of emissions were traded, a massive 170 per cent rise on 2007. Patrick Birley, the ECX chief executive, said: “The exchange had a fantastic year, although it was hard to walk around the City feeling good about our volumes when so many of our friends were being clubbed.”
Feb 07, 2009
Global Warming Will Save People’s Lives
By Andrew Bolt Herald Sun
More than 30 Victorians died in last week’s heat in one of the great scandals of green politics. About 20 more people died in South Australia, but neither state government is telling yet how precisely the victims died, saying they are awaiting coroners’ reports. But already warming extremists such as Prof Clive Hamilton are excusing these same governments—which almost certainly contributed to at least some of these deaths. “Australians are already dying from climate change,” shouted this professor of public ethics at the Australian National University, and author of Scorcher. But Hamilton is utterly wrong.
Fact: Cold, not heat, is what really kills people, as we see now in Britain. Fact: A warming world would save countless lives, not cost them. And fact: Those who died last week were in less danger from global warming than from the deadly incompetence of green governments trying to “stop” it. You think that sounds extreme?
Then consult the unambiguous evidence that damns the governments of both Victoria and South Australia. We already know a heatwave can kill the very frail, if they aren’t protected. In 1939, for instance, 438 people died in the Black Friday heat, not including the 71 Victorians killed by the fires. The temperatures back then were higher than those in Victoria and South Australia last week, but the heat this time hung around for longer. Yet despite our much greater population today, no more than 50 people died from heat, a fraction of the 1939 toll.
What changed? Mostly our ability now to stay cool - most obviously through airconditioning. Airconditioning saves not just sweat, but lives. But what do we now see? South Australia’s Government actually asked people to avoid using airconditioners last week, citing environmental reasons. In Victoria, Deputy Premier Rob Hulls had earlier asked people to likewise avoid using airconditioners unless necessary. The Age even campaigned against them, asking readers to toughen up.
But far deadlier than this jihad against airconditioners was that the power in both states last week crashed. On the first day of Melbourne’s heat wave, tens of thousands of homes - some with sick people - lost power because our grid cannot cope with cities grown so big and rich that many of us use airconditioners. And the next day 500,000 more homes went black when the cable carrying extra power from Tasmania was switched off. Sure, it had been designed to operate until temperatures reached 45C in Melbourne, but not (for some reason) if they reached just 35C in Tasmania.
Hamilton might argue that this is simply the mounting death toll we must expect when 20th century cities meet 21st century warming. Let’s ignore the obvious reply - that in fact the globe has cooled since 2002, although, true, it may soon warm again. Let’s look instead at Britain, now having its coldest winter in 13 years. So vulnerable are the elderly to cold that a World Health Organisation report last year estimated that 40,000 Britons died every winter, and these “excess winter deaths are related to poor housing conditions - insufficient insulation, ineffective heating systems and fuel poverty”. That’s right: 40,000 Britons die each year in the cold, often because they’re too poor for warming. Compare that to the just 50 Australians who may have died in the worst heatwave in a century. The British Facility of Public Health even says it expects 8000 Britons to die for each degree that the cold dips below the winter average. And this winter is so severe that the National Pensioners Convention has warned that one in 12 old people may perish. What’s true of England is true everywhere. The British Medical Journal in 2000 reported a study by scientists in Britain, Italy, Holland and France who found that “all regions showed more annual cold-related mortality than heat-related mortality”. They concluded: “Our data suggest that any increases in mortality due to increased temperatures would be outweighed by much larger short-term declines in cold related mortalities.”
Understand, Clive? Rising temperatures will actually save lives. Indeed, University of London researchers calculated in the Southern Medical Journal that in Britain, at least, a big warming over the next 50 years “would increase heat-related deaths in Britain by about 2000 but reduce cold-related deaths by about 20,000”. So let’s agree on the evidence: cold is the real killer, and airconditioning saves us in summer, just as central heating can save the frail in winter. So how mad are our governments? The Rudd Government will next year impose an emissions trading scheme that will “save” the planet by making power for your heaters and coolers more expensive. Victoria is even trialing a smart-meter so it can cut power use on hot days by making your electricity so expensive that you’d have to pay $170 a day to run ducted airconditioning. And all this to “save” a planet from a warming that could save hundreds of thousands of lives. We’re “dying from climate change”, Clive? Dying for it, more likely. Read post here.
|

