|
Jul 04, 2008
Biofuels Behind food Price Hikes: Leaked World Bank Report
AFP
Biofuels have caused world food prices to increase by 75 percent, according to the findings of an unpublished World Bank report published in The Guardian newspaper on Friday. The daily said the report was finished in April but was not published to avoid embarrassing the US government, which has claimed plant-derived fuels have pushed up prices by only three percent. Biofuels, which supporters claim are a “greener” alternative to using fossil fuel and cut greenhouse gas emissions, and rising food prices will be on the agenda when G8 leaders meet in Japan next week for their annual summit.
The report’s author, a senior World Bank economist, assessed that contrary to claims by US President George W. Bush, increased demand from India and China has not been the cause of rising food prices. “Rapid income growth in developing countries has not led to large increases in global grain consumption and was not a major factor responsible for the large price increases,” the report said. Droughts in Australia have also not had a significant impact, it added. Instead, European and US drives for greater use of biofuels has had the biggest effect. “The basket of food prices examined in the study rose by 140 percent between 2002 and this February,” The Guardian said. “The report estimates that higher energy and fertiliser prices accounted for an increase of only 15 percent, while biofuels have been responsible for a 75 percent jump over that period.” Read more here.
Jul 03, 2008
What a Difference 20 Years Make
By Anthony Watts, Watts Up With That
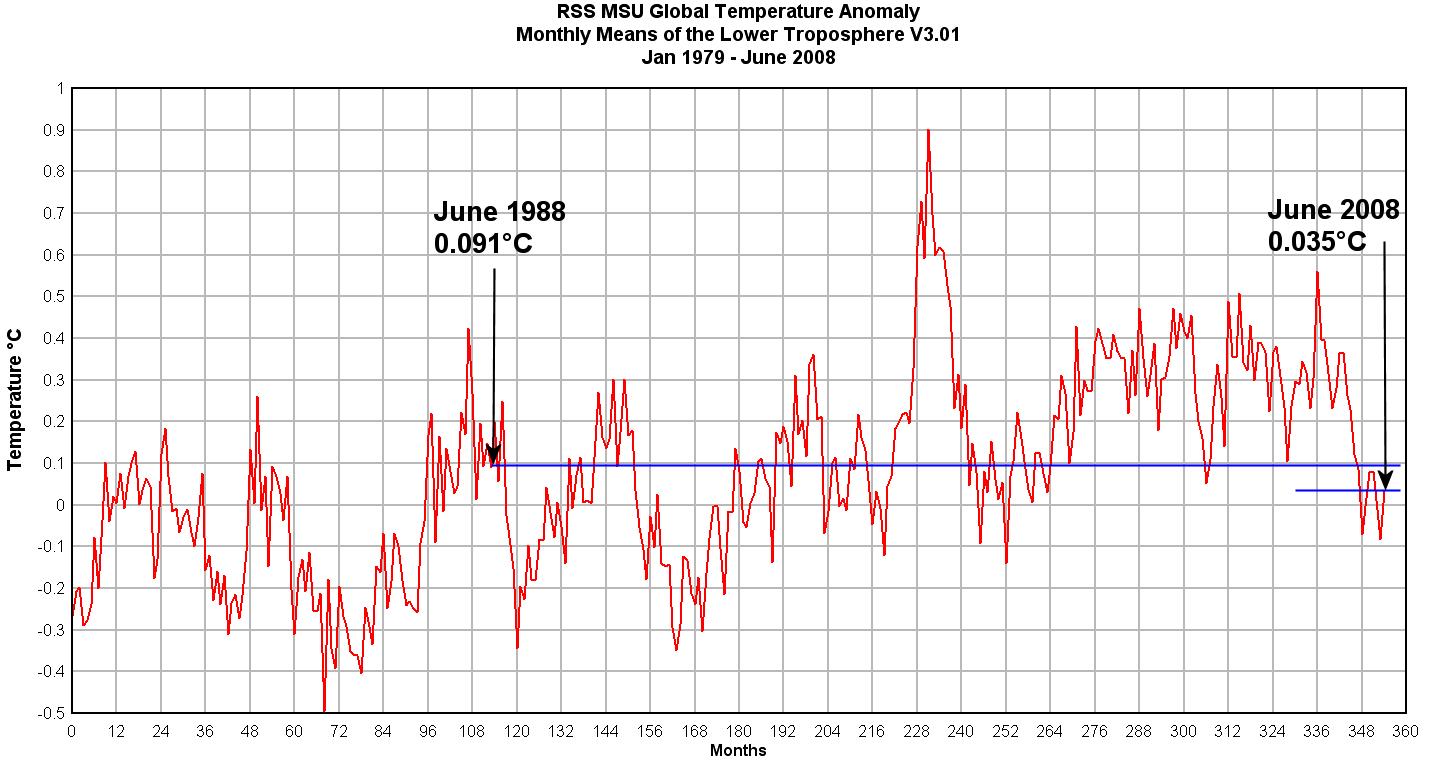
Recently, Dr. James Hansen of NASA GISS gave his 20 year anniversary speech before congress, in which he was restating the urgency of the global warming crisis we now face. Warnings of tipping points, and a call for putting “energy executives on trial for crimes against humanity and nature” were parts of that speech.
Here are the just published global temperature data sets for UAH (University of Alabama) and RSS (Remote Sensing Systems) and the 20 year time-line. Dr. Hansen if you are reading can you kindly point out where in the time-line the crimes occurred and tipping points are?
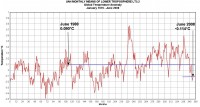
See larger image here.
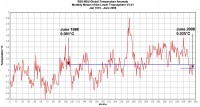
See larger image here.
I would have thought the CO2 enhanced warming would have been further along by now. Maybe the graphs are inverted? See more here.
Jul 01, 2008
Okanagan Cherry Crop will Take $36 Million Hit
By Judie Steeves - Kelowna Capital News
It’s estimated April’s record-breaking cold has caused $36 million in losses to this year’s cherry crop in the Okanagan Valley. Adjusting agrologist Trevais Mellum, who works out of the agriculture ministry’s Kelowna office, says he’s looked at what’s on the trees from the south of the valley to the north, and he expects growers will only pick about a quarter of their normal production.
The worst damage is in the Central Okanagan, where most of the large cherry orchards are located, so that’s where the biggest economic hit will be felt, Mellum says. Because many cherry growers pack fruit in the orchard, rather than shipping it to a central packing plant, it’s difficult to estimate the value of the total crop. But Mellum estimates a normal crop in the valley is worth $50 million on the retail market.
Cherry growers are finding more damage was done than had been initially thought, although it’s patchy and varies by variety, so final figures could be different once the crop is in the box. But East Kelowna grower Christine Dendy admits, “it’s going to be a tough year.” Dendy figures she has about 35 per cent of her crop left, after the cold damaged the blossoms, the remaining ones weren’t properly pollinated and there was a heavy drop in early June. Although she has crop insurance, she says it doesn’t begin to cover the losses.
Now, she’s worried about keeping pickers happy with such a light crop, and how she’ll plan for labour when she’s not sure how much fruit is on the trees. “I still have to maintain the orchard; spray the same sprays, yet I won’t have the cash to pay for it this year,” she said. “It will be much more expensive to produce the fruit that’s there,” she added. Her only hope now is that there will be better prices for cherries, since crops are way down in Washington State as well. She’s also hopeful there could be better sized fruit because there will be more strength in the tree, which is nurturing less fruit. Mellum said many growers who had initially thought they had crops of 70 to 80 per cent of normal are now finding-after the June drop-they have closer to 20 or 30 per cent of a crop. Read more here.
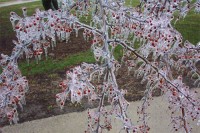
See larger image here
Jul 01, 2008
Climate Regime Shifts of the Past Four Centuries
CO2 Science
D’Arrigo et al. (2005 Journal of Climate), developed a tree-ring-based reconstruction of the December-May North Pacific Index (NPI) - which is a measure of the atmospheric circulation related to the Aleutian low pressure cell - for the period 1600-1983, based on data derived from 18 tree-ring chronologies (selected from a total of 67 candidate chronologies) obtained from sites surrounding the North Pacific rim that calibrated “significantly at or above the 90% significance level” against winter/spring monthly values of the NPI derived from 20th-century instrumental data. In addition, they employed an intervention analysis to the NPI reconstruction “to identify significant shifts in the series.”
D’Arrigo et al. report that “the NPI reconstruction successfully tracks the known regime shifts (1924/25, 1946/47, and 1976/77) seen in the instrumental NPI during the twentieth century.” They also note that “prior to the instrumental period there are decadal-scale variations that may also represent regime shifts,” noting that “significant ‘shifts’ (at the 90% confidence limit) are identified in 1627, 1695, 1762, 1806, 1833, 1853, and 1891.”
The nine researchers conclude that their analysis “suggests that the 1976 transition was not unique in terms of magnitude.” In addition, the recurring nature of the climate regime shifts suggests that they are natural non-anthropogenic-forced phenomena that have nothing to do with the historical increase in the air’s CO2 content. This conclusion is particularly noteworthy in light of the fact that the study of Seidel and Lanzante (2004) suggests, in their words, that “it is reasonable to consider most of the warming during 1958-2001 to have occurred at the time of the climate ‘regime shift,’ modeled here at the start of 1977.” Consequently, the complementary findings of these two studies do much to relieve anthropogenic CO2 emissions of responsibility for the global warming of the last fifty or more years. See story here.
Jun 30, 2008
Arctic Ice Melt May be Due to Undersea Volcanoes
By Thomas Lifson, American Thinker
The Arctic ice that is supposedly melting, stranding those cuddly looking polar bears, just might be affected by a wave of volcanic eruptions on the ocean floor under the Arctic ice cap. AFP reports on the recently-documented volcanoes, but oddly makes no mention of the possible effect on apocalyptic predictions of global warming. Recent massive volcanoes have risen from the ocean floor deep under the Arctic ice cap, spewing plumes of fragmented magma into the sea, scientists who filmed the aftermath reported Wednesday. The eruptions - as big as the one that buried Pompei - took place in 1999 along the Gakkel Ridge, an underwater mountain chain snaking 1,800 kilometres (1,100 miles) from the northern tip of Greenland to Siberia.
Scientists suspected even at the time that a simultaneous series of earthquakes were linked to these volcanic spasms. But when a team led of scientists led by Robert Sohn of the Woods Hole Oceanographic Institution in Massachusetts finally got a first-ever glimpse of the ocean floor 4,000 meters (13,000 feet) beneath the Arctic pack ice, they were astonished. What they saw was unmistakable evidence of explosive eruptions rather than the gradual secretion of lava bubbling up from Earth’s mantle onto the ocean floor. (NOTE: SEE THIS EXCELLENT EXPEDITION ACCOUNT HERE)
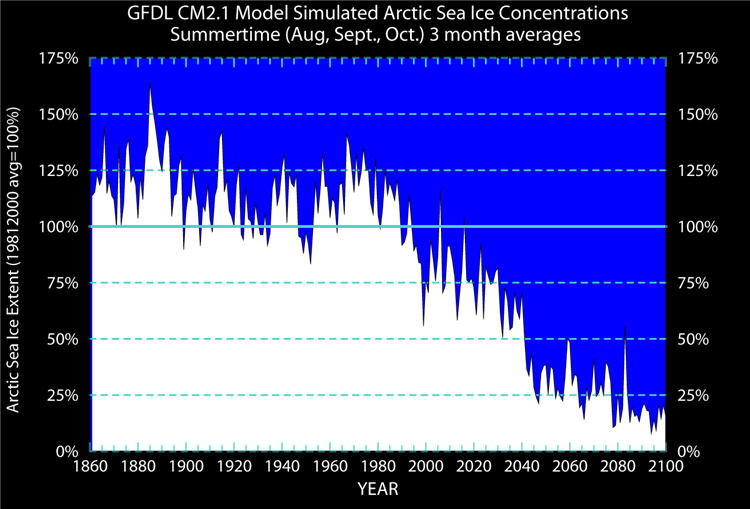
Steve Gilbert of Sweetness & Light draws our attention to the report, and makes all the connections AFP studiously ignores: “Er, is it not possible that these volcanic eruptions - going back to at least 1999 - may have played a part in whatever melting there has been of the Greenland and Arctic ice sheets?” For according to the global warming cultists scientists at NOAA’s Geophysical Fluid Dynamics Laboratory, the decline seems to have begun in earnest around 1999.
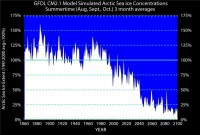
See larger graph here
But isn’t it funny how not one word of this possibility was ever mentioned in the original article? Why is that? Do not hold your breath waiting for the major media to trumpet this dramatic new discovery and the implication that anthropogenic global warming theory has nothing to do with polar bears. Read more here.
Icecap note: This would be similar to what happens near the Antarctic peninsula where ice sheets have been cracking even as the total ice extent for the vast continent has risen to record levels. As of the latest report, we are running 1.5 million square KM ahead of last year when we set the record (since satellite tracking began in 1979). We have more Arctic Ice this year too. See the current status side-by-side with 2007 here. This arctic volcanic activity along with the delayed melting from the warm Atlantic water intrusion as identified by Polykov and Francis here may have been responsible for the recent rapid arctic ice decline even as gobal temperatures cool. Finally as for the Northwest Passage being unprecedented before 2007, see this post suggested by Tom Nelson here . He notes how the Northwest Passage was navigated in many prior years including 1906, 1940, 1941, 1942, 1944, 1957, 1969, 1977, 1984, 1988, and 2000.
|
|
|
|

