Aug 10, 2007
Understanding California Weather Patterns
By Jim Goodridge, Retired California State Climaologist
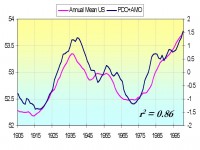
The evidence for a major climate shift since the mid 1970s is quite real. California indices of rainfall and temperature have both shown an increasing trend since 1975.
Physical changes in Earth weather systems that accompany the 1975 weather trend changes include the Pacific Decadal Oscillation (PDO) index, a 1975 change in the Atmospheric Angular Momentum (AAM) index and a 1940 increase in solar irradiance. Note: a detailed discussion of these factors and the contamination by urbanization follows in this excellent analysis.
The preservation and protection of temperature measuring sites needs to be considered. The future of temperature measurement in urban regions is fast being modified by urban growth. Waste heat and environmental changes are underway at the present time. A question is; at what distance from a waste heat source is the temperature measurements being modified and how much? A monitoring program for temperatures in areas free of land use change and waste heat is much needed. Perhaps areas dedicated to no development like parks would be ideal monitoring sites for temperature measuring. Read full analysis here.
Aug 08, 2007
Steve McIntyre Catches Error in NASA GISS Temperatures
By Stephen McIntyre, Climate Audit
"I observed recently that Hansens GISS series contains an apparent error in which Hansen switched the source of GISS raw from USHCN adjusted to GHCN for all values January 2000 and later. Ive collated GISS raw minus USHCN adjusted for all USHCN sites.
Here is a graph showing the difference between GISS raw and USHCN adjusted by month (with a smooth) for unlit stations (which are said to define the trends).
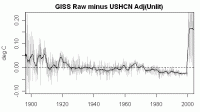
The step in January 2000 is clearly visible and results in an erroneous upward step of about 0.18-0.19 deg C. in the average of all unlit stations. I presume that a corresponding error would be carried forward into the final GISS estimate of US lower 48 temperature and that this widely used estimate would be incorrect by a corresponding amount. The 2000s are warm in this record with or without this erroneous step, but this is a non-negligible error relative to (say) the amounts contested in the satellite record disputes.”
However GHCN did not use the same adjustments, and this introduced an upward step in the US average for all years after 2000. Hansen and colleagues didn’t notice until Steve asked them for an explanation. They have now amended their web site and acknowledged Steve’s contribution .
GISS estimated that the error added 0.15 C to each year in the US after 2000. Steve estimated 0.18-0.19 C, but they have refused his request for code to verify their claim. That of course will change the rankings of the recent years.
Icecap note: The GHCN data and approach used by GISS and soon by USHCN is itself seriously flawed. I and others believe if the global data were properly adjusted for urbanization and station siting and land use change issues were addressed, what would emerge is a cyclical pattern of rises and falls with much less of any background trend. The whole GW movement is to some degree riding the coattails of the global increase in population and the associated urban heat island effect and other local factors.
Aug 08, 2007
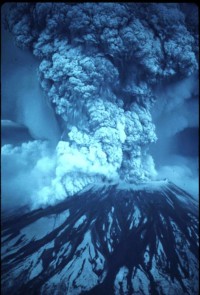
The Volcanic Record and Climatic Cycles
By Dr. Reid Bryson
Icecap is very fortunate to have this contribution from the preeminent climatologist, Reid Bryson, Professor Emeritus at my alma mater, the University of Wisconsin who is still very active as Senior Scientist at the Center for Climatic Research. In this paper, Dr. Bryson, shows the importance historically of volcanic activity and specifically volcanic induced sulfur dioxide in climate changes.
“After the intense research associated with the Mt. St.Helens it became clear that it was mostly the very small droplets of saturated sulfuric acid converted from volcanic (and industrial) sulfur dioxide that had a sufficiently long half-life in the stratosphere to be climatically important. It was also established at that time that the sulfuric acid droplets in the Junge layer had a very small absorption to backscatter ratio, and thus always produced cooling. The sulfur dioxide did not need to be blasted into the stratosphere, so the importance of a volcano became greater as its sulfur dioxide content rose, not by how much solid tephra was produced.”
“...in our investigations here at Wisconsin, we included all sizes of eruptions, for two medium eruptions might introduce as much or more sulfur dioxide into the stratosphere as one large eruption. It is also now obvious that the tropopause is not an ubiquitous barrier, for isentropes from the lower troposphere in lower latitudes are continuous into the stratosphere in higher latitudes. The author has personally followed the New York City pollution plume from the ground into the stratosphere over Iceland.” Read more here.
Aug 07, 2007
Rare Snow in Santiago Chile
By Matthew Walter, Bloomberg News
Snow fell in downtown Santiago for the first time in eight years last night, downing tree branches that knocked out power in parts of the Chilean capital, as a polar wave caused temperatures to plummet. Schools closed in parts of central Chile, and the pass through the Andes mountains linking the country with Argentina was blocked for a second day. A white blanket of snow covered much of the eastern half of Santiago. The National Meteorological Service says colder weather may be coming.
“When the clouds clear tonight, the temperature could drop quickly,’’ Janette Calderon, a meteorologist at the service, said in a telephone interview. Temperatures in the eastern suburbs of the capital at the foot of the Andes may fall to 5 degrees below zero Celsius (23 degrees Fahrenheit), which would break a record set July 10 of 4 degrees below zero, Calderon said. Seven municipalities in Santiago experienced partial electricity shortages because of fallen power lines this morning, Chile’s National Emergency Office said today in a statement.
Aug 02, 2007
Synchronized Chaos: Mechanisms For Major Climate Shifts
By Science Daily
In the mid-1970s, a climate shift cooled sea surface temperatures in the central Pacific Ocean and warmed the coast of western North America, bringing long-range changes to the northern hemisphere. After this climate shift waned, an era of frequent El Ninos and rising global temperatures began.
Tsonis et al. investigate the collective behavior of known climate cycles such as the Pacific Decadal Oscillation, the North Atlantic Oscillation, the El ino/Southern Oscillation, and the North Pacific Oscillation. By studying the last 100 years of these cycles’ patterns, they find that the systems synchronized several times.
Further, in cases where the synchronous state was followed by an increase in the coupling strength among the cycles, the synchronous state was destroyed. Then. a new climate state emerged, associated with global temperature changes and El Nino/Southern Oscillation variability. The authors show that this mechanism explains all global temperature tendency changes and El Nino variability in the 20th century. See full story here.
This is a welcomed new peer-review work. Note agreement with an earlier ICECAP blog here.