Aug 24, 2009
New Climate Bill - Guaranteed To Increase CO2 Production
Cincinnatius Blog
From Disneyland on the Potomac another ill conceived environmental bill, the “American Clean Energy and Security Act” which will virtually guarantee that global carbon dioxide (CO2) levels increase at faster rate. In the process we will also eliminate over 3 million American jobs.
President Obama has chosen to placate his left wing base by promoting the “Waxman-Markey global warming bill” over his stated goal of creating new jobs. A study by Charles River Associates concluded that if Obama signs off on this Congressional proposal to reduce CO2 emissions, it would have a serious impact on the availability and cost of energy. “By 2025, just 16 years from now, the cost of natural gas would rise 56%, electricity 44% and motor fuel 19%. Annual household purchasing power would annually decline by an average of $1,827. And America will lose 3.2 million jobs.” Obama can only hope and pray that the creation of “Green Jobs” will at least partially offset this loss.
Rather than focus on available technological solutions, Obama says let’s burden hard working American consumers with another ill-conceived regressive tax! Who will ultimately pay for this brilliant plan? Consumers of course! This burden, however, will not be shared equally. The already economically hard-hit middle of the country, which is dependent on coal-fired plants for electricity, will be disproportionately taxed. The White House talks the talk when it comes to helping the economically challenged States of the “Rust-Belt,” but they sure don’t walk the walk.
The goal of the “American Clean Energy and Security Act” is to reduce overall U.S. greenhouse gas emissions by 17% from 2005 levels by the year 2020, and 83% by mid-century. In typical Congressional and Obama one-dimensional thinking they seem to have forgotten that it is global carbon dioxide production that we concerned about. American manufacturing which is already uncompetitive in the global market is about to become even less competitive.
Hooray we can reduce U.S. CO2 production by a miserly 17% by 2020. But by increasing the cost of manufacturing in the U.S. we will almost certainly demolish what is left of our manufacturing base and wind up outsourcing it to the least environmentally friendly country in the world, China. China has does not restrict CO2 for fear of making its manufacturing base uncompetitive.
China is by far the largest producer of carbon dioxide (CO2) in the world. A conservative estimate is that for every molecule of CO2 we save in the United States, China, our surrogate manufacturer will incrementally produce 3 CO2 molecules. In net effect by making manufacturing to costly in the U.S. we may technically reduce our CO2 production by 17% but we will have our proxy China incrementally increase their CO2 production threefold - resulting in an real increase in the U.S. related carbon dioxide production of 34%.
America’s biggest oil companies will probably cope with the new U.S. carbon legislation by closing fuel plants, cutting capital spending and increasing imports. Experts predict - “It will lead to the opportunity for foreign sources to bring in transportation fuels at a lower cost, which will have an adverse impact to our industry, potential shutdown of refineries and investment and, ultimately, employment”. Contrary to President Barack Obama’s goal of reducing dependence on overseas energy suppliers, the bill would give U.S. refiners an incentive to import more fuel. With one bold sweep of Obama’s pen he can make us more dependent on foreign energy and cause a further deterioration in our balance of trade.
When the only tool you have is a hammer, the whole world looks like a nail. In other words, there is no problem that a bureaucrat can’t solve, if only we would let them pass another regressive tax. That may well be the sum total of the creative thinking that has gone into the Obama “American Clean Energy and Security Act”. The Obama Administration proposes that companies buy a permit for each ton of carbon emitted, at an estimated cost, to start of approximately $13 to $20 per ton. The permits could then be bought and sold. The theory behind this convoluted scheme is that it will somehow miraculously increase energy efficiency and renewable energy development.
We could solve this problem in any number of ways that would not unduly burden the consumer. Let me give you a few examples. In the United States we emit over 24 metric tons of carbon dioxide per person; in France they emit a little over 6 metric tons per person. So, let’s do it the French way and cut our emissions by nearly 75%. The centerpiece of France’s green strategy is of course clean nuclear power. France generates more than 75% of its electricity from nuclear reactors. All the power you want 24/7 and no carbon dioxide. The excess energy produced in off-peak times can be used to charge electric vehicles at night or generate hydrogen from water as a means to power the future hydrogen economy.
Even the “green” Germans seem to have finally come to the conclusion that wind may be fine as a supportive source of clean energy, but it is limited by both scale and its inherent intermittent nature. This year’s German election will probably result in a reversal of its long standing anti-nuclear policy, as it has become increasingly clear that only dependable nuclear power can generate carbon dioxide free, base load electricity on a nationwide scale. In Europe, the population seems to have finally realized that for 30 years the Germans have talked green but only the French have acted green.
The technology to replace carbon dioxide-belching cars and planes with high-speed inter-city mass transportation has existed for more than three decades. Continuing on our French green theme, there is, of course, the TGV (Train a Grande Vitesse) high-speed train. Following the inaugural TGV service between Paris and Lyon, in 1981, the TGV network, centered in Paris, has expanded to connect cities across France and adjacent countries. TGVs link with Switzerland, and through the French Thalys network with Belgium, Germany and the Netherlands. The Eurostar network links France and Belgium with the United Kingdom.
The key to producing less carbon dioxide emissions from fossil fuels is to use the fuel with the lowest carbon to hydrogen ratio. Coal is the least desirable because there are roughly 2 carbons for each hydrogen; oil is cleaner because it has the inverse ratio of approximately one carbon for 2 hydrogen molecules; and best of all is methane (CH4), with 4 hydrogen molecules for each carbon molecule. Natural gas is primarily methane. Thus, the reduction in carbon dioxide emissions when natural gas is substituted for gasoline in an automobile is about 25-30%.
Natural gas may not be the perfect solution to our need for a clean transportation fuel but it is certainly a good one and one that can be deployed in tens of millions of standard size vehicles in a relatively short period of time. The perfect solution will take at least a decade or two to be developed for standard size cars and trucks.
Voltaire had it right: Le mieux est l’ennemi du bien or “the perfect is the enemy of the good”. While there are only about 130,000 Natural Gas Vehicles (NGV) in the U.S, there are nearly 4.5 million of these alternative fuel vehicles worldwide, mainly in Argentina, Brazil, Pakistan, Italy, Germany and India. In Italy alone there are more than 400,000 NGV’s, demonstrating that this is not a pie-in-the-sky idea, but one that is easily and quickly implemented.
This essay is too short to detail all of the viable technological solutions that could be applied to reducing carbon dioxide emissions that would be far superior to an unimaginative regressive tax such as the “American Clean Energy and Security Act”. So let me enumerate a few additional thoughts: geothermal energy can play an expanded role, hydroelectric plants should be built not dismantled, coal gasification should be expanded, and tidal power, which unlike wind is not intermittent should be developed, as well as the creation of an energy efficient smart grid.
Unfortunately, politicians of both parties appear to have limited ability to think creatively and tend to rely on regressive tax schemes to solve all of mankind’s ills.
Aug 23, 2009
The Branch Carbonian Cult
By Jim Guirard, The American Thinker
In mid-December of 2008, over 650 scientists sent to the US Senate’s Committee on the Environment a formal Statement rejecting the notion that “the science is settled” on the alleged anthropogenic (man-caused) origins of so-called “Global Warming.”
Now, half a year later, hardly a day goes by without another prominent scientist joining the ranks of those who reject the decade-old conclusion of the UN’s Intergovernmental Panel on Climate Change (IPCC) that the primary driver of such atmospheric warming are the carbon dioxide (CO2) emissions from mankind’s burning of fossil fuels—rather than sun cycles, ocean cycles, volcanic activity and other natural causes.
In addition to citing their own scientific data and conclusions, many of these “Deniers” are concluding that the AGW Movement (of which some of them were once supporters) has taken on the worrisome attributes of a pseudo-religious cult—which operates far more on the basis of an apocalyptic “belief” system than on objective climate science.
The Global Warming Movement (AGW) has taken on the worrisome attributes of a pseudo-religious cult, which operates far more on the basis of an apocalyptic “belief” system than on objective climate science. Since this worldwide Movement and its strident policies of Less Energy at Higher Prices (in order to achieve reductions in everyone’s “carbon footprint") are at the heart of America’s enormous energy shortfall, it poses a national security threat of major proportions.
And in this context, the AGW Crusade should be understood in a “Know Thy Enemy” frame of reference—perhaps not in terms of a fully conscious or intentional enemy of the American people at a time of war and economic crisis but as a deadly threat to our economic stability and national security, nonetheless.
Kingdom of the Cults
Here, therefore, in far more detail than any routine allegation of “cultism” conveys, are no fewer than ten of this AGW ideology’s very specific characteristics, many of whose roots and lock-step influences can be found in Walter Martin’s and Ravi Zacharias’ definitive, award-winning 2003 book, “Kingdom of the Cults.”
Included in this is a specific list of “truths” (see the Ten Commandments) which must be embraced and proselytized by all Cult members.
Finally, since this AGW juggernaut seems to have brainwashed a majority of Americans, most of the media and academia, a majority of the Congress and even many churches into a mind-set of support for its pseudo-religious scam, a recent Wall Street Journal’s recent conclusion that this represents a “Mass Neurosis” of a cultic nature seems alarmingly accurate.
Truths to be Ignored or Denied
On the more climatically correct side, all that is needed to begin the collapse of this house-of-cards scam is yet another list of certifiable facts and truths—one which will disprove much of the Cult’s mission, tactics and alleged “solutions”—namely,
(a) the fact that while Arctic ice may (or may not, of late) be receding, Antarctic ice has been increasing for about 40 years
(b) the fact that global temperatures have been on a slightly decreasing trend since 1998,
(c) the fact that Mars (which features no man-made factor at all) is experiencing “global warming,” as well,
(d) the fact that Antarctic “ice shelves” which occasionally break off, float away and melt at sea, do not raise ocean levels at all,
(e) the fact that several of the “hottest years” on record were in the 1930s and 1940s, when CO2 levels were much lower than today’s,
(f) the fact that ever more scientists assert convincingly that atmospheric CO2 is a lagging consequence, rather than a triggering cause, of alleged global warming,
(g) the fact that all earlier glacial and inter-glacial periods were clearly caused not by man but by solar, ocean and volcanic cycles and “natural” fluctuations,
(h) the fact that di-hydrogen oxide (H2O) molecules—water vapor—and methane molecules are 20-30 times more heat-retentive than CO2 molecules are,
(i) the fact that termites worldwide expel about as much “greenhouse gasses” into the atmosphere as does all the burning of fossil fuels by human beings,
(j) the fact that even if all Kyoto-type limits on CO2 were obeyed by all nations, the estimated net impact by 2050 would be less than half a degree F—with a ruinous cost-to-benefit ratio of thousands to one, when the standard requirement is no more than one to one.
Conclusion: Since every such Prophet-led, scare-mongering, pseudo-religious conspiracy needs a properly descriptive name, and since this one’s primary concerns over alleged depletion of the so-called “ozone layer” over Antarctica have shifted to a panic over CO2, instead, a fitting name for this cultic gaggle might be the “Branch Carbonian Cult”. Read full post here. See Why Bringing Sanity Back on Climate Chnge Won’t Be Easy here.
Aug 22, 2009
AMS Continues to Pressure Broadcasters to Tow the Line on Man-Made Climate Change
They have another in a series of teleconferences on man-made global warming. And they picked just the right man to play a major part. You see some of the men behind so called man-made global warming are in Asheville, NC. Tom Karl is Director and on the panel. Tom Karls’ team. most notably Tom Peterson, created warming through the manipulation of the data - removal of the urban heat island (despite Karl’s excellent 1988 paper showing why it was important), recently removing the satellite input into global ocean measurements, the dropout of over 75% of the world’s stations most of them rural and the demise of the instrument station siting so that a full 90% of the nearly 1000 stations surveyed in the 1221 US climate network does not meet government standards.
Tom Karl also was a lead on what may be the worst piece of AGW hype published to date, the CCSP, which they will be presenting. Though produced with a Hollywood flair by a Hollywood producer, Susan Hassol, it is far more alarmist than even the IPCC report. See some comments here and here and here. Do a search Icecap on the left column inserting CCSP and you will see many more comments. Scroll down to June to August 2008 for most comments.
If you are a broadcaster with a more open mind on this issue, there may be some material you can use in the phone call conference.
The following is the letter to the broadcasters from Resource Media, the promotional arm for pushing AGW to the broadcasters to the Seal Holders. This is one of numerous such brainwashing sessions on climate the AMS has held, providing more than a little subtle pressure on the broadcasters. They were admonished at the last AMS broadcast meeting last year for missing a chance to ‘evangelize’ with the public on this issue. Kevin Trenberth called those that did not believe in the IPCC psuedo-scientists. Many broadcasters have left the society because they don’t like this politization of science. This advocacy science would never had happened under Ken Spengler, the long time executive Director with a crystal clear vision of what a real scientific society should be.
Dear CBM/Sealholder:
Following is an item you may find of interest.
Extreme Weather and Global Warming in the Midwest U.S.
Media Advisory: Midwest
Climate Science Briefing for Broadcast Meteorologists: Extreme Weather and Global Warming in the Midwest U.S.
A teleconference for Midwestern broadcast meteorologists featuring authors of the U.S. Global Change Research Program’s latest scientific assessment report, “Global Climate Change Impacts in the United States,” will be held on Tuesday, Aug. 25, 2009. The report, which identifies the consensus climate science conducted by academic researchers, U.S. agencies, and international bodies, is the first of its kind to detail the impacts of global warming on extreme weather by region in the United States.
The discussion will be moderated by Dr. Thomas Karl, president of the American Meteorological Society and co-chair of “Global Climate Change Impacts in the United States,” and will include Paul Gross, Chairman of the American Meteorological Society’s Committee on the Station Scientist.
Speakers will focus on the latest authoritative research about how climate change is affecting weather extremes in the Midwest U.S.—heat waves, flooding, drought, and heavy precipitation events—and in turn the impacts on human health and quality of life.
When: Tuesday, Aug. 25, 1:30 p.m. EDT/12:30 p.m. CDT
Teleconference number: 1-800-290-9461, Passcode 23821
Panelists:
Paul Gross, C.C.M., Broadcast Meteorologist at WDIV-TV, Detroit ; Chair of AMS’s Station Scientist Committee
Dr. Thomas Karl, Director of the U.S. National Oceanic and Atmospheric Administration’s National Climatic Data Center and President of AMS
Donald J. Wuebbles, Professor of Atmospheric Science at the University of Illinois . An expert on the impacts of climate change, he shared in the 2007 Nobel Peace Prize for his work with the Intergovernmental Panel on Climate Change and was a co-author of the GCRP’s June report.
For more information please visit the GCRP’s web site.
Supplemental materials to the call and a web-based guide to government reports for broadcast meteorologists is available at www.weatherandclimate.net. This site includes links to full scientific reports and regional fact sheet summaries, as well as information about this teleconference and past science briefings. Funding for the briefing and web site is provided by the William and Flora Hewlett Foundation, the Rockefeller Brothers Fund and the Mertz Gilmore Foundation. The teleconference and web site are a service of Resource Media, a 501 (c) 3 nonprofit organization.
Please note: for meteorologists unable to call in to the teleconference, a recording and transcript will be posted here at shortly after the call.
Follow weather and climate issues on Twitter here or on Facebook through the “Global Warming Climate Change Report” Group.
Contact:
Kim Curtis, Resource Media, 415-397-5000 ext. 305
Jillian Ward, Resource Media, 415-397-5000 ext. 309; 415-609-8500
See more on how societies like the AMS have been infiltrated and hijacked here, here, here, and here.
Aug 21, 2009
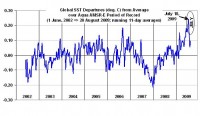
Record July 2009 Sea Surface Temperatures? The View from Space
Dr. Roy Spencer
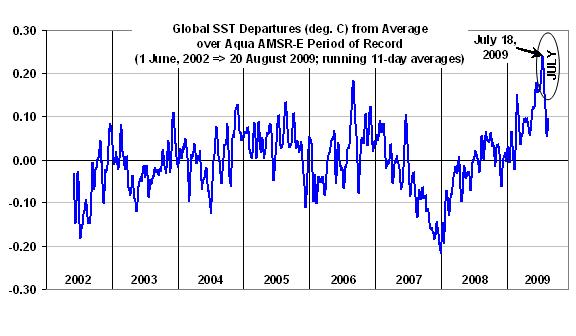
Since NOAA has announced that their data show July 2009 global-average sea surface temperatures (SSTs) reaching a record high for the month of July, I thought I would take a look at what the combined AMSR-E & TMI instruments on NASA’s Aqua and TRMM satellites (respectively) had to say. I thought it might at least provide an independent sanity check since NOAA does not include these satellite data in their operational product.
The SSTs from AMSR-E are geographically the most complete record of global SSTs available since the instrument is a microwave radiometer and can measure the surface through most cloud conditions. AMSR-E (launched on Aqua in May 2002) provides truly global coverage, while the TMI (which was launched on TRMM in late 1997) does not, so the combined SST product produced by Frank Wentz’s Remote Sensing Systems provides complete global coverage only since the launch of Aqua (mid-2002). Through a cooperative project between RSS, NASA, and UAH, The digital data are available from the same (NASA Discover) website that our daily tropospheric temperatures are displayed, but for the SSTs you have to read the daily binary files and compute the anomalies yourself. I use FORTRAN for this, since it’s the only programming language I know.
As can be seen in the following plot of running 11 day average anomalies, July 2009 was indeed the warmest month during the relatively short Aqua satellite period of record, with the peak anomaly occurring about July 18 (below, enlarged here).
The large and frequent swings in global average temperature are real, and result from changes in the rate at which water evaporates from the ocean surface. These variations are primarily driven by tropical Intraseasonal Oscillations, which change tropical-average surface winds by about 2 knots from lowest wind conditions to highest wind conditions.
As can be seen, the SSTs started to fall fast during the last week of July. If you are wondering what I think they will do in the coming months, well, that’s ‘easy’. I have no clue. See post here.
See also Roy’s post on Something Fishy with Global Ocean Temperatures here.
Aug 18, 2009
Scafetta: New paper on TSI, surface temperature, and modeling
By Dr. Nicola Scafetta on Watts Up With That
Nicola Scaffetta sent several people a copy of his latest paper today, which address the various solar TSI reconstructions such as from Lean and Rind 2008 and shows contrasts from that paper. While he suggests that TSI has a role in the temperature record, he also alludes to significant uncertainty in the TSI record since 1980. He writes in email:
“...note the last paragraph of the paper. There is a significant difference between this new model and my previous one in Scafetta and West [2007]. In 2007 I was calibrating the model on the paleoclimate temperature records. In this new study I “predict” the paleoclimate records by using the solar records. So, I predict centuries of temperature data, while modern GCMs do not predicts even a few years of data!”
Empirical analysis of the solar contribution to global mean air surface temperature change. Journal of Atmospheric and Solar-Terrestrial Physics (2009),
doi:10.1016/j.jastp.2009.07.007 By Nicola Scafetta
Abstract:
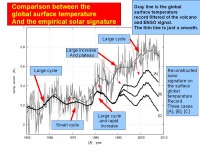
The solar contribution to global mean air surface temperature change is analyzed by using an empirical bi-scale climate model characterized by both fast and slow characteristic time responses to solar forcing. Since 1980 the solar contribution to climate change is uncertain because of the severe uncertainty of the total solar irradiance satellite composites. The sun may have caused from a slight cooling, if PMOD TSI composite is used, to a significant warming (up to 65% of the total observed warming) if ACRIM, or other TSI composites are used. The model is calibrated only on the empirical 11-year solar cycle signature on the instrumental global surface temperature since 1980. The model reconstructs the major temperature patterns covering 400 years of solar induced temperature changes, as shown in recent paleoclimate global temperature records.
Larger image here.
Excerpts from the Conclusion (from a pre-print provided by the author)
Herein I have analyzed the solar contribution to global mean air surface temperature change. A comprehensive interpretation of multiple scientific findings indicates that the contribution of solar variability to climate change is significant and that the temperature trend since 1980 can be large and upward. However, to correctly quantify the solar contribution to the recent global warming it is necessary to determine the correct TSI behavior since 1980. Unfortunately, this cannot be done with certainty yet. The PMOD TSI composite, which has been used by the IPCC and most climate modelers, has been found to be based on arbitrary and questionable assumptions [Scafetta and Willson, 2009]. Thus, it cannot be excluded that TSI increased from 1980 to 2000 as claimed by the ACRIM scientific team. The IPCC [2007] claim that the solar contribution to climate change since 1950 is negligible may be based on wrong solar data in addition to the fact that the EBMs and GCMs there used are missing or poorly modeling several climate mechanisms that would significantly amplify the solar effect on climate. When taken into account the entire range of possible TSI satellite composite since 1980, the solar contribution to climate change ranges from a slight cooling to a significant warming, which can be as large as 65% of the total observed global warming.
This finding suggests that the climate system is hypersensitive to the climate function h(T) and even small errors in modeling h(T) (for example, in modeling how the albedo, the cloud cover, water vapor feedback, the emissivity, etc. respond to changes of the temperature on a decadal scale) would yield the climate models to fail, even by a large factor, to appropriately determine the solar effect on climate on decadal and secular scale. For similar reasons, the models also present a very large uncertainty in evaluating the climate sensitivity to changes in CO2 atmospheric concentration [Knutti and Hegerl, 2008]. This large sensitivity of the climate equations to physical uncertainty makes the adoption of traditional EBMs and GCMs quite problematic.
The complete paper is here.
Read a summary of the irradiance issue and some of those other solar factors that amplify brightness or irradiance changes here.
|

