

By Joseph D’Aleo, CCM, AMS Fellow
Following the super La Nina of 2010/11, we had a period of extremes - snow and cold to start, then floods and drought, tornadoes and heat and a landfalling hurricane.
As the La Nina faded but the eastern and northern Pacific water remained cold, a warm and dry winter followed in 2011/12 much as the warm winter of 1918/19 followed the super La Nina of 1917/18 which was the only colder, snowier La Nina this century.
The warmth peaked in March. With the exception of the Pacific Northwest, most of the nation was well above normal with many daily record highs. Warmest March in the record books for the lower 48.
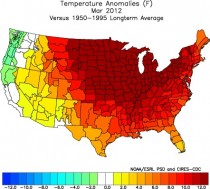
The warmth has continued but gradually subsided since then.
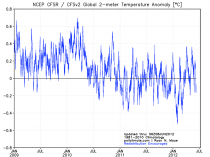
Despite the high number of record daily highs, this is a US centric warm event. The NCEP CFSv2 global anomalies from the winter through early June have been much of the time below the 1981-2010 average. The deep Eurasian cold wave shows in late January.
Enlarged
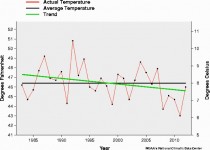
Looking back over the last century, you can explain global temperatures by ENSO and volcanism and the ocean multidecadal cycles that favor a particular ENSO state. Here is the plot since 1979 of all data sets with ENSO and volcanism indicated.
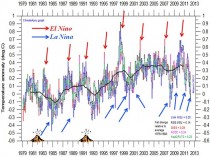
El Ninos bring a short term warming, La Ninas a dip in global temperatures. The warm mode of the Pacific from 1977 to 1998, led to a net warming. Major volcanoes produce a cooling as we saw in the early 1980s and early 1990s, lack of volcanism (like we have seen since the middle 1990s) means more solar radiation at the surface and enhanced warming.

Enlarged
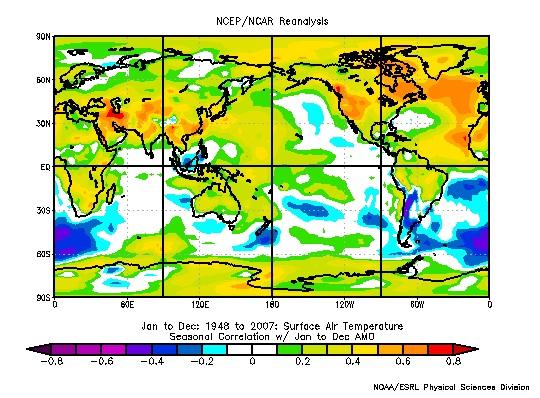
In 1995, the Atlantic went into its warm mode, which means a warmer annual temperature in the Northern Hemisphere.
May for the US was warm again making the last year in the US allegedly the warmest in the record, but as John Christy of UAH noted from the satellite perspective, it was notable only in the lower 48 (see).
Again in the Pacific Northwest, it actually was colder than the 30 year mean for the fifth straight year.
•Spring temperatures across the Northwest Region have been trending downward at a rate of 0.59 degrees F per decade during the 30 years since 1983.
•Spring temperatures across the Northwest Region have been trending downward at a rate of 4.10 degrees F per decade during the 10 years since 2003.
A Cold west usually translates to warmth further east as we saw in the 2010 and 2011 summers.
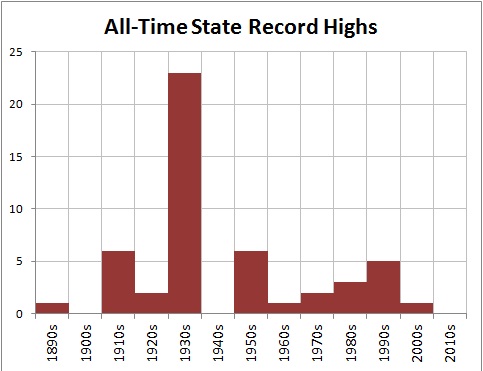
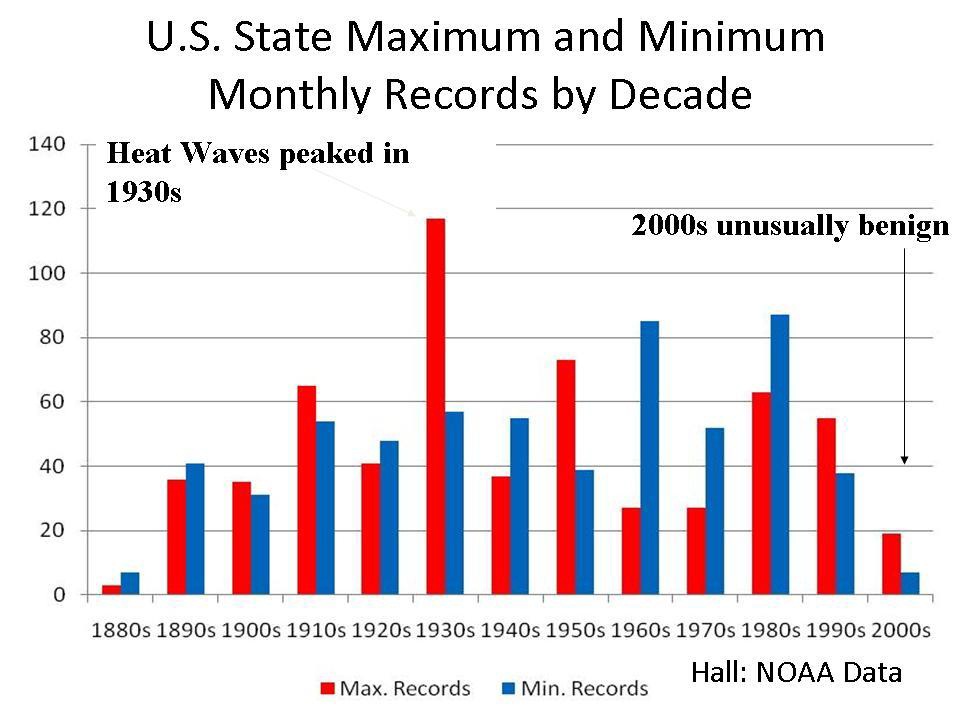
As hot as it has been the past two summers, the heat is not cracking all-time levels. Here is the latest decadal plot of all-time records for the 50 states. When multiple years are tied, the latest year/decade is used.

Enlarged
The 1930s stands out as the hottest decade, the 1910s and 1950s were second, 1990s third and 1980s fourth. This decade doesn’t rank although it is early.
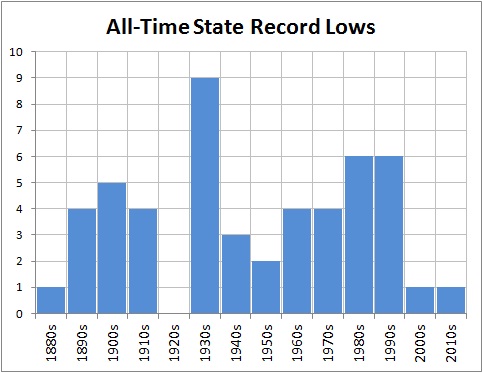
All time cold records look like this.

Enlarged
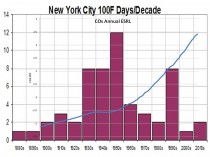
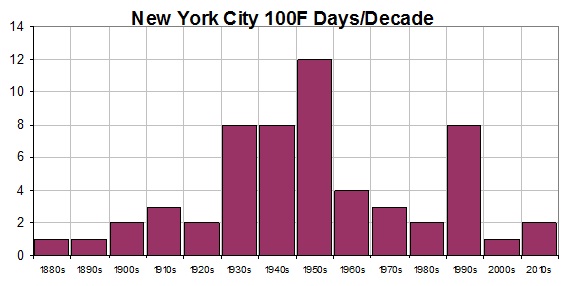
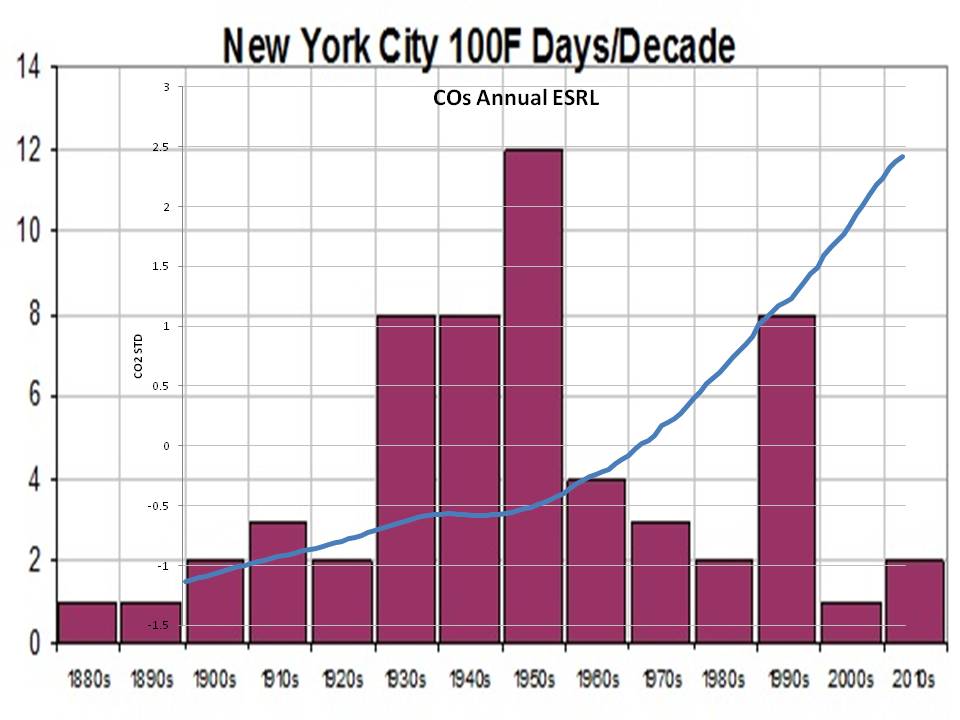
New York City reached 100F last summer, but that was common from the 1930s to 1950s.

Enlarged
Oh by the way see how the 100 degree days compares with CO2.
Here is Des Moines which has seen fewer and fewer 100F days in recent decades.
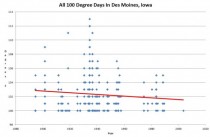
As Steve Goddard reports “During the 1930s, 100 degree days were very common in Des Moines. They very rarely happen any more. It has been nine years since Des Moines hit 100F. By contrast, 1934 had thirty-one days over 100 - including five days over 110 and three days over 112.”
The state monthly records through the end of the 2009.. This depicts the 12 monthly records for the 50 states (600 data points). There were likely March heat records set in some states and perhaps some other months so the 2010s will show and take away from some prior years.

See Bruce Hall’s 2010 guest post on Roger Pielke Sr.’s Climate Science here.
ICECAP NOTE: ICECAP was one of the earliest ‘realist’ climate blogs that provided insight into natural factors and challenged the orthodoxy. Your donations helped us maintain the site and provide some support for the time invested in keeping it updated. One or more posts have been added a day for going on 5 years now now totaling 6,082 entries. 305,205 have enrolled as members with a total of 32,446,550 page hits. All the posts are archived. We maintain them in the archives and have a good search tool. I maintain the site as best I can - maintaining a secure site with high traffic is expensive. You can help with even small donations - see the DONATE button left or email me at frostdoc@aol.com for an address to mail a check if you prefer not using PAYPAL. Rest assure, we have never had an issue with Paypal although they get a piece of any transaction. I have had at times had to subsidize the site from month to month. I don’t like having to ask people for donations but our side despite all the claims to the contrary is not subsidized/ endowed with money and grants like the alarmist blogs like RealClimaate and Climate Progress. You will never see them ask for donations. They get all they need from their liberal foundations and eco groups.
You can also help by buying books in the Amazon store and/or enrolling as a Premium member of Weatherbell.com, where I am co-chief meteorologist with Joe Bastardi. recently Dr. Ryan Maue from FSU has joined our staff and is helping us provide model based value-added output. He maintains and has published on the ACE index. We have a weather radio show on Sunday nights 8pm to 9:30pm EDT called Wise Guys of Weather Radio. On the Weatherbell site we have the premium blogs and specialized forecasts for energy, agriculture, marine, snow, insurance and other applications on the Commercial site. Joe B has also posted on Icecap. Both Icecap and Weatherbell are 7 day a week jobs. I have also PRO BONO helped produce documents for comments to the EPA that enabled lawyers to file a science based AMICUS brief that went to the DC courts to try and stop EPA deadly overregulation. Thank you for you support over the years. Joe D’Aleo and Art Horn