

NOAA
The Making of An Extreme Event: Putting the Pieces Together
Randall Dole, Martin Hoerling, Arun Kuma, Jon Eischeid, Judith Perlwitz, Xiao-Wei Quan, George Kiladis, Robert Webb, Donald Murray, Mingyue Chen, Klaus Wolter, and Tao Zhang
NOAA Earth System Research Laboratory, Boulder, Colorado, NOAA Climate Prediction Center, Camp Springs, MD, University of Colorado, Cooperative Institute for Research in Environmental Sciences, Boulder, Colorado
Abstract
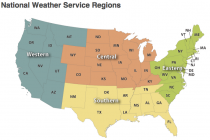
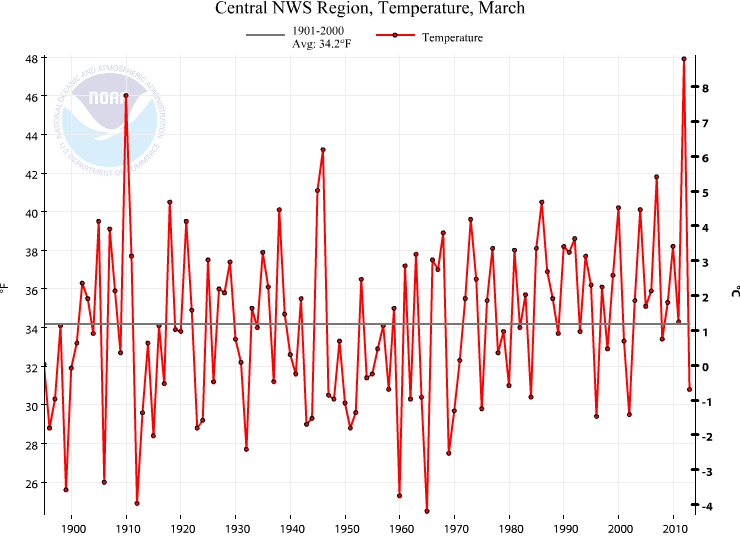
We examine how physical factors spanning climate and weather contributed to record warmth over the central and eastern U.S. in March 2012, when daily temperature anomalies at many locations exceeded 20C. Over this region, approximately 1C warming in March temperatures has occurred since 1901. This long-term regional warming is an order-of-magnitude smaller than temperature anomalies observed during the event, indicating the most of the extreme warmth must be explained by other factors. Several lines of evidence strongly implicate natural variations as the primary cause for the extreme event.
The 2012 temperature anomalies had a close analogue in an exceptionally warm U.S. March occurring over 100 years earlier, providing observational evidence that an extreme event similar to March 2012 could be produced through natural variability alone. Coupled model forecasts and simulations forced by observed sea surface temperatures (SSTs) show that forcing from anomalous SSTs increased the probability of extreme warm temperatures in March 2012 above that anticipated from the long-term warming trend. In addition, forcing associated with a strong Madden-Julian Oscillation further increased the probability for extreme U.S. warmth and provided important additional predictive information on the timing and spatial pattern of temperature anomalies.

The results indicate that the superposition of a strong natural variation similar to March 1910 on long-term warming of the magnitude observed would be sufficient to account for the record warm March 2012 U.S. temperatures. We conclude that the extreme warmth over the central and eastern U.S. in March 2012 resulted primarily from natural climate and weather variability, a substantial fraction of which was predictable.
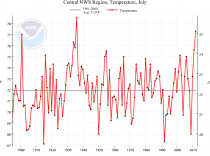
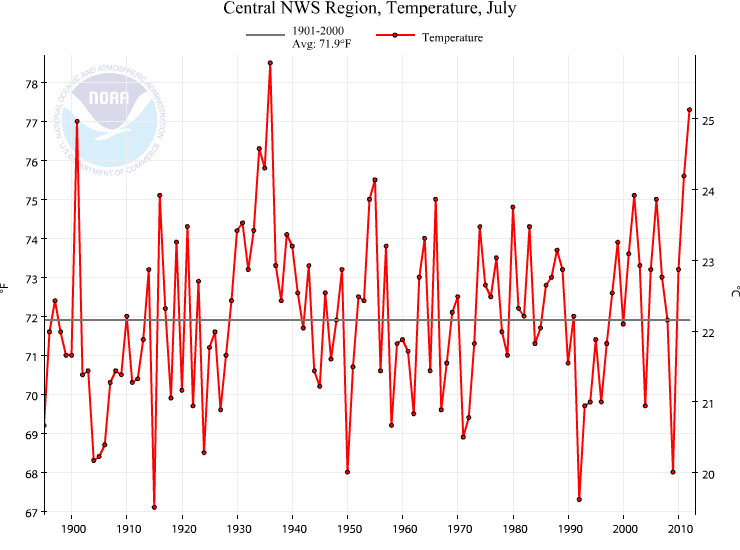
Note: like March 2012 and March 1910, July 2012 was an outlier similar to July 1934, and 1901 on the warm side and July 2009 to 1992, 1950 and 1915 on the cold side.
--------
Arctic cold and snowstorm
Joseph D’Aleo, CCM
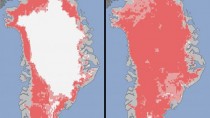
Remember a year ago when few days of July ‘warmth’ with strong blocking over Greenland had the media abuzz. Last July a brief spell of temperatures in the mid 30s had caused some surface slush formation on top of the 1 to 1.5 mile thick Greenland ice. The NASA sensors merely color-coded the phase of the water: ice (white), mixed water and ice (rose) and none (land grey). Rose meant some surface liquid. It quickly refroze in a few days even before the flurry of news stories hyping it stopped.
You can see the ice at the summit was very much still in evidence.
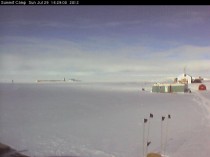
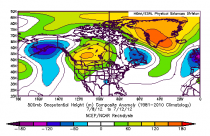
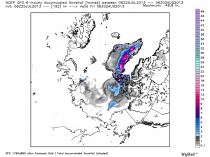
Well a year later, an interesting opposite scenario with a deep, cold arctic low is bringing snow to the arctic and Greenland in late July.
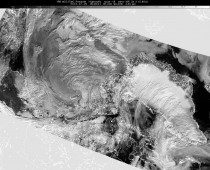
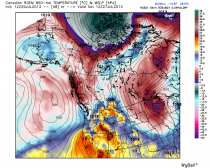
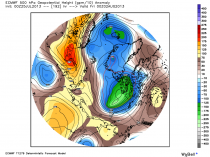
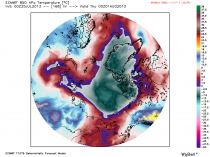
The upper low is seen at 500mb and the cold air at 850mb.
See the snow forecast the next 8 days on the arctic ice and Greenland.
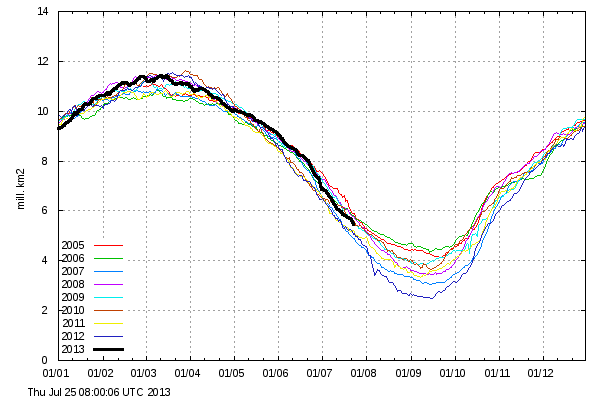
What about the arctic ice? Running well above last year and 2007. Strong polar systems with winds can move ice around and compact the ice or push it out of the arctic into the Atlantic so predictions of where we end up next month are still difficult. As I have posted, the Atlantic and Pacific Decadal Oscillations control the ice extent. We have been in modes that favored the decline of ice since 1995 which will soon change.
Arctic Sea ice extent 30% or greater (DMI) Enlarged