Jun 17, 2009
The June 23rd EPA CO2 endangerment public comment deadline looms
By Anthony Watts, Watts Up With That
The EPA on April 17, 2009 released this finding in ”Proposed Endangerment and Cause or Contribute Findings for Greenhouse Gases under the Clean Air Act”.
I just sent my comments in, and have included excerpts from them below for structure and ideas. If you have not done it yet, get your comments in. I did mine via email. Some excerpts from my commentary are listed below. You can send public comments here: ghg-endangerment-docket@epa.gov
To submit a comment, identify them with Docket ID No. EPA-HQ-OAR-2009-0171 and submit them online, by email, by facsimile, by mail or by hand delivery.
The docket # is Re: Docket ID No. EPA-HQ-OAR-2009-0171 Be sure to include that number in email. They must be received by EPA by June 23.
ADDRESSES: Submit your comments, identified by Docket ID No. EPA-HQ-OAR-2009-0171, by one of the following methods:
- Federal eRulemaking Portal: http://www.regulations.gov. Follow the online instructions for submitting comments.
- E-mail: ghg-endangerment-docket@epa.gov
- Fax: (202) 566-1741.
- Postal Mail: Environmental Protection Agency, EPA Docket Center (EPA/DC), Mailcode 6102T, Attention Docket ID No. EPA-HQ-OAR-2009-0171, 1200 Pennsylvania Avenue, NW, Washington, DC 20460.
- Hand Delivery: EPA Docket Center, Public Reading Room, EPA West Building, Room 3334, 1301 Constitution Avenue, NW, Washington, DC 20004. Such deliveries are only accepted during the Air Docket’s normal hours of operation, and special arrangements should be made for deliveries of boxed information.
Instructions: Direct your comments to Docket ID No. EPA-HQ-OAR-2009-0171. EPA’s policy is that all comments received will be included in the public docket without change and may be made available online here. including any personal information provided, unless the comment includes information claimed to be CBI or other information whose disclosure is restricted by statute. Do not submit information that you consider to be CBI or otherwise protected through http://www.regulations.gov or e-mail.
The Web site is an “anonymous access” system, which means EPA will not know your identity or contact information unless you provide it in the body of your comment. If you send an e-mail comment directly to EPA without going through http://www.regulations.gov your e-mail address will be automatically captured and included as part of the comment that is placed in the public docket and made available on the Internet. If you submit an electronic comment, EPA recommends that you include your name and other contact information in the body of your comment and with any disk or CD-ROM you submit. If EPA cannot read your comment due to technical difficulties and cannot contact you for clarification, EPA may not be able to consider your comment. Electronic files should avoid the use of special characters, any form of encryption, and be free of any defects or viruses.
This Climate Audit post can also be useful for ideas. As a guide for doing this, WUWT reader Roger Sowell has some useful guidelines that I find helpful. See Anthony’s full post here.
Icecap Note: Anthony follows in this post with his powerful comments on siting isues he has found with the surfacestations.org volunteer network effort. Icecap will be submitting a dozen comments later this week. We will post links to all of the comments after the deadline. Please send us your comments and we will provide links to them as well. This can be a handy reference for those who will be challenging the EPA on any proposed rules or regulations.
Jun 15, 2009
Suggestions of “strong negative cloud feedbacks” in a warmer climate
By Anthony Watts, Watts Up With That
Here is a pictorial showing a cross section of the ITCZ with a cumulonimbus cloud in the center.I thought this post on clouds and climate modeling below from Steve McIntyre’s Climate Audit was interesting, because it highlights the dreaded “negative feedbacks” that many climate modelers say don’t exist. Dr. Richard Lindzen highlighted the importance of negative feedback in a recent WUWT post.
One of the comments to the CA article shows the simplicity and obviousness of the existence of negative feedback in one of our most common weather events. Willis Eschenbach writes: Cloud positive feedback is one of the most foolish and anti-common sense claims of the models.
This is particularly true of cumulus and cumulonimbus, which increase with the temperature during the day, move huge amounts of energy from the surface aloft, reflect huge amounts of energy to space, and fade away and disappear at night. Spot on Willis, I couldn’t agree more. This is especially well demonstrated in the Inter Tropical Convergence Zone (ITCZ) The ITCZ has been in the news recently because early analysis of the flight path of Air France 447 suggests flying through an intense thunderstorm cell in the ITCZ may have been the fatal mistake. There is a huge amount of energy being transported into the upper atmosphere by these storms.
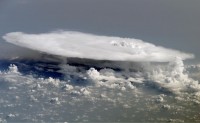
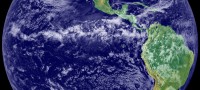
Here are some diagrams and photographs to help visualize the ITCZ heat transport process. First, here is what the ITCZ looks like from space. Note the bright band of cumulonimbus clouds from left to right.
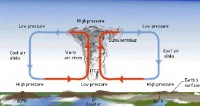
Here is showing a cross section of the ITCZ with a cumulonimbus cloud in the center.
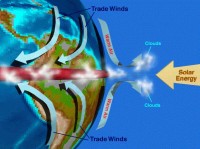
And finally, a 3D pictorial showing ITCZ circulation and heat transport. Note the cloud tops produce a bright albedo, reflecting solar radiation.
And here is the post on Climate Audit “Cloud Super-Parameterization and Low Climate Sensitivity” by Steve McIntyre on June 11th, 2009.
Jun 14, 2009
Sulfates and Global Warming
World Climate Report
Usually when we think of global warming, we are led to believe that it is caused primarily by increasing greenhouse gases. After all, that is what all the fuss is about in Washington DC these days. But is that entirely true?
After all there are lots of other things going on all the while. For instance, to what degree has the global temperature record in recent decades been influenced by the variability in aerosol emissions? This question has been the subject of a series of articles in recent years by Martin Wild and colleagues which look at the impacts of (primarily sulfate) aerosols on the earth’s climate. They typically conclude that sulfate aerosols play a larger role in multi-decadal climate fluctuations than the climate models generally give them credit for. And that models’ inability to properly handle the climate aspects of aerosols “may hamper the predictive skills of these models to project near future climate evolution.”
In their latest paper, just-appearing in the Journal of Geophysical Research, Wild and colleagues makes some interesting observations about aerosol influences on the global temperature history in recent decades and what it means for greenhouse gas-induced warming: The compensating [warming/cooling] tendencies [from aerosols] in various regions of the globe may tentatively indicate that the overall surface solar radiation signal inferred from the ground-based observations did not undergo dramatic changes since the year 2000. This fits to the general picture provided by the satellite community, which suggest that the planetary albedo as well as the background aerosol burden of the atmosphere may not have undergone substantial changes between 2000 and 2005, at least globally [Loeb et al., 2007a, 2007b; M. Mishchenko, personal communication, 2007]. This is also in line with recent Earthshine observations, which indicate a fairly stable planetary albedo after 2000 [Palle et al., 2009]. Further, air pollution control measures seem to have saturated lately in some of the industrialized regions, which may prevent further brightening in these areas [e.g., Ruckstuhl et al., 2008; D. G. Streets et al., submitted paper, 2009]. One may also speculate that the recent lack of a significant overall brightening may favor a more moderate temperature increase in the early 2000 compared to the 1990s, when brightening has more substantially added to the greenhouse-induced warming [Wild et al., 2007, 2008].
Overall global warming since the turn of the millennium may therefore be more readily attributable to the enhanced greenhouse effect, and no longer suppressed by surface solar dimming as in the period from the 1950s to 1980s or enhanced by surface solar brightening as from the 1980s to 2000. However, further investigations based on both modeling and observational approaches will be required to get more insight into the origins and impacts of the changes documented in this study. [emphasis added]
So what Wild and colleagues are saying is that 1) the observed global warming rate during the 1980s and 1990s was elevated as a result of a decreasing atmospheric aerosol burden (which led to more solar radiation reaching the surface, aka “solar brightening") - so all the talk about how fast the planet was warming up because of greenhouse gas concentration increase is a bit overblown, and 2) that since the turn of the century, the climate influence from aerosols has been relatively stable (in net) and so the true impact from increasing greenhouse gases should now be more evident. And, as readers of this blog are quite aware - there is no significant trend in global temperatures this century!
Now, we are not suggesting that this will continue indefinitely, but we are suggesting that the rate of temperature increase produced by greenhouse gas increases appears to be much less than climate models are indicating (or at least given credit for) - for the past several decades, and likely into the future.
It is high time that people start getting their heads out of their models and start looking at the observations. The picture grows clearer every day - carbon dioxide emissions have much less climate impact than advertised by those folks clamoring for their regulation. Read full post and references here.
Jun 13, 2009
The Climate Caper
By Viv Forbes, The Climate Coalition
Another book written by a senior Australian Scientist, Garth Paltridge, is about to published by the same people who published Ian Plimer’s best seller “Heaven and Earth”.

This is what the publisher has to say: “So you think the theory of disastrous climate change has been proved! You believe that scientists are united in their efforts to force the nations of the world to reduce their carbon emissions! You imagine perhaps that scientists are far too professional to overstate their case!
Maybe we should all think again. In his book The Climate Caper, with a light touch and nicely readable manner, Professor Paltridge shows that the case for action against climate change is not nearly so certain as is presented to politicians and the public. He leads us through the massive uncertainties which are inherently part of the ‘climate modelling process’; he examines the even greater uncertainties associated with economic forecasts of climatic doom; and he discusses in detail the conscious and sub-conscious forces operating to ensure that scepticism within the scientific community is kept from the public eye.
I have not yet read “The Climate Caper” but Ray Evans has, and had this to say:
“Having read the manuscript I can endorse this book without reservation. It is written by a scientist who was at the top of the scientific establishment in Australia, and who saw at first hand the intellectual corruption which went hand in hand with government funding of science “research”. “The book is written in a whimsical style, reminiscent of P G Wodehouse, and is difficult to put down.”
Emeritus Professor Garth Paltridge is an atmospheric physicist and was a Chief Research Scientist with the CSIRO Division of Atmospheric Research before taking up positions in Tasmania as Director of the Institute of Antarctic and Southern Ocean Studies and CEO of the Antarctic Cooperative Research Centre. His research ranged from the optimum design of plants to the economics of climate forecasting. He is best known internationally for work on atmospheric radiation and the theoretical basis of climate. He is a fellow of the Australian Academy of Science.
He was in industry for a while as Director of the Environmental Executive of the Institute of Petroleum. He spent various separate years overseas in postings concerned with research or research administration - in the UK, Geneva, New Mexico, Colorado and Washington D.C. In Geneva he was involved in the early development of the World Climate Program. In Washington he was with the US National Climate Program Office at the time of the establishment of the IPCC.
To order go here.
Jun 10, 2009
Canada frosts the most widespread in recent memory
By Rod Nickel, Reuters
WINNIPEG, Manitoba (Reuters) - The multiple frosts that have blanketed Western Canada in the last week are the most widespread in the top canola-growing province of Saskatchewan in at least five years, the Canola Council of Canada said on Tuesday.
Two overnight frosts last week have already resulted in some Saskatchewan farmers reseeding their canola, a Canadian variant of rapeseed, said Jim Bessel, senior agronomy specialist in the province for the industry group Canola Council. Other farmers are waiting to see growth signs that would suggest their canola plants have survived the frost, which lasted for up to five hours at a stretch. That new growth is slow to appear with generally cool temperatures holding crop development behind schedule.
“We just don’t see a lot of activity happening from a crop development perspective,” Bessel said. “(The extent of frost damage) is a really difficult one to call right now ... It’s very erratic.” In Manitoba, the frost is the worst in memory for its frequency and area covered, said Derwyn Hammond, the province’s senior agronomy specialist for the Canola Council.
“Certainly (it’s) the worst year I’ve seen,” said Hammond, who has worked for the Canola Council for 15 years. With deadlines for full canola crop insurance ranging between June 10 and 20 in Manitoba and Saskatchewan, Hammond said he expects most farmers will choose not to reseed.
Cool weather may have actually saved some of the new crop that was at such an early growing stage that it wasn’t yet vulnerable to frost, said Doon Pauly, crop specialist for the government of the western province of Alberta. “It’s the equivalent to a frost in the second or third week of May,” Pauly said. “That’s the bright side.”
The downside of the cool weather is that it has left crops in general well behind schedule, he said. The Alberta canola crop is two to three weeks behind development, Pauly said, while the Canadian Wheat Board estimated on Monday that Western Canada wheat and barley crops are at least 10 days behind.
Fields with frost damage can develop bare pockets or a thinned-down plant population that gives weeds more room to grow, said Pauly, adding that some Alberta areas reported frost as recently as Tuesday morning.
But despite frosts and cool weather, it’s too early to say if canola yields will suffer, he said. “Canola is so plastic. If the remainder of June we get good moisture and reasonable heat, the yields can recover.” Read more here.
|

