Apr 08, 2009
This Ice Shelf Global Warming Hype Leaves Me cold
Ben Sandilands writes on Crikey
Is misreporting really necessary to get the global warming message across to the masses? Or is the claimed fate of the Wilkins Ice Shelf simply a case of too good a photo opportunity to pass up, or in this case, pass off, as caused by anthropogenic climate change?
The news stories are making it sound like the snapping of the last ice bridge between one part of the crumbling shelf and its main body is a portent of doom for a warming planet. Only a small part of the Wilkins Ice Shelf is affected by this event. It is also located in the Antarctic Peninsula, which is milder and subject to higher snowfall than the main mass of the continent. The mass of ice involved is dwarfed by many larger ice shelf breakouts studied in great detail over the last 60 years in Antarctica.
It is embarrassing to see scientists and newspapers prostitute themselves in this manner. Are they that desperate to seek inclusion in the politically correct but unscientifically sound association of anything and everything with the truly serious matter of climate change?
Ice shelves are dynamic. Just as dynamic as they have been for millions of years, during glacials and interglacials. For eons before our species industrialised and inadvertently set in train the massive liberation of fossilized carbon that has changed the composition and dynamics of the atmosphere, the oceans and the land, the ice shelves were doing precisely what the Wilkins is doing today, accumulating and shedding ice.
The same mechanics drive the growth and decay of ice shelves in a range of polar and sub polar environments, some of them verging on temperate maritime climates like that experienced by the Antarctic Peninsula and others in truly brutally cold regimes like those found closer to the poles. Ice shelves are extrusions of dense ice formed where glacial flows overrun a coastline. When the outflow exceeds the rate at which the glacier can directly fragment into icebergs the glacial mass remains coherent and the surplus pushes outwards into the seas or oceans.
The natural cycle of an ice shelf is to thicken, broaden and fan outwards, until the stresses of thermal erosion by the sea below, the atmosphere above, the subtle but persistent buckling moment of tidal rising and falling, all combine to fracture and break it into thousands of ice bergs, with the largest known to persist for five or more years while drifting for thousands of kilometres.
Somewhere in the southern ocean, the bodies of Robert Falcon Scott and his men rest on such a fragment of the Ross Ice Shelf, awaiting the sea burial which was always their lot after dying there in March 1912 on their return from the South Pole, when their last camp was well away from its outermost edge. There is no doubting the reality of global warming, nor the ways in which it may affect the rate at which ice shelves form and discharge by increasing or decreasing the accumulation of snow that feeds the vast glacial deltas that flow out into the ice shelves. But the Wilkins break up displays the same spectacular process of ice shelf growth and disintegration that has been observed throughout polar exploration.
Plus a new effect, let’s call it the linear oversimplification of the global warming message regardless of the actual science. The sharp fault lines in the Wilkins break up are break points, not melt points. They would have fractured that way regardless of whether the Wilkins environment has warmed (or even cooled) by the few degrees that have been claimed for it. There is nothing new either about massive outbreaks of icebergs from ice shelf collapses. In November and early December 2006, for only the second time in 75 years, icebergs were visible on the ocean horizon from high hills near Dunedin, New Zealand. The early voyages to Australia reported icebergs in similar latitudes to Tasmania and as far north as close to the Cape of Good Hope, while in 1868, one ship reported a sighting off Cape Leeuwin in Western Australia. In 1894 an iceberg was sighted in the western southern Atlantic in Brazilian latitudes.
The real science of climate change is very complex but also convincing. Could it be that the seriousness of these issues is being undermined by an unscientific determination in some quarters to convert almost anything that happens in the natural world into an unnatural opportunity to preach a doctrine rather than a science to the general population? Tragically for the planet, the Wilkins media event serves to deflect attention from the Rudd Government’s determination to do nothing to diminish the mining of coal which results in the liberation of copious quantities of fossilized carbon which constitutes the overwhelmingly largest cause of the greenhouse gas effect in the lower atmosphere. The circus of photo opportunity, glib sanctimonious platitudes and compliant media reporting rolls on.
Apr 06, 2009
Mt. Redoubt Eruptions – What Effect If Any on the Summer? Winter?
By Joseph D’Aleo in Intellicast
Starting on March 22, a series of major eruptions have taken place from Mt. Redoubt in Alaska. The biggest exceeded 65,000 feet in height. More than a dozen eruptions as high as 60,000 have followed the first week alone. Activity may continue for weeks or months based on the volcano’s history. Climatologists may disagree on how much the recent global warming is natural or manmade but there is general agreement that volcanism constitutes a wildcard in climate, producing significant global scale cooling for at least a few years following a major eruption. However, there are some interesting seasonal and regional variations of the effects.
Oman et al (2005) and others have shown that though major volcanic eruptions seem to have their greatest cooling effect in the summer months, the location of the volcano determines whether the winters are colder or warmer over large parts of North America and Eurasia. According to their modeling, tropical region volcanoes like El Chichon and Pinatubo actually produce a warming in winter due to a tendency for a more positive North Atlantic Oscillation (NAO) and Arctic Oscillation (AO). In the positive phase of these large scale pressure oscillations, low pressure and cold air is trapped in high latitudes and the resulting more westerly jet stream winds drives milder maritime air into the continents. Oman found high latitude volcanoes like Katmai (Alaska in 1912) instead favored the negative phase of the Arctic and North Atlantic Oscillations and cold winters. In the negative phase, the jet stream winds buckled and forced cold air south from Canada into the eastern United States and west from Siberia into Europe. They also favored a cooling of middle and higher latitudes the year round of that atmosphere and a weakening of the summer monsoon in India and Africa.
In this analysis, we looked at 11 significant high latitude volcanic eruptions in Alaska, Iceland and Russia (Kamchatka) and any observed climatic effects. Here are two examples:
KATMAI/NOVARUPTA
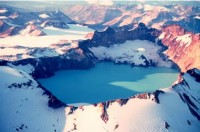
The largest eruption in the world last century (VEI=6) occurred in 1912 at Novarupta on the Alaska Peninsula. An estimated 15 to 30 cubic kilometers of magma was explosively erupted during 60 hours beginning on June 6—about 30 to 60 times the volume erupted by Mount St. Helens in 1980! The expulsion of such a large volume of magma excavated a funnel-shaped vent 2 kilometers wide and triggered the collapse of Mount Katmai volcano. Katmai was once a cluster of 3 or 4 small volcanoes. Pyroclastic flows traveled as far as 15 miles (23 km) and filled a valley adjacent to the volcano to produce the Valley of Ten Thousand Smokes. The withdrawal of magma from beneath the cluster of small volcanoes at Katmai caused the area to collapse and produce a caldera. A lake has filled part of the caldera. The summer in the lower 48 states was a cool one nearly coast to coast.
ICELAND VOLCANOS
LAKI
Laki, volcano, 2,684 ft (818 m) high, S Iceland, at SW edge of the Vatnajokull glacier. Its eruption in 1783 was one of the more devastating on record, leading to the deaths of a quarter of Iceland’s inhabitants (mainly due to a famine that resulted from the eruption’s effects). Haze from the eruption spread over parts of Europe, where some experts believe it affected the inhabitants’ health.
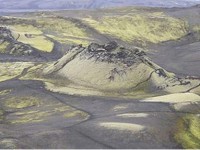
Laki is also known for its atmospheric effects. The convective eruption column of Laki carried gases to altitudes of 15 km (10 miles). These gases formed aerosols that caused cooling in the Northern Hemisphere, possibly by as much as 1 degree C. This cooling is the largest such volcanic-induced event in historic time. In Iceland, the haze lead to the loss of most of the islands livestock (by eating fluorine contaminated grass), crop failure (by acid rain) and the death of 9,000 people, one-quarter of the human residents (by famine).
This event is rated as VEI6 on the Volcanic Explosivity Index, but the eight month emission of sulfuric aerosols resulted in one of the most important climatic and socially repercussive events of the last millennium.
In Great Britain, the summer of 1783 was known as the “sand-summer” due to ash fallout. The eruption continued until 7 February 1784. Grímsvotn volcano, from which the Laki fissure extends, was also erupting at the time from 1783 until 1785. The outpouring of gases, including an estimated 8 million tons of fluorineand estimated 120 million tons of sulfur dioxide gave rise to what has since become known as the “Laki haze” across Europe. This was the equivalent of three times the total annual European industrial output in 2006, and also equivalent to a Mount Pinatubo-1991 eruption every three days. This outpouring of sulfur dioxide during unusual weather conditions caused a thick haze to spread across western Europe, resulting in many thousands of deaths throughout 1783 and the winter of 1784.This disruption then led to a most severe winter in 1784, where an estimated to have caused 8,000 additional deaths in the UK. In the spring thaw, Germany and Central Europe then reported severe flood damage.
In North America, the winter of 1784 was the longest and one of the coldest on record. It was the longest period of below-zero temperatures in New England, the largest accumulation of snow in New Jersey, and the longest freezing over of Chesapeake Bay. There was ice skating in Charleston Harbor, a huge snowstorm hit the south, the Mississippi River froze at New Orleans, and there was ice in the Gulf of Mexico.
I averaged the 10 volcano years this last century for summer and winter temperatures. This is the summer composite finding:
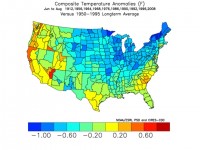
See all 11 volcanos and winter average here.
Apr 05, 2009
Fact? Or Junk Science? Are We Warming? Or Cooling?
By Frank W. Wagner, Virginia’s General Assembly
In its April 28, 1975, issue, 34 years ago, Newsweek magazine published an article titled “The Cooling World.” The article touted the “fact” that global cooling was the next great disaster to be visited upon the world. Data had been collected that indicated a great cooling trend, including shorter growing seasons and smaller crop harvests. This led some scientists to believe the Earth was entering a new ice age, the effects of which would change--or, in the worst case, destroy--human habitation.
Fast-forward to 2005: We are told global warming is the new threat to mankind. Further, we are told that human activity is the cause of this calamity; if we don’t make extreme changes--immediately--to basic human activities, the world as we know it will end. Puzzled? Me, too.
Consider this quote from the aforementioned Newsweek article. “To scientists seemingly disparate incidents represent advance signs of fundamental changes in the world’s weather. The central fact is that after three-quarters of a century of extraordinarily mild conditions, the Earth’s climate seems to be cooling down.” Then comes renowned scientist Al Gore promoting just the opposite viewpoint. The Earth is warming and catastrophe is right around the corner.
I have followed scientists on both sides of the issue, and I am convinced that no one is absolutely sure what is going on climate-wise. Activity on the sun’s surface has more to do with our planet’s climate than does any other variable. And, by the way, data are in that indicate that not only has the global climate not warmed over the past eight years, it has entered another slight cooling period.
TAKING ACTION?
Back to the 1975 article. It stated: “Climatologists are pessimistic that political leaders will take any positive action to compensate for climate change, or even to allay its effects. They concede that some of the more spectacular solutions proposed, such as melting the Arctic ice cap by covering it with black soot or diverting Arctic rivers, might create problems far greater than they solve.” Thank God for the wisdom of those political leaders. Unfortunately, many of today’s political leaders are ready to “cap-and-trade” our economy to other countries and/or apply a carbon tax in an attempt to force America to unilaterally reduce CO2 emissions. There is little doubt that either of these measures will increase the cost of energy in the U.S.
Consider excerpts from a statement by Terry M. Dinan, senior advisor at the Congressional Budget Office, on March 12 before a U.S. House of Representatives subcommittee: “Under a cap-and-trade program, firms would not ultimately bear most of the costs of the allowances but instead pass them along to their customers in the form of higher prices. “Price increases would be essential to the success of a cap-and-trade program because they would be the most important mechanism through which businesses and households would be encouraged to make investments and behavioral changes that reduced CO2 emissions. Those increases, however, would impose a larger burden, relative to their income, on low-income households than on higher-income households.” Regarding how large a new tax would be under cap-and-trade, “CBO estimates that by 2020, the value of those allowances could total between $50 billion and $300 billion annually (in 2006 dollars).” Doing the math, this translates roughly to a new tax of between $142 and $857 annually, for every man, woman, and child in this country.
The report continues: “The higher prices that would result from a cap on CO2 emissions would reduce demand for energy and energy-intensive goods and services, and thus create losses for some current investors and workers in the sectors of the economy that supply such products.” At a time when our economy is on the brink, why would any thinking person in Washington consider legislation that could aggravate a bad situation? As a policymaker who enacts legislation that has real impact on the constituents who elected me, I am not prepared to support that which would weaken an already ailing economy.
WE NEED A PLAN
It is time for us to demand that our leaders in Washington develop a comprehensive and workable national energy plan that includes not just conservation and renewable energy, but an expansion of the nuclear industry and opening up America’s vast natural resources. An energy strategy for the commonwealth was created through the Virginia Energy Plan, which I submitted and which was passed in 2006. We now spend nearly $700 billion per year to purchase fossil fuels from outside of our borders. Currently, there is no policy in Washington to address this bleeding. Imagine that this money is spent in the United States, taking advantage of America’s natural resources, employing American workers to produce American energy for American homeowners and industries.
Pass cap-and-trade legislation and it will never happen. Under cap-and-trade, major global corporations will shutter their American plants, sell their carbon credits for huge dollars (with Wall Street getting more than its fair share), and expand operations in India and other emerging economies where protecting the environment is not on the short list. The results? No reduction in global carbon output, loss of American jobs, and big bucks for Wall Street.
The furor over this crisis du jour is based, at best, on a “theory” of imminent global warming, when actual data suggest the Earth is cooling. Just like in 1975.
Apr 04, 2009
RSS and UAH Global Temperature Anomalies for March 2009
By Anthony Watts, Watts Up With That
The RSS (Remote Sensing Systems of Santa Rosa, CA) Microwave Sounder Unit (MSU) lower troposphere global temperature anomaly data for March 2009 (larger image here) was published today and has dropped for the second month after peaking in January. The change from February with a value of 0.230C to March’s 0.172C is a (∆T) of -0.058C.
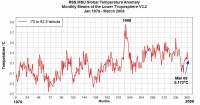
Like RSS, UAH was also announced today, on the blog of Dr. Roy Spencer here who is co-curator of the data with Dr. John Christy at the University of Alabama, Huntsville. See below (larger image here).
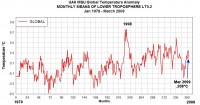
It showed a significant drop, more than double that of RSS. The change from February with a value of 0.347C to March’s 0.208C is a (∆T) of -0.139C. Oddly, a divergence developed in the Feb 09 data between RSS and UAH, and opposite in direction to boot.
I spoke with Dr. Roy Spencer at the ICCC09 conference (3/10) and asked him about the data divergence. Here is what he had to say: “I believe it has to do with the differences in how diurnal variation is tracked and adjusted for.” he said. I noted that Feburary was a month with large diurnal variations. For that reason, UAH has been using data from the AQUA satellite MSU, and RSS to my knowledge does not, and makes an adjustment to account for it. I believe our data [UAH] is probably closer to the true anomaly temperature, and if I’m right, we’ll see the two datasets converge again when the diurnal variations are minimized.” Looks like the data sets are converging now. Read more and see what impact the big spike in 1998 had on the trend here.
See Bob Tisdale’s ocean sea surface temperature anomaly update here. Note the cooling of the Atlantic (AMO) which together with a cold PDO and a sun in slumber should lead to a decline in global temperatures in the months ahead.
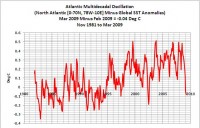
This together with a cold PDO and a sun in slumber should lead to a decline in global temperatures in the months ahead as we saw in the middle 20th century.
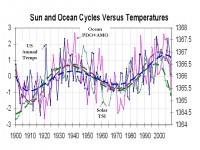
See larger image here.
Apr 04, 2009
Global Warming: A Classic Case of Alarmism
This is a Guest Post by Dr David Evans on Joanne Nova’s site

The big temperature picture. Graph and insight from Dr Syun Akasofu
(2009 International Conference on Climate Change, New York, March 2009).
The global temperature has been rising at a steady trend rate of 0.5C per century since the end of the little ice age in the 1700s (when the Thames River would freeze over every winter). On top of the trend are oscillations that last about thirty years in each direction:
1882 - 1910 Cooling
1910 - 1944 Warming
1944 - 1975 Cooling
1975 - 2001 Warming
In 2009 we are where the green arrow points, with temperature leveling off. The pattern suggests that the world has entered a period of slight cooling until about 2030.
There was a cooling scare in the early 1970s at the end of the last cooling phase. The current global warming alarm is based on the last warming oscillation, from 1975 to 2001. The IPCC predictions simply extrapolated the last warming as if it would last forever, a textbook case of alarmism. However the last warming period ended after the usual thirty years or so, and the global temperature is now definitely tracking below the IPCC predictions.
The IPCC blames human emissions of carbon dioxide for the last warming. But by general consensus human emissions of carbon dioxide have only been large enough to be significant since 1940 - yet the warming trend was in place for well over a century before that. And there was a cooling period from 1940 to 1975, despite human emissions of carbon dioxide. And there has been no warming since 2001, despite record human emissions of carbon dioxide.
There is no actual evidence that carbon dioxide emissions are causing global warming. Note that computer models are just concatenations of calculations you could do on a hand-held calculator, so they are theoretical and cannot be part of any evidence. Although the models contain some well-established science, they also contain a myriad of implicit and explicit assumptions, guesses, and gross approximations—mistakes in any of which can invalidate the model outputs. The pattern suggests that the world has entered a period of slight cooling until about 2030
Furthermore, the missing hotspot in the atmospheric warming pattern observed during the last warming period proves that (1) the IPCC climate theory is fundamentally broken, and (2) to the extent that their theory correctly predicts the warming signature of increased carbon dioxide, we know that carbon dioxide definitely did not cause the recent warming (see here for my full explanation of the missing signature. The alarmists keep very quiet about the missing hotspot.
No one knows for sure what caused the little ice age or for how many more centuries the slow warming trend will continue. It has been warmer than the present for much of the 10 thousand years since the last big ice age: it was a little warmer for a few centuries in the medieval warm period around 1100 (when Greenland was settled for grazing) and also during the Roman-Climate Optimum at the time of the Roman Empire (when grapes grew in Scotland), and at least 1°C warmer for much of the Holocene Climate Optimum (4 to 8 thousand years ago).
Addendum
Measuring the global temperature is only reliably done by satellites, which circle the world 24/7 measuring the temperature over large swathes of land and ocean. But satellite temperature records only go back to 1979. Before that, the further back you go the more unreliable the temperature record gets. We have decent land thermometer records back to 1880, and some thermometer records back to the middle of the 1700s. Prior to that we rely on temperature proxies, such as ice cores, tree rings, ocean sediments, or snow lines. Read post here. The powerpoint and audio from Dr Akasofu’s presentation at The International Climate Change Conference 2009 can be downloaded here.
|


