|
Apr 14, 2008
Cold Temperatures Freeze Gardening Season
By Mark Geary, Reporter KCRG-TV, Cedar Rapids, IA
All of this cold weather is freezing the start of the gardening season. Now, outdoor fans are eager for a warm-up. “I’m 71-years-old and I’ve never seen spring come this late,” Robert Ciesleck said. Ciesleck and his family look forward to gardening together every spring. This year, they’re not sure when they’re going to be able to get their hands dirty. “When it starts getting into mid-March and April, then things should change fast, but not this year,” he said.
On a typical Sunday afternoon, the Culver’s greenhouse would be packed with people, but the recent cold temperatures scared away a lot of customers. “All the plants are right here. All you can do is come and look for now. I’d hate to take any home quite yet, but it’s getting really tempting,” customer Rhonda Kaczinski said. Cold temperatures aren’t the only problem. This winter’s snow and ice storms drenched the soil and left it soggy. If you can pick up a handful of soil and still wring moisture out of it, it’s too wet to plant,” Culver’s employee Sherri Baldonado said. Even though it might be too cold for flowers to take root, Culver’s employees recommend buying plants now and storing them in a warm place like a garage. Read more here.
Icecap Note: To put in into perspective, Cedar Rapids and the surrounding Midwest has been consistently colder than normal since December. In Cedar Rapids, December averaged 3.0 F below normal, January 1.9 F below normal, February a whopping 8.3 F below normal, March 4.9 F below normal and so far in April 4.4 degrees below normal.
Apr 13, 2008
Exposing the Climate Change Agenda
By Dr Muriel Newman, NZ Centre For Political Research
The climate change debate is forever shifting as science casts long shadows of doubt on the predictions of global catastrophe. The debate gathered a world-wide audience when climate alarmists gained control of the climate science agenda. Its popularisation has given it a political momentum that is proving difficult to halt. At first the alarmists tried to scare us with those exaggerated claims that man-made greenhouse gas emissions were causing the earth’s temperature to rise. They said there was a direct causal relationship between industrialisation (and therefore CO2 emissions) and global temperatures, and that link was so serious that mankind would bring about its own demise if immediate action were not taken.
These prophets of doom initially ignored the fact that while concentrations of man-made greenhouse gases have continued to rise, global temperatures stopped rising ten years ago. However, with the growing weight of scientific data now indicating the globe could be cooling, not warming, the alarmists are now talking of a ‘climate change’ crisis. They have broadened their rhetoric to accommodate all forms of extreme weather change - in order to hedge their bets!
When will these alarmists stop, you might well ask? My answer is they won’t. Those promoting the global warming cause will adapt their reasoning in whatever way is necessary to remain credible in the eyes of the public. Let’s not forget there are powerful vested interests benefiting from global warming alarmism with vast profit opportunities and political reputations at stake. They will hang on as long as a gullible public allows them to.
And big money there is. All around the world, carbon offset schemes - any of extremely dubious quality - are growing like topsy. Companies like Al Gore’s Generation Investment Management, which makes money from investing in “sustainable” businesses, now has $5 billion in funds under management, according to the New York Times. The runaway success of his movie “An Inconvenient Truth” would have done the inflow of money into that fund no harm at all!
Professor Bob Carter, an environmental scientist at Queensland’s James Cook University is presently in New Zealand on a lecture tour. He suggested “The roughly 50 computer experts and scientists who form the core advisory group for the IPCC’s stance must have realized for several years now that the game was up. There is indeed copious evidence that climate is changing, as it always has; and that natural biological and physico-chemical systems - again as always - are changing in response. But as to human causation - the evidential cupboard is bare. “For the last three years, satellite-measured average global temperature has been declining. Given the occurrence also of record low winter temperatures and massive snowfalls across both hemispheres this year, IPCC members have now entered panic mode, the whites of their eyes being clearly visible as they seek to defend their now unsustainable hypothesis of dangerous, human-caused global warming”. Read more here.
Apr 12, 2008
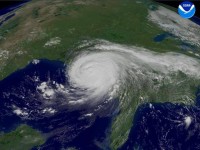
Hurricane Expert Reconsiders Global Warming’s Impact
By Eric Berger, Houston Chronicle
One of the most influential scientists behind the theory that global warming has intensified recent hurricane activity says he will reconsider his stand. The hurricane expert, Kerry Emanuel of the Massachusetts Institute of Technology, this week unveiled a novel technique for predicting hurricane activity. The new work suggests that, even in a dramatically warming world, hurricane frequency and intensity may not substantially rise during the next two centuries.
The research, appearing in the March issue of Bulletin of the American Meteorological Society, is all the more remarkable coming from Emanuel, a highly visible leader in his field and long an ardent proponent of a link between global warming and much stronger hurricanes. His changing views could influence other scientists. “The results surprised me,” Emanuel said of his work, adding that global warming may still play a role in raising the intensity of hurricanes but what that role is remains far from certain. Emanuel’s work uses a new method of computer modeling that did a reasonable job of simulating past hurricane fluctuations. He, therefore, believes the models may have predictive value for future activity. Read more here.
Apr 11, 2008
Geologist: Sun’s Shift Could Mean Global Chill
By John Stark, The Bellingham Herald
Fluctuations in solar radiation could mean colder weather in the decades ahead, despite all the talk about global warming, retired Western Washington University geologist Don Easterbrook said Tuesday. Easterbrook is convinced that the threat of global warming from mankind’s carbon dioxide pollution is overblown. In a campus lecture, he cited centuries of climate data in an effort to convince a somewhat skeptical audience that carbon dioxide’s impact on climate is being much exaggerated by former U.S. Vice President Al Gore and by scientists who appear to have won the debate over global warming.
“Despite all you hear about the debate being over, the debate is just starting,” Easterbrook said. Easterbrook doesn’t deny that the Earth’s climate has been warming slowly since about 1980. But he argued that this warming trend fits a longstanding pattern of warming and cooling cycles that last roughly 30 years. Sunspot activity and other solar changes appear to explain the 30-year cycles, he said. If that pattern persists, the earth could now be close to the next 30-year cooling cycle, Easterbrook said.
NASS extreme ultraviolet solar view - still quiet almost 12 years now since last solar minimum
He noted that the 2007-08 winter set records for cold and snow in many parts of the globe. According to the data he displayed, the Earth’s temperature hit a peak in 1998 and has been steady or slightly cooler since then. “One cold winter doesn’t mean much of anything,” he said. “A 10-year trend is interesting.” Read more here.
Dr. Don J. Easterbrook, Professor Emeritus Geology, Western Washington University, author of 8 books, 150 journal publications with focus on geomorphology; glacial geology; Pleistocene geochronology; environmental and engineering geology
Apr 11, 2008
Is the Causal Link Between Cosmic Rays and Cloud Cover Really Dead??
By Nir Shaviv, Science Bits
Just recently, Sloan and Wolfendale published a paper in Environmental Research Letters, called “Testing the proposed causal link between cosmic rays and cloud cover”. In the Institute of Physics Press Release, it said, “New research has deal a blow to the skeptics who argue that climate change is all due to cosmic rays rather than man made greenhouse gases”. Did it really? First, we should note that so called “skeptics” like myself or my serious colleagues never claimed that cosmic rays explain all the climate change, it does however explain most of the solar-climate link and a large fraction (perhaps 2/3’s of the temperature increase over the 20th century).
Now for the paper itself. Sloan and Wolfendale raise three points in their analysis. Although I certainly respect the authors (Arnold Wolfendale is very well known for his contributions to the subjects of cosmic rays and high energy astrophysics, he was even the astronomer royal, and for good reasons), their present critique rests on several faulty assumptions. Here I explain why each of the three arguments raised cannot be used to discredit the cosmic-ray/climate link.
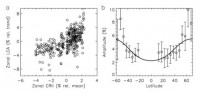
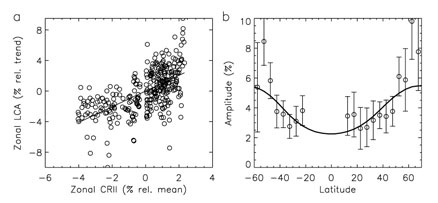
(From Usoskin et al. 2004). See large image here. The observed latitudinal variation in the cloud cover as a function of the magnetic latitude (right) or as a function of the atmospheric ionization variations (left). The graphs clearly demonstrate that the cloud cover varies as expected from the ionization variations.
Sloan and Wolfendale raised three critiques which supposedly discredit the CRF/climate link. A careful check, however, reveals that the arguments are inconsistent with the real expectations from the link. Two arguments are based on the expectation for effects which are much larger than should actually be present. In the third argument, they expect to see no phase lag, where one should actually be present. When carefully considering the link, Sloan and Wolfendale did not raise any argument which bares any implications to the validity or invalidity of the link.
One last point. Although many in the climate community try to do their best to disregard the evidence, there is a large solar-climate link, whether on the 11-year solar cycle (e.g., global temperature variations of 0.1C), or on longer time scales. Currently, the cosmic-ray climate link is the only known mechanism which can explain the large size of the link, not to mention that independent CRF variations were shown to have climatic effects as well. As James Whitcomb Riley supposedly once said: “If it walks like a duck and quacks like a duck, I would call it a duck”. Read the detailed Shaviv reply to the Sloan and Wlfendale points here.
|
|
|
|

