|
Jan 09, 2008
Our Global Warming ‘Animal Farm’
By Ed Iverson, Lahonton Valley News
In one of his incomparable essays, C. S. Lewis criticized man’s often insolent determination to control the forces of nature. He remarked that man’s control of nature was frequently nothing more than man’s control over other men - with nature as the instrument. Nothing explains the mad obsession with global warming quite so pointedly. It is becoming increasingly obvious that the global warming panic has little to do with temperature change and everything to do with man’s control of other men with climate as the instrument.
The global warming hoax is a dream come true for the global bullies intent on imposing their repressive regulatory regime upon a willing world of useful idiots. With an ozone hole here and a stranded polar bear there, here an oink there an oink, everywhere an oink, oink, Old Napoleon Gore had a farm; and pretty soon all the animals were explaining to themselves why the rules were constantly changing to advance the agenda of the swine who had assumed control in the house. The “chosen” go to Bali. The rest of us schmucks go meekly to our secure stalls in the barn. As the self-appointed dungeon masters softly close the iron gates, the plastic faces in Hollywood form a cheering chorus line. As we labor under increasingly onerous regulations, faint-hearted academics fearful of losing their grants gravely announce the absolute necessity of the new rules.
There are signs, however, that the tide is running out for popular support of Napoleon Gore’s contrived crisis. Read more here.
Jan 04, 2008
Global Warming Articles Need Data
By Michael F. Farona, the Ledger
Cal Thomas’ editorial column, “Warming Is Gospel to Secular Fundamentalists,” prompts this column as a follow-up. In my area of expertise (chemistry), review articles on various subjects contain considerable data to educate and convince the reader that conclusions are justified. This is not so with the many review articles and books I have read on global warming.
Data, numbers, graphs, trends, etc., are generally missing in supposedly scientific reports on global warming. These articles are usually long on opinions and short on hard data. Phrases such as “scientists agree that ...” scientists doubt that ...” do not belong in a scientific article. There are more data in Michael Crichton’s novel “State of Fear” than in all the global warming articles combined that I have read. What puzzles me is the reluctance of climatologists to provide scientific data supporting their dire predictions of the near future if we don’t change our ways. I will continue to read on this subject until I am convinced that the terrible predictions have some merit.
I should point out that I have no ax to grind. My interest has been to educate myself on global warming. Instead, I am left in a state of frustration because so many questions remain unanswered. Read full opinion here.
Michael F. Farona of Haines City is professor of chemistry, emeritus, for the University of Akron and the University of North Carolina at Greensboro
Jan 03, 2008
A Cold Spell Soon to Replace Global Warming
By Oleg Sorokhtin for RIA Novosti
Stock up on fur coats and felt boots! This is my paradoxical advice to the warm world.
Earth is now at the peak of one of its passing warm spells. It started in the 17th century when there was no industrial influence on the climate to speak of and no such thing as the hothouse effect. The current warming is evidently a natural process and utterly independent of hothouse gases.
The real reasons for climate changes are uneven solar radiation, terrestrial precession (that is, axis gyration), instability of oceanic currents, regular salinity fluctuations of the Arctic Ocean surface waters, etc. There is another, principal reason-solar activity and luminosity. The greater they are the warmer is our climate. Astrophysics knows two solar activity cycles, of 11 and 200 years. Both are caused by changes in the radius and area of the irradiating solar surface. The latest data, obtained by Habibullah Abdusamatov, head of the Pulkovo Observatory space research laboratory, say that Earth has passed the peak of its warmer period, and a fairly cold spell will set in quite soon, by 2012. Real cold will come when solar activity reaches its minimum, by 2041, and will last for 50-60 years or even longer.
Carbon dioxide cannot be bad for the climate. On the contrary, it is food for plants, and so is beneficial to life on Earth. Bearing out this point was the Green Revolution - the phenomenal global increase in farm yields in the mid-20th century. Numerous experiments also prove a direct proportion between harvest and carbon dioxide concentration in the air. Carbon dioxide is not to blame for global climate change. Solar activity is many times more powerful than the energy produced by the whole of humankind. Man’s influence on nature is a drop in the ocean.
Dr. Oleg Sorokhtin, Merited Scientist of Russia and fellow of the Russian Academy of Natural Sciences, is staff researcher of the Oceanology Institute.
Jan 03, 2008
Highest December Southern Oscillation Index Since 1975
By Eugenio Hackbart, METSUL Weather Center, Brazil
The Australian Bureau of Meteorology released today the December value for the Southern Oscillation Index, one of the most important indicators of the Pacific Ocean conditions. The oscillation is calculated from the monthly or seasonal fluctuations in the air pressure difference between Tahiti and Darwin. Positive values are associated with stronger Pacific trade winds and La Nina episodes. Waters in the central and eastern tropical Pacific Ocean become colder while near Australia they are warmer. The December value released by BoM today for December 2007 was +14.4. This is the highest December SOI value since 1975, an indication of the strength of the ongoing Pacific cold event. It also figures among the top ten positive values for the SOI in December.
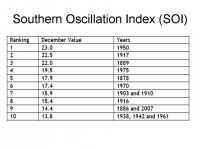
See full size image here.
Read what Eugenio believes that may mean for January and February in the United States here.
Dec 31, 2007
Snowy December Places
By Joseph D’Aleo, CCM
It was a near record or even record snowy December in parts of the central and northeastern United States. Boston received a little under an inch of new snow making this the second snowiest December in the cities snowfall history which extends back to 1890. The total of 27.7 inches fell just 0.2 behind the record of 27.9 set in 1970. December’s snowfall at Concord, N.H., totaled 44.5 inches, toppling a record of 43 inches that had stood since 1876. Burlington, Vt., got 45.7 inches, far above its 17.2-inch December average, and Portland, Maine, amassed 37.7 inches for its third-snowiest December on record.
In Madison and Milwaukee, Wisconsin too, 2007 was the second snowiest December. For Madison, the total fell just 1.6 inches shy of the record of 35 inches set in 2000. Records in both locations extend back into the 1880s. Just to the south in Rockford, Illinois, it was the 7th snowiest December. The snowiest there too was in 2000.
Kansas was also unusually snowy. Topeka was another second snowiest city with its total of 16.6 inches falling behind only 1983. In Dodge City which has records back to 1871, it ended up the 4th snowiest. 1918 was the snowiest there. In Wichita, Kansas it was the 5th snowiest December.
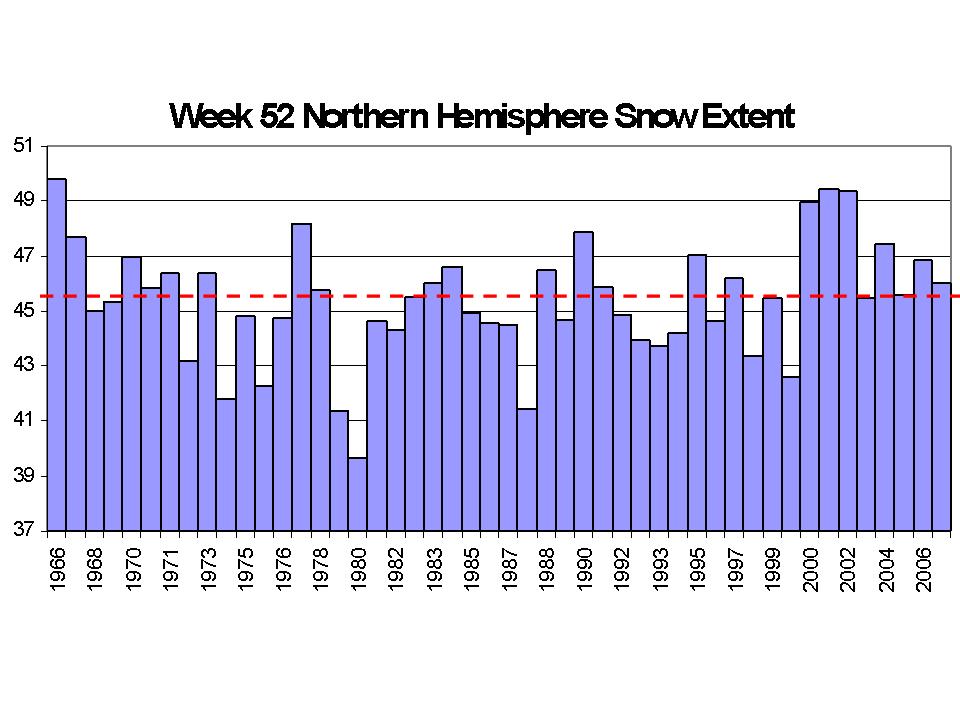
Notice in the following graph of week 52 snowcover for the northern hemisphere, each year since 2000 has been above the average.
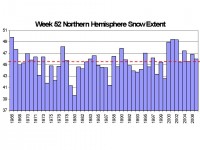
Week 52 of the Year Snowcover extent courtesy of the Rutger’s Snow Lab. See full size image here.
After a frigid start with arctic air across the northern tier dominating, the lack of arctic air late in the month eroded the large deficits that had developed across the north and cental and at months end, the negative anomalies were down to just a few degrees, mainly in the areas where snowfall was heaviest in the plains, western Lakes and northeast. It ended up above normal in the southeast and northern Rockies.
|
|
|
|

