Oct 06, 2007
Prominent BBC Naturalist Joins Skeptics: ‘Our Climate Has Always Changed’
By Michael Deacon, UK Telegraph
One subject gets Titchmarsh more worked up than accusations of blandness, though. Perhaps, coming from a man who loves nature, it’s a slightly surprising one: our obsession with global warming.
‘I wish we could grow up about it,’ he says. ‘I’m sure we are contributing to global warming, and we must do all we can to reduce that, but our climate has always changed. The Romans had vineyards in Yorkshire. We’re all on this bandwagon of ‘Ban the 4x4 in Fulham’. Why didn’t we have global warming during the Industrial Revolution? In those days you couldn’t have seen across the street for all the carbon emissions and the crap coming out of the chimneys.’ He pauses for breath, then smiles. ‘Sorry, bit of a tirade there.’
Surely he worries that global warming may threaten some of the species in his series. But this doesn’t seem to bother him too much. ‘We’ll lose some, we’ll gain others,’ he says. ‘Wildlife is remarkably tenacious. Nature always copes.’

Alan Titchmarsh, UK Naturalist
Oct 03, 2007
Scientific Consensus on Man-Made Ozone Hole May Be Coming Apart
Nature
As the world marks 20 years since the introduction of the Montreal Protocol to protect the ozone layer, Nature has learned of experimental data that threaten to shatter established theories of ozone chemistry. If the data are right, scientists will have to rethink their understanding of how ozone holes are formed and how that relates to climate change.
Markus Rex, an atmosphere scientist at the Alfred Wegener Institute of Polar and Marine Research in Potsdam, Germany, did a double-take when he saw new data for the break-down rate of a crucial molecule, dichlorine peroxide (Cl2O2). The rate of photolysis (light-activated splitting) of this molecule reported by chemists at NASA’s Jet Propulsion Laboratory in Pasadena, California1, was extremely low in the wavelengths available in the stratosphere - almost an order of magnitude lower than the currently accepted rate.
“This must have far-reaching consequences,” Rex says. “If the measurements are correct we can basically no longer say we understand how ozone holes come into being.” What effect the results have on projections of the speed or extent of ozone depletion remains unclear.
Other groups have yet to confirm the new photolysis rate, but the conundrum is already causing much debate and uncertainty in the ozone research community. “Our understanding of chloride chemistry has really been blown apart,” says John Crowley, an ozone researcher at the Max Planck Institute of Chemistry in Mainz, Germany.
“Until recently everything looked like it fitted nicely,” agrees Neil Harris, an atmosphere scientist who heads the European Ozone Research Coordinating Unit at the University of Cambridge, UK. “Now suddenly it’s like a plank has been pulled out of a bridge.” Post is here.
Oct 02, 2007
A Challenge to the Carbon Dioxide / Global Warming Connection
By Jules Kalbfeld
One issue that seems to have been lost or avoided in the debate over the connection between atmospheric carbon dioxide (CO2) and global warming is the miniscule mass of CO2 that is being blamed for so many past, present and predicted natural disasters. The mass of atmospheric CO2 is extremely small when compared to the total mass of the Earth’s atmosphere and even smaller when compared to the combined masses of the land and water features on the Earth’s surface as well.
The directly proportional relationship that exists between the mass of any object and its heat capacity is essentially axiomatic: all other factors being the same, the larger the mass of an object, the greater its ability to capture, store, transport and release heat. Since the concentration of CO2 in the Earth’s atmosphere is so small, the notion that it is causing global warming seems to ignore this basic truth.
This discussion illustrates how the connection between global warming and the tiny mass of CO2 in the Earth’s atmosphere has been exaggerated. The challenge, expressed here, simply asks the proponents of CO2 induced global warming to reconcile their theories with classical scientific principles and established physical data.
See paper here.
Sep 24, 2007
Dr. William Gray’s Response to Trenberth’s Op Ed “Clarity Emerging on Hurricanes?”
By Dr. William Gray
The September 14, 2007 Op Ed piece “Clarity Emerging on Hurricanes” by Kevin Trenberth may have been timed to coincide with the congressional Senate hearing on hurricanes and climate change scheduled in the Dirksen Building on 19 Sept ‘07.
Trenberth’s central theme of emerging clarity on hurricane and climate change is, in my view, totally bogus as was his Scientific American article of July 2007 saying how hurricanes will change in the future. This article was very one sided and factually wrong in many places. It appears not to have been peer reviewed.
There is absolutely no clarity emerging on the question of human influence on hurricanes and hurricane changes associated with climate change. This dichotomy between the group of researchers saying that humans are likely influencing hurricanes (Trenberth is of this group) and the many others of us saying there is no solid evidence or physical basis for such a linkage is widening, not converging. Most of those believing that humans are affecting hurricanes have a vested interest that their views be accepted. Most of us skeptics do not.
The papers Trenberth cites in his Op Ed as backing a growing clarity on this topic have major flaws and are likely not accepted by most of us who are skeptical of significant human influences on hurricanes. There is no reliable evidence that Atlantic basin (or global) hurricane activity shows changes over the last century beyond the changes brought about by the oscillating Atlantic Ocean thermohaline circulation which appears to be driven by salinity changes. United States landfalling hurricane numbers (the most reliable long-term data we have) show a small decrease over the last century. This is particularly noticeable in US landfalling major (Cat 3-4-5) hurricanes. In the 41 year period between 1925-1965 there were 39 US landfalling major hurricanes. In the last 41 year period of 1966-2006 when global CO2 amounts were rising there were only 22 such US major hurricane landfalls. How can anyone honestly conclude that long term Atlantic hurricane activity is increasing?
Sep 23, 2007
Next Solar Cycle Late and Likely to be a Dud - the Implications
By Joe D’Aleo, ICECAP on paper by Clilverd et al. in GRL
In our All About Climate we talk about the solar cycle (soon to be updated in a paper to be published by the Fraser Institute) and using empirical methods to predict the solar and the likely results. We recently featured numerous papers that addressed this issue including this and this.
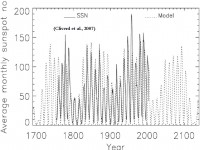
The current solar cycle is the longest since the early part of the 20th century. Solar minimum has yet to be reached, indeed there have been no signs yet of the start of cycle 24. In this paper in 2006 in the GRL, Clilverd et al. used a model for sunspot number using low-frequency solar oscillations, with periods 22, 53, 88, 106, 213, and 420 years modulating the 11-year Schwabe cycle, to predict the peak sunspot number of cycle 24 and for future cycles, including the period around 2100 A.D. The good hindcasting results suggest this methodology has promise and that weaker and colder solar cycles are in our future the next few decades. They expect cycles 24 and 25 will have peak sunspot levels between 40 and 50 (cycle 23 which peaked in 2000, had a peak of 120, cycles 21 and 22 peaked near 160). Low sunspot cycles of long length tend to bring about widespread global cooling.