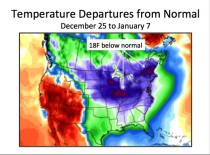
The arctic air that has frozen the northeastern U.S. over the first weeks of 2018 has prompted New Englanders to crank up the heat and New England’s utility companies to scramble for fuel.
This season’s above-average heating and electricity demand has tested grid reliability at a time when the topic has had particular political salience. Most reporting on the matter has lauded the resilience the grid has shown, but a fuel-security analysis performed by the group that oversees New England’s power system delivers a pessimistic chill. ISO New England’s analysis reveals that in winters to come fuel insecurity will plague the region.
Insecurity despite abundance
What makes ISO New England’s report so tragic is that the United States is now a veritable world energy superpower.
Ten years ago, concerns about energy prices and fuel security were a standard element of the national zeitgeist. But a decade removed from the oil price peak of $147 per barrel in July 2008, our national concern over resource depletion has been rendered moot. Spurred by the high prices of the mid-2000s, American companies embarked upon nothing less than a domestic energy renaissance. Since 2005, oil production in the United States has increased by 50 percent, oil exports have seen a tenfold increase, and oil imports have fallen by a quarter.
More critically for electricity, however, have been the gains made on the concomitant natural gas front. Natural gas production has soared over the past decade by 50 percent and in late 2017 the United States became a net-natural gas exporter - meaning that America now sells more to foreign countries than it buys from them.
Given the positive developments that have left markets awash with energy resources, one would expect American utility companies would be well-positioned to meet the needs of their customers. Instead we are now being warned by ISO New England that in future winters utilities will be unable to meet demand during bouts of frigid weather. The group’s projections in almost every future scenario forecast the implementation of rolling blackouts - the sequential disconnection of blocks of customers from power - to protect the grid from outright disaster.
Though the resources are close at hand, a combination of laws and regulations has made New England dependent upon natural gas, yet unable to access all that it needs. While the presence of natural gas in New England’s electricity fuel mix has grown from 18 percent in 2000 to 45 percent in 2017 to an anticipated 56 percent in 2025, New England’s ability to receive natural gas has not kept pace.
Pipeline paucity
On Jan. 23, ISO New England CEO Gordon van Welie testified before the Senate Energy and Natural Resources Committee that, “when it gets cold the region does not have sufficient gas infrastructure to meet demand for both home heating and power generation.” It is a theme van Welie has conveyed since at least 2013. The pipeline constraints to which he points have at times caused New England to have the most expensive spot natural gas prices in the world - including this January.
At the barricade preventing the transport of gas from the abundant reservoirs of Pennsylvania and West Virginia to New England is the state government of New York. Cursed by geographic happenstance, New England needs New York’s consent to receive gas from the Marcellus Shale. But New York politicians and regulators headed by Gov. Andrew Cuomo refuse to grant it whenever possible. In addition to a hydraulic fracturing ban, New York politicians have put the brakes on pipeline projects through their permitting power, blocking the Constitution and Northern Access pipelines outright.
New England, for its part, is not much better. In the summer of 2017 the Massachusetts Supreme Judicial Court nixed a pipeline cost-sharing proposal that would have helped to reduce stress on the grid during a harsh winter like New England is experiencing now. The hostility to pipelines is so pervasive in the northeast that ISO New England takes that bleak view that “no new incremental gas infrastructure will be built to serve power generation.”
The Jones Act
With state governments blocking new pipeline construction to bring in affordable shale gas, New England buys liquefied natural gas (LNG) transported by sea.
Since the United States is now an LNG exporter, New England would seem to have a reliable option. But domestic shipping of LNG is made impossible by the obtuse Merchant Marine Act of 1920 - commonly called the Jones Act. The Jones Act mandates that only American-built, -owned, -crewed and -flagged vessels can participate in maritime shipping between domestic ports.
The alleged purpose of the Jones Act is to improve national defense. While that may have made sense to lawmakers with the specter of German U-boats fresh in their memories, the Jones Act’s only effect today is that it drives up prices for consumers and protects a special interest group.
The Congressional Research Service has found that the Jones Act results in American vessels operating at twice the cost of comparable foreign ships. There are no Jones Act-compliant LNG ships at this time and New England therefore contracts with importers from around the Atlantic. While Trinidad and Tobago is the largest supplier, this month the Everett LNG import terminal is due to receive Russian gas produced by Yamal LNG, a facility subject to U.S. financial sanctions.
The cold truth
In 2013, van Welie sounded the alarm, informing the Senate that New England was becoming more reliant on natural gas for power generation without investing in natural gas supply infrastructure. Sadly, ISO New England’s message has gone unheeded and insidious laws and regulations continue to harm the region. The result is that despite unprecedented domestic energy production, New Englanders will soon find themselves out in the cold.
Jordan McGillis is a policy analyst at the Institute for Energy Research, a nonprofit focused on free-market energy and environmental research and policy.
Michael Crichton on “States of Fear: Science or Politics?”
-------------------------
Recently several of my posts on the subject of climate change - - including one last week titled ”In Climate Science, Predictions Are Hard, Especially About The Future” - - have attracted large numbers of comments. Most of the comments have been supportive, but many have been critical—which is not surprising. Among the critical comments, several of the most thoughtful have raised similar questions, that go something like this: If there is really nothing to this global warming scare, then how and why have so many people calling themselves climate scientists gotten together to conspire to promote this story to the public? After all, how would such a conspiracy even work? Do hundreds of them hold clandestine meetings where they recognize each other with some kind of secret handshake?
As examples of relatively balanced comments raising this point, there are two from a guy named Steven Wangsness. Excerpts:
What I want to know is why 95 percent or more of the world’s climate scientists, most of whom drive gasoline-driven cars and probably own oil stocks in their 401Ks and IRAs, are engaged in a massive, world-wide conspiracy to push the idea of global warming. What is the incentive for all these presumably normal, well-educated folks to engage in such a pernicious hoax? ...
You also assume that thousands of PhDs around the world are engaged in a massive conspiracy and not one of them has broken ranks and busted the hoax.
It just seems implausible to Mr. Wangsness, and many others, that such a “conspiracy” could be formed. And perhaps, if thought of as a conspiracy, they are right. But now think about the processes by which orthodoxies are created and enforced. There are many, many examples in human affairs of large numbers of people—even into the billions— agreeing on the precise details of a complex belief system, otherwise known as an orthodoxy. What processes lead to such huge numbers of people to enter into such an agreement? Clearly part of the process relates to specific rewards and punishments handed out by the people who run the orthodoxy system. But I would suggest that a far bigger part of what makes orthodoxies work is the universal human desire for peer acceptance. If you don’t go along with our official belief system, we will ostracize you!
Consider what is undoubtedly the archetypical example of a strictly-enforced orthodoxy system, namely the Catholic Church. As background, I should mention that I was raised as a Catholic. I continue to have large numbers of friends who are practicing Catholics, and I respect them both as people and for their beliefs. I also have great respect for the Catholic Church as an institution (less so for its current head). I do not regard Catholics as stupid or evil for having signed on to the Church’s orthodoxy. But, here we have a perfectly clear and, you will have to admit, somewhat quirky orthodoxy to which some 1.2 billion people have subscribed in great detail.
The bishops of the early Catholic Church gathered in 325 AD in the city of Nicaea, and agreed upon something called the Creed that states the fundamental beliefs of the religion. With some minor modifications made in later years (mostly in 384 AD), every Catholic recites this list of beliefs at every mass, under the leadership of a priest. Do they really all deeply believe every detail of this statement? They certainly say that they do, at least once a week. It’s a basic requirement of being a practicing Catholic.
For those who are not Catholics, I’ll give you some examples of what’s in the Creed. I’m including the relevant Latin text, as well as the English translation:
“I believe in one God.” (Credo in unum Deum.). This is a monotheistic religion.
Oh, but it is one God in three persons, the Holy Trinity—Father, Son and Holy Spirit. Is this a contradiction? We all agree that it is not.
The Son was initially “born of the Father” (ex patre natum) at a time “before all ages” (ante omnia saecula), by a process described as “begotten not made” (genitum non factum).
Later, the Son “became flesh” (incarnatus est) by a process in which the Holy Spirit impregnated a virgin (de Spiritu Sanctu ex Maria Virgine).
The Holy Spirit “proceeds” not just from the Father, but also from the Son (Et in Spiritum Sanctum… qui ex Patre Filioque procedit). The business about the Holy Spirit proceeding “also [from] the Son” (Filoque) is the basis of the rift between Roman Catholicism and the Eastern Orthodox religions. The Eastern guys insisted that the Holy Spirit “proceeded” only from the Father.
There are plenty of other items. Does every Catholic actually fully understand and believe each of these precepts? It doesn’t really matter. In return for regularly expressing these beliefs, they get to participate in the religion, which includes being part of a community of family, friends and peers, of ceremonies and sacraments, and of a promise of a happy afterlife.
The rewards are almost entire mental and spiritual, rather than material. And on that basis some 1.2 billion people subscribe. In the case of priests, adherence to the orthodoxy is further enforced by a hierarchy that controls access to the jobs, as well as promotions to positions of Monsignor, Bishop, Archbishop, and so forth. If you demand a change to the Creed, you can’t be a priest, period.
The Catholic Church is just one example of a detailed orthodoxy subscribed to by a huge number of people. The Islamic religion is another example of comparable size, although I don’t know the details of what they have agreed to as their orthodoxy.
Now apply the principles of orthodoxy creation and enforcement to the field of “climate science.” A commenter responding to Wangsness made this point: “The answer is simple. Follow the money.” I’m not saying there’s nothing to that, but note that in the case of the Catholic Church (and for that matter Islam and any other religion) money has little to nothing to do with why people subscribe; and yet huge numbers do. The main factor is peer pressure and acceptance; the second major factor is the forcible exclusion of heretics. So consider what surrounds you if you want to be in the field of “climate science” today:
In order even to start out, you need to get a job at an academic institution. If you let it be known that you are even slightly skeptical about “climate science,” you get branded as a heretic, and in all likelihood you will never get hired.
To advance in academia, you need to get articles published in prestigious academic journals. The most prestigious journals in the fields of science are Science and Nature. In recent years those journals have been controlled by global warming zealots who have made it their business to be sure that no even slightly skeptical article in the climate field can see the light of day. From 2013 to 2016 the editor of Science was one Marcia McNutt. McNutt published an editorial in her magazine in 2015 that said about climate science: “The time for debate has ended. Action is urgently needed… [D]eveloped nations need to reduce their per-capita fossil fuel emissions even further...” In 2016 McNutt was elected as the head of the National Academies of Science. As a young, skeptical climate scientist, how are you going to buck this?
For more examples of ruthless orthodoxy enforcement as to climate change in the academic world, see my posts here and here.
But here’s the amazing thing: given the relentless peer pressure to conform in climate science, and the ruthless exclusion of heretics from rights to publish and from awards and recognition in the field, in fact the level of subscription to the climate orthodoxy among people in relevant areas is far less than the 95% that Mr. Wangsness cites. The frequently-made claim of a “97% consensus” among climate scientists famously originated in an article by Cook, et al., in 2013, that was then quickly debunked in multiple places, for example here and here.
When Wangsness says that “not one of them has broken ranks and busted the hoax,” he is wrong. There are scores of top scientists in relevant fields like atmospheric physics and meteorology who have broken ranks and scream as loudly as they can on a daily basis that there is nothing behind this alarm. Just last October I was involved in submitting a letter to EPA from 65 top scientists demanding a reconsideration of EPA’s “Endangerment Finding” because of lack of scientific basis for climate alarm. The list of skeptics among the very top people in physics includes the likes of Freeman Dyson ("My first heresy says that all the fuss about global warming is grossly exaggerated. Here I am opposing the holy brotherhood of climate model experts and the crowd of deluded citizens who believe the numbers predicted by the computer models.") and Will Happer of Princeton, Richard Lindzen of MIT, and Ivar Giaever of RPI. It is truly an embarrassment to the profession of journalism that a relatively well-informed citizen like Mr. Wangsness can be unaware of this.
On January 10, the city of New York filed suit against BP, Chevron, Conoco-Phillips, ExxonMobil and Royal Dutch Shell. The suit accuses oil companies of causing dangerous climate change and damage to New York City, seeking monetary compensation. But history will rank this action high in the annals of human superstition.
The 67-page suit claims that burning of fossil fuels marketed by the oil industry changes the climate and that these changes are “injuring New York City.” The suit projects an increase in deaths from heat waves, flooding from extreme weather that would impact the city’s water supply system, increasing frequency of droughts that would diminish water to upstate New York reservoirs, and catastrophic flooding from rising oceans.
Hurricane Sandy is mentioned several times in the suit as an example of both extreme weather and rising oceans from human-caused warming. As a result of Sandy, New York launched a $20 billion effort to prepare for the effects of climate change in 2017. The city wants oil firms to pay for this effort, claiming they are causing “continuous and reoccurring injuries to the city. But these claims border on the superstitious.
Hurricane Sandy hit New Jersey and New York City on October 29, 2012 with Category 1 hurricane-force winds of 81 miles per hour. It came ashore at high tide causing extensive flooding. The storm resulted in 147 and over $50 billion in assessed damage. But this has happened before.
More than 80 tropical or sub-tropical storms struck New York State during the last 300 years. An example was the Norfolk and Long Island Hurricane of 1821. It hit New York City with Category 3 force winds, much stronger than Category 1 Sandy. Although it came ashore at low tide, when ocean levels were five feet lower than when Sandy hit, the 1821 storm flooded New York City up to Canal Street.
According to the National Hurricane Center, 170 hurricanes made US landfall during the twentieth century. Fifty-nine of these storms generated at least Category 3 wind speeds, stronger than Category 1 Sandy. How then was Hurricane Sandy evidence of human-caused global warming?
Ocean levels have risen about 120 meters (390 feet) in the last 20,000 years, according to data from NASA. Tidal gauges show a rise of about 7 inches per century over the last 150 years. No scientist can tell us when natural sea level rise stopped and man-made sea level rise began. New York City is correct to prepare for rising seas, but wrong to believe that greenhouse gases from burning oil are causing the rise.
Throughout history, people have believed that human actions can change the climate and cause extreme weather. The Aztecs of the 1500s practiced human sacrifice in an attempt to control the weather and to keep the Sun moving across the sky. After King Henry divorced his wife, Catherine, in 1533, the English believed that nine months of unusually heavy rainfall were a result of the divorce. During the cool climate of the Little Ice Age between the fourteenth and nineteen centuries, hundreds of thousands of people in Europe were executed for the crime of witchcraft, blamed for short growing seasons and crop failures.
Today we still live in a world of superstition. Climate advocates tell us that if we change our light bulbs we can save polar bears. If we erect wind turbines we can make the storms less severe. And if we drive electric cars we can stop the oceans from rising. Our modern witches are the oil and coal companies.
Steve Goreham is the author of “Outside the Green Box: Rethinking Sustainable Development” (New Lenox Books, 2017).
It’s been an eventful weather week in some portions of the globe. In fact, it is always an eventful weather week - somewhere.
But what really drives the narrative is when weather extremes - which always have, and always will, occur - happen to hit major metropolitan areas. Many people are already aware of the relentless guffawing resulting from Al Gore’s tweet that Michael Mann says the Northeast’s current cold wave is just what global warming predicts. (As I recall, Mann is a mathematician, not a meteorologist. Correction: Mann is a geologist/geophysicist, which is equally uninformed on atmospheric dynamics.)
Yesterday, Kristine Phillips of The Washington Post wrote about the recent “bomb” snowstorm in New England, the ensuing cold wave, and the extreme heat (110+ deg. F) that has just hit Sydney, Australia.
To her credit, she did not explicitly put the blame on climate change for these events, but her legal-background prose came pretty darn close… just close enough so that the casual reader would make the connection. Wink-wink, nod-nod.
The trouble is that neither of these two events are exceptional from a meteorological perspective. That is, they have happened before (Sydney’s 117 deg. F peak was exceeded in 1939), and they will happen again.
It is only when we can demonstrate that such events are increasingly occurring over, say, 50 to 100 years that we can begin to invoke climate change. (And even then we must debate the various causes of climate change.) So far, that evidence is sorely lacking.
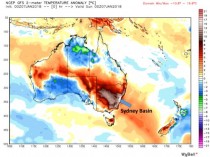
The Sydney Heat Wave
Here’s the GFS forecast model analysis of surface temperature departures from average for about the time that peak temperatures were reached in Sydney yesterday. Maybe you can tell me which of these cold and warm patterns are consistent with global warming theory and which aren’t? (Hint: Warming should be occurring basically everywhere):
GFS analysis of surface temperature departures from normal at about the time 110 deg. F temperatures were reached in Sydney, Australia (Weatherbell.com graphic).
See that hotspot in the Sydney Basin? That is a localized effect of downslope winds from the highlands to the west which causes enhanced warming of the air, as well as bushfires. It clearly does not represent what is happening across Australia as a whole. Australia is exceedingly hot this time of year anyway, heat which is made even worse since the sun is closer to the Earth in January than in July (leading to a 7% range in solar radiation reaching the Earth).
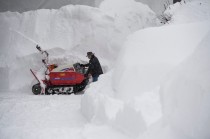
The “Bomb” Blizzard
Meteorologist Fred Sanders coined the term “bomb” in 1980 to refer to a non-tropical cyclone whose central pressure drops by at least 24 millibars in 24 hours.
They happen every year.
But what doesn’t happen every year is them influencing major metro areas. So, the recent nor’easter snowstorm to hit the Mid Atlantic and New England was also a “bomb” because the low pressure center intensified so rapidly. These events happen every year in, for example, the North Atlantic and North Pacific.
We meteorologists used to talk about “bombs” fairly regularly in the 1980s, but not so much in recent years. I wonder if maybe climate change is making winter storms weaker? Hmmm…
And to attribute every winter cold wave or heat wave to global warming is just plain silly. These things happen even without global warming (which, by the way, I do believe is occurring, just not very strongly, dangerously, or maybe not even mostly due to human causation). Seasoned New Englanders can tell you that.
Meanwhile, The Weather Channel (aka “The Disaster Channel") serves up a steady stream of weather porn to titillate the senses.
And before you believe that warmth in January is unusual, “January thaws” are a routine phenomenon, too, which is why the term was coined. According to the Glossary of Meteorology:
“The daily temperature averages at Boston, computed for the years 1873 to 1952, show a well- marked peak on 20-23 January; the same peak occurs in the daily temperatures of Washington, D.C., and New York City. Statistical tests show a high probability that it is a real singularity. The January thaw is associated with the frequent occurrence on the above-mentioned dates of southerly winds on the back side of an anticyclone off the southeastern United States.”
Nevertheless, the weird-weather-is-climate-change narrative will continue until the populace finally agrees with the warmongers that we can control our weather through taxation and regulation.
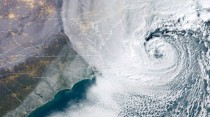
Da Bomb January 4th, 2018
GOES-16 image of the intense extra-tropical cyclone at 8:45 EST January 4, 2018.
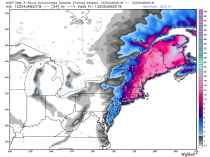
The rapidly intensifying non-tropical cyclone producing heavy snow and blizzard conditions over the mid-Atlantic and New England is meeting expectations, with localized snowfalls of over 6 inches already this morning.
The latest NAM model forecast of additional snowfall after 7 a.m. this morning until tomorrow morning shows up to 12-18 inches of snow over portions of Massachusetts, Connecticut, Rhode Island, Vermont, and Maine (graphic courtesy of Weatherbell.com):
Maximum additional snow accumulations from 7 a.m. Thursday Jan. 4 to 7 a.m. Friday, from the NAM weather forecast model.
As of 9 a.m. EST, all 5 NWS reporting stations in Rhode Island have heavy snow falling.
The term “bomb” was coined by meteorologist Fred Sanders in 1980 to refer to a non-tropical low pressure area that intensifies at least 24 millibars in 24 hours. They happen every year, and are usually centered offshore in the winter where cold continental air masses meet warm oceanic air masses, providing maximum energy to the intensification process.
On November 3, the U.S. Global Change Research Program released the “Fourth National Climate Assessment,” a 477-page document filled with concern about Earth’s changing climate. The study concluded that human emissions of carbon dioxide (CO2) cause dangerous global warming. But marijuana growers know something that climate scientists apparently don’t know.
The Fourth Assessment is an alarming document that uses the word “extreme” more than 700 times to describe storms, floods, droughts, precipitation, snowfall, temperature and other weather variations. The Assessment concludes: “Reducing net emissions of CO2 is necessary to limit near-term climate change and long-term warming.” Essentially, the report concludes that CO2 emissions are dangerous.
While the Assessment doesn’t call CO2 “pollution,” other parties use the report to do so. The American Academy of Sciences states that the Assessment “reinforces that warming temperatures and extreme weather” are “the result of carbon pollution from human activities.” The Atlantic says that the Assessment confirms that “Climate Change is real. It’s caused by greenhouse gas pollution released by human industrial activity.”
But marijuana growers know that carbon dioxide isn’t pollution. It’s plant food! Any smart cannabis grower pumps carbon dioxide into the greenhouse to make the pot crop grow bigger and faster. Marijuana growers use canisters of CO2 gas and CO2 generators hang from greenhouse rafters to boost crop yields.
Hundreds of peer-reviewed studies show that plants grow bigger with higher levels of atmospheric carbon dioxide. In 2011, Dr. Craig Idso, founder of the Center for the Study of Carbon Dioxide and Global Change, compiled the results of more than 1,000 scientific papers reporting on CO2 enrichment experiments. He developed estimates of the mean crop growth rate in response to a 300-ppm increase in the level of atmospheric CO2. The data shows that all 92 of the world’s food crops grew larger with increased levels of carbon dioxide. The world’s seven largest food crops, corn, potato, rice, soybean, sugar beet, sugar cane, and wheat, grew between 21 and 66 percent larger in controlled experiments.
Plants get bigger fruits and vegetables, thicker stems, and larger root systems with higher levels of atmospheric carbon dioxide. Higher levels of CO2 also make plants more resistant to drought.
The recent rise in atmospheric CO2 that climate scientists fret about is actually greening the Earth. A 2013 study led by Dr. Randall Donahue of Australia’s Commonwealth Scientific and Industrial Research Organization analyzed plant growth using satellite data. After accounting for changes in precipitation, the study found an eleven percent increase in global leaf area from 1982 to 2010. Most of this increase was attributed to rising levels of atmospheric carbon dioxide.
Rather than a negative, rising levels of atmospheric CO2 must be boosting global agricultural output. If there is one compound that humans can put into nature that is great for the biosphere, carbon dioxide is that compound. But today carbon dioxide is branded “pollution” and every company and every university foolishly tries to reduce CO2 emissions.
Steve Goreham is a speaker on the environment, business and public policy and author of the new book ‘Outside the Green Box: Rethinking Sustainable Development.’
-----------
Back in January 2014, I wrote this story:
Superbowl, Cannabis and CO2
By Joseph D’Aleo, CCM
The two surviving teams going to the superbowls coming from the two states that have legalized marijuana. I will avoid speculating a possible role of that in bringing that outcome, I will make the point that they can thank CO2 for increasing photosynthesis, limiting the transpiration (moisture loss through pores on the leaves) and through that significantly limiting the water usage needs for Cannibas.
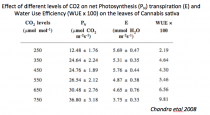
A paper supported by the National Institute for Health (NIH) published in Physiol. Mol. Biol. Plants, 14(4) October, 2008, Photosynthetic response of Cannabis sativa L. to variations in photosynthetic photon flux densities, temperature and CO2 conditions by Suman Chandra, Hemant Lata, Ikhlas A. Khan and Mahmoud A. Elsohly tells us the story. From the abstract we see:
Effect of different photosynthetic photon flux densities (0, 500, 1000, 1500 and 2000 μmol m-2s-1), temperatures (20, 25, 30, 35 and 40 degrees C) and CO2 concentrations (250, 350, 450, 550, 650 and 750 μmol mol-1) on gas and water vapour exchange characteristics of Cannabis sativa L. were studied to determine the suitable and efficient environmental conditions for its indoor mass cultivation for pharmaceutical uses.
An average of 30 to 33 % increase in PN photosynthesis productivity of C3 plants with doubling atmospheric CO2 concentration has been already reported by Kimball 1983a, b; 1986; Idso and Idso 1994; Bazzaz and Gabutt, 1988; Cure and Acock, 1986. In Cannibas sativa, a doubling of CO2 concentration (750 μmol mol-1) suppressed E 29 % stimulated PN by 50% as compared to ambient CO2 concentration. Doubling CO2 level had a significant effect on all these parameters.
We may gain more converts into the battle against the cabonistas if we educate the public in these blue green states on this fact!!!!
Puts a new light on Arte Johnson’s character from Laugh-In. Very interesting.


