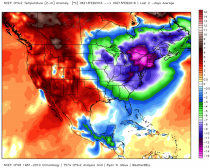
A brutally cold air mass rode the arctic express from north of Alaska and northern Canada to the northeast in just two days. It arrived with temperatures surface and aloft that were more extreme than we have seen in decades.
We were 10 to 20 below zero here in central New England late on Saturday, Sunday morning and again Monday morning. Sunday barely reached the low teens. Wind chills reached the -30s and even -40s at times Saturday evening and Sunday morning.
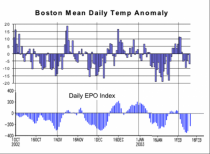
Boston set records on Saturday with -4F (edging out -3F in 1967), and on Sunday with an amazing -9F, well below the old record of -3F in 1934. It was tied for Boston’s 4th coldest daytime low since the official measurements began at Logan Airport in 1936. It also was coldest temperature at Logan since January 1957, almost 60 years ago. The average temperature was more than 30F below the normal for the date.
It reached -30F at Saranac Lake and -37F at Watertown in New York State and -40F on Mt. Washington with wind chills to -80F. Dozens of people were trapped for several hours on stalled tram cars on a snowy New Hampshire mountain Sunday, braving subzero temperatures while the cars dangled in mid-air before being rescued.
Even New York City dropped to -1F Sunday, coldest since 1994 with wind chills plunging below -30F. NYC cancelled their ice festival Sunday because it was too cold. Ironically last month they cancelled the Central Park Snow Festival because of too much snow.
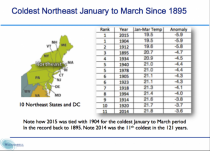
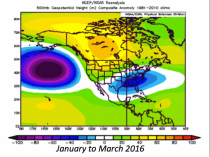
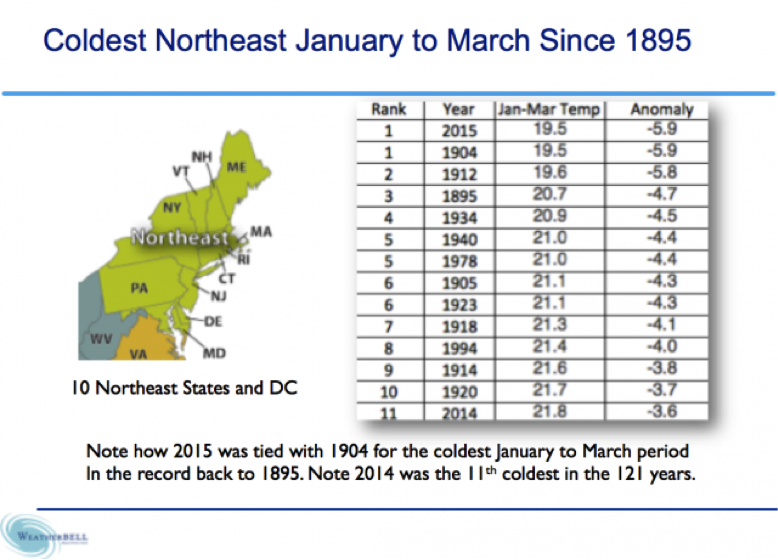
For the 10 northeast states and DC, January to March in 2014 was the 11th coldest on record since 1895 (with March ranked coldest to second coldest here in northern New England). Last year, January to March was the all-time coldest (tied with 1904). February 2015 was the coldest month of any month in our part of New England in history and also the snowiest (100 inches in 39 days).
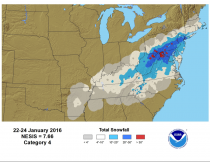
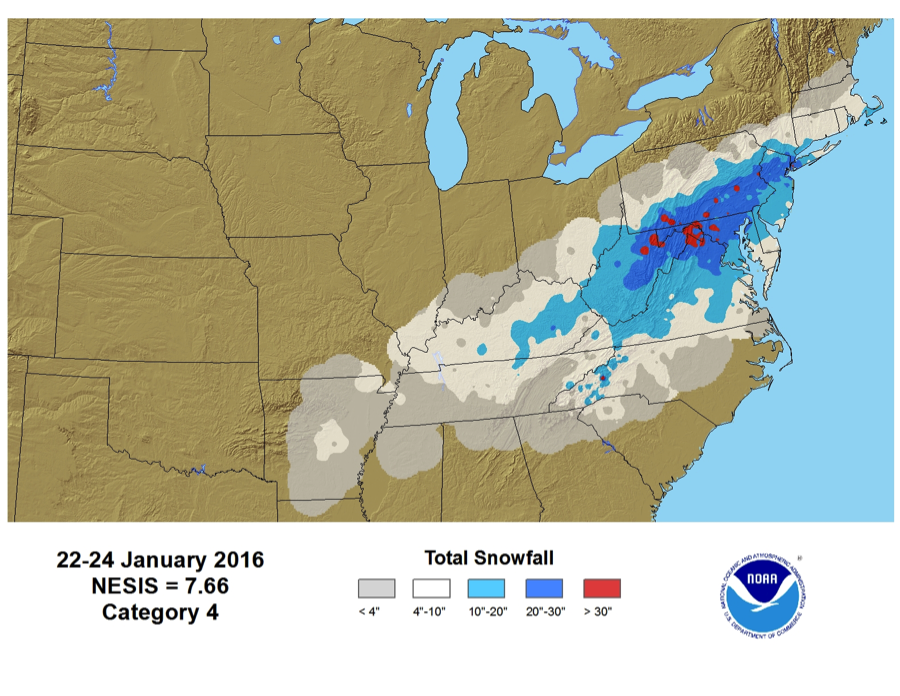
This year thanks to El Nino, the cold has been extreme but so far, episodic instead of more continuous and the record breaking January blizzard stayed just to our south.
With the very warm December, temperatures for the meteorological winter of December to February will be above normal here in the northeast (though colder than normal to our south). However, January to March could again end up colder than normal here too, though it will not rank up there with the last two years.
I found the 60 year ago record broken interesting. We have a well-established 60-year cycle in weather, riding on many longer-term cycles related to behavior of the sun and oceans. This is much like the waves on the ocean riding on the longer swells. I have written about these in books and peer-reviewed papers. A change occurred 60 years ago, which I catalogued in my master’s thesis on east coast snowstorms. At that time cold and snow for a few decades suddenly became biased to the latter part of winter. That certainly has been the case the last three years.
At Weatherbell, we advised out clients most of the winter would come January to March, with the potential for significant cold outbreaks and more snowstorms.
Here, we will continue to ride the roller coaster into early next week, but then stronger cold returns again with more snow threats.
In the last El Nino in 2009/10, when the Mid-Atlantic received all-time record snows in what was called ‘Snowmageddon’, we in New England ended up near to below normal for snowfall. Though that may in the end happen this year, we will have numerous chances the next 5 to 6 weeks and one or more may track just right to bury ‘us’. If so, don’t blame me. I am just the messenger. Blame ‘Phil’.
-----------
Help us maintain Icecap if you are able. Even small amounts help us pay the maintenance charges for the server that keep coming each month. We keep the site going without a support staff to try and provide you with information you can use. We have over 8000 entries searchable - to help you find the information you need. Alternatively, consider a subscription to Weatherbell.
A non-profit watchdog group’s lawsuit against the National Oceanographic and Atmospheric Administration may have spurred the agency to release documents to a congressional committee that reveal a “new climate data scandal.”
Judicial Watch filed a Freedom of Information Act lawsuit Dec. 2, 2015, against NOAA “regarding methodology for collecting and interpreting data used in climate models,” the group said Tuesday.
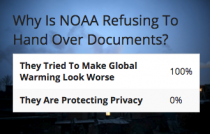
Why Is NOAA Refusing To Hand Over Documents?
The House Committee on Science, Space and Technology subpoenaed the same documents earlier this year, but NOAA refused to hand the records over until a few days after Judicial Watch filed its lawsuit.
“We have little doubt that our lawsuit helped to pry these scandalous climate change report documents from the Obama administration,” Judicial Watch President Tom Fitton said. “Given the lawless refusal to comply with our FOIA request and a congressional subpoena, we have little doubt that the documents will show the Obama administration put politics before science in advance of global warming alarmism.”
The documents revealed a “new climate data scandal,” Judicial Watch said in announcing the suit.
“Information provided to the committee by whistleblowers appears to show that the study was rushed to publication despite the concerns and objections of a number of NOAA employees,” according to the committee.
Committee Chairman Lamar Smith wrote recently that “NOAA often fails to consider all available data in its determinations and climate change reports to the public.”
The Texas Republican also noted that a recent NOAA study made adjustments to historical temperature records, which led the findings to refute a nearly two-decade pause to global warming.
The Judicial Watch’s lawsuit was filed after the Department of Commerce, which governs NOAA, failed to respond to an Oct. 30 Freedom of Information Act request seeking communications between NOAA’s officials regarding how climate data is collected, analyzed and used.
Smith subpoenaed the agency for the same documents on Oct. 13, and sent a total of four letters to NOAA requesting the information.
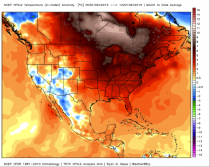
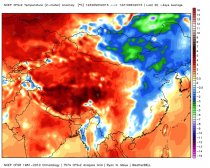
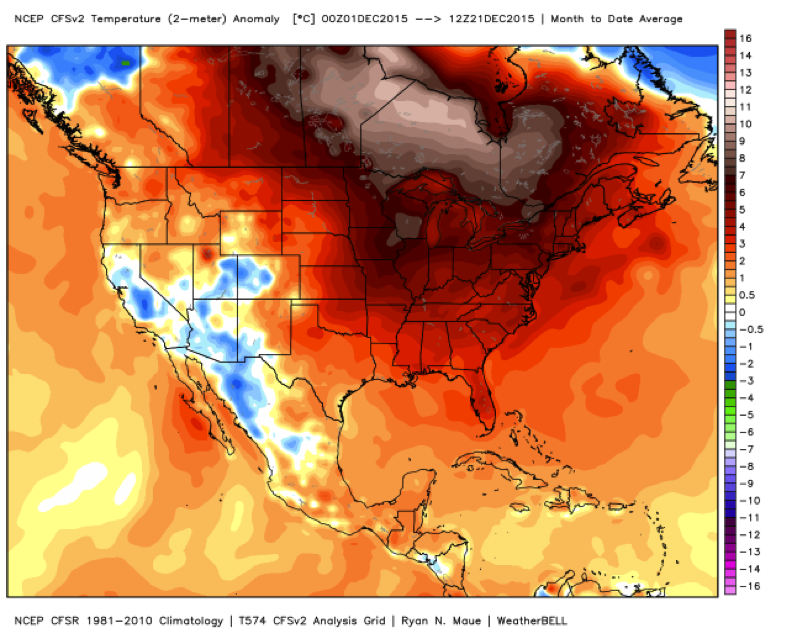
The year 2015, which started with the coldest January to March for the Northeast (10 states plus DC) and warm dry southwest, will end with an all-time warmest December for the United States (3rd warmest in the satellite era since 1979 globally). This is thanks in part due to a strong El Nino.
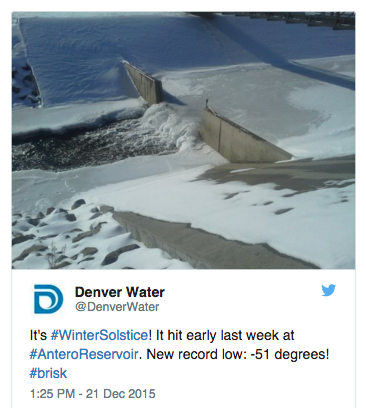
On the morning of December 17 the thermometer at Antero Reservoir dropped to an astounding -51F. The last time that happened was on Feb. 8, 1989.
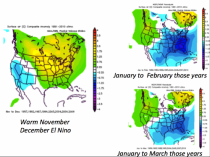
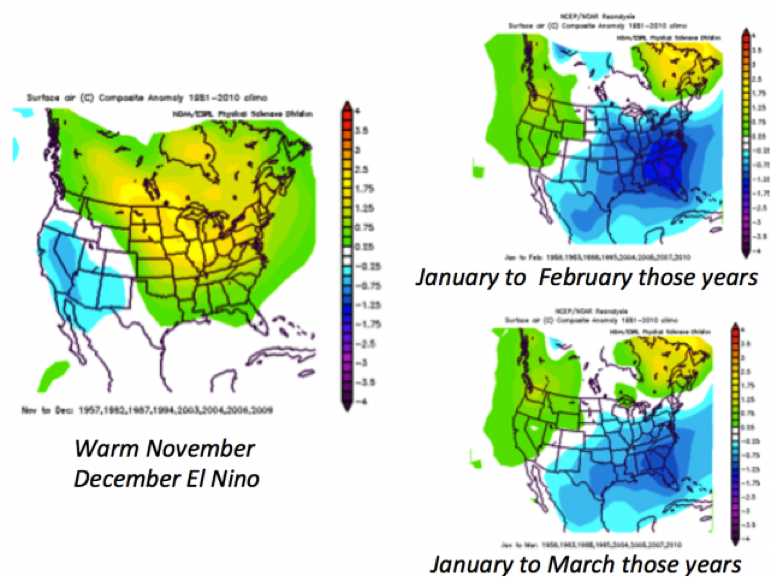
But like last year when December and Christmas were warm, the pattern will flip. The change will come a bit earlier than 2014/15. There are a lot of reasons to believe this. Warm November and December El Ninos often flip in January to March.
In the strong El Nino of 1965 the Upper Midwest including the Great Lakes and Minnesota and Iowa went from +7.9F in December to -7.2 in January. The second year El Nino of 1987/88 went from +6.5 to -1.8F in January and -3.7F in February. Last year it took a little longer in the weaker Modoki going from +6.1F in December to -8.4 by February. In the 10 northeast states plus DC we went from +5.9F in December to -2.6F in January, an amazing -10.4F in February and -4.5F in March. That made the region the coldest ever since 1895.
The media downplayed this away from the buried cities and NOAA in their winter highlights focused first on the warmth and dryness in California. In the prior winter, which featured record snow in the Great Lakes area and the coldest December to March in Chicago’s long history, it got a media attention during the coldest days mainly because of the term ‘polar vortex’, which sounded like something unique and that we somehow caused.
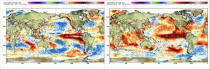
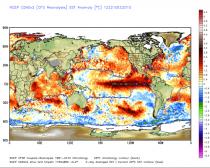
We hear references to 1997/98 as proof super NINOs bring blow torch winters and high confidence that this will be one. However there are more than subtle differences with 1997/98 as JB, TD and I have discussed.
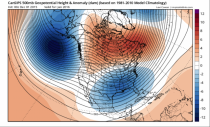
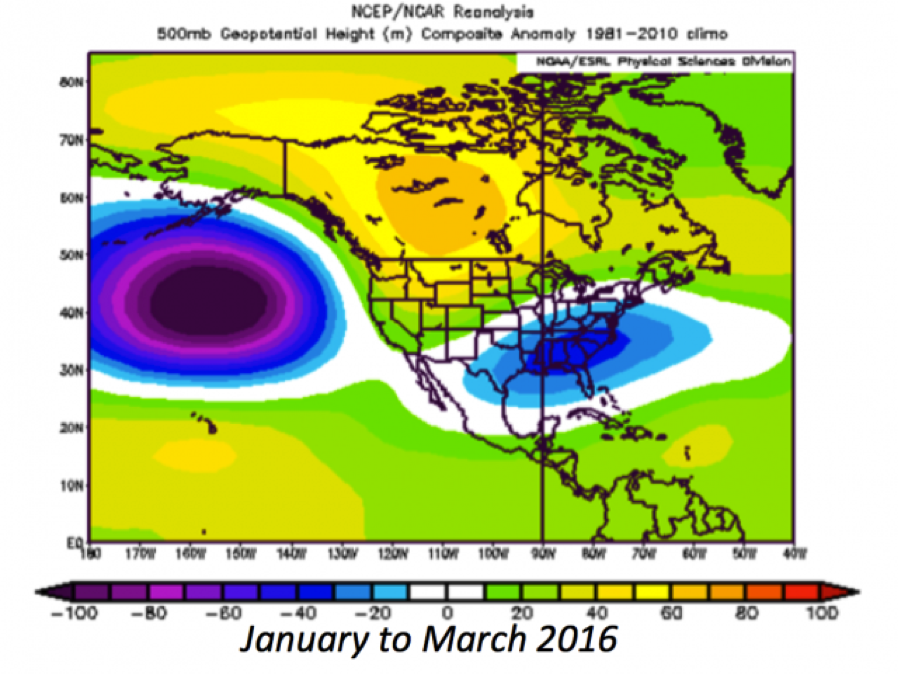
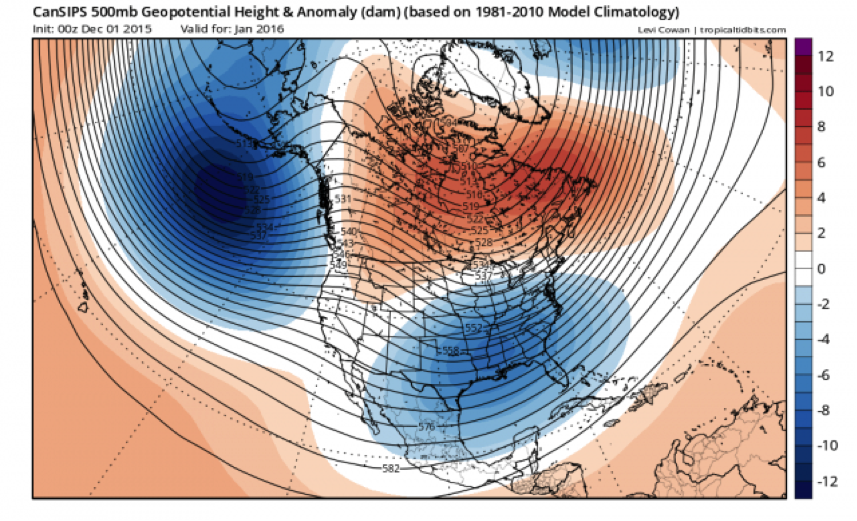
The cooler east and warmer central makes it more Modoki like which means the east is able to see the arctic air come south around the retrogressing western and central Canada ridge into the developing eastern (southeastern) CONUS trough.
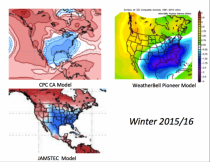
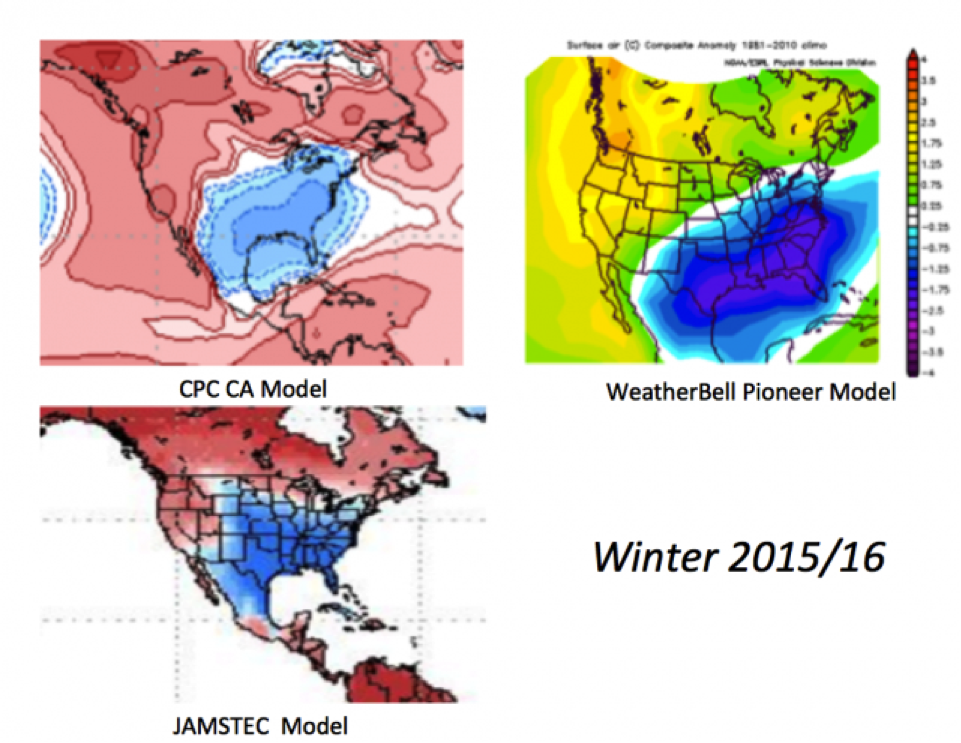
Next we have good agreement on the seasonal tools we trust. The CPC CFSv2 as it always does, will be last to ‘see the light’. But our 22 input Pioneer Model, the CPC CA and JAMSTEC agree with the change.
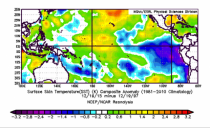
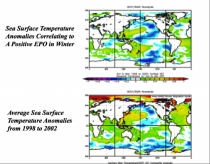
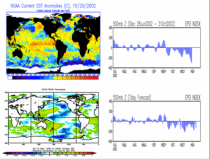
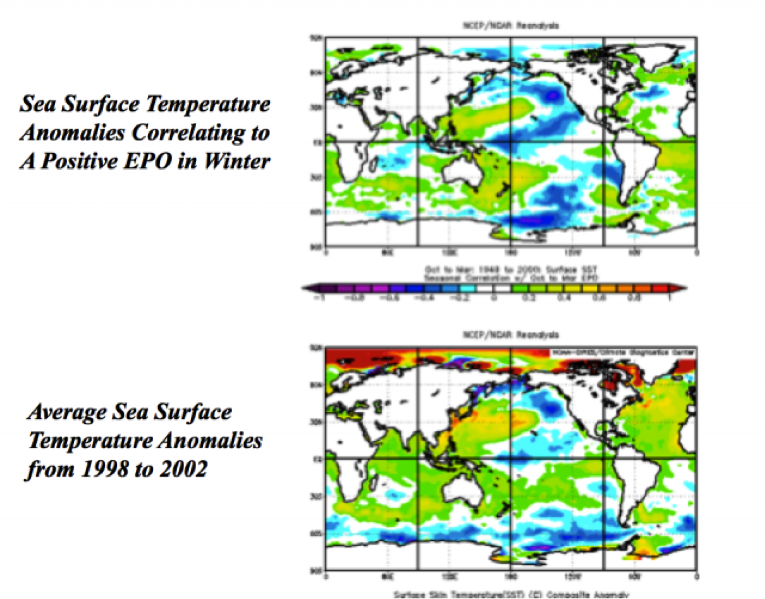
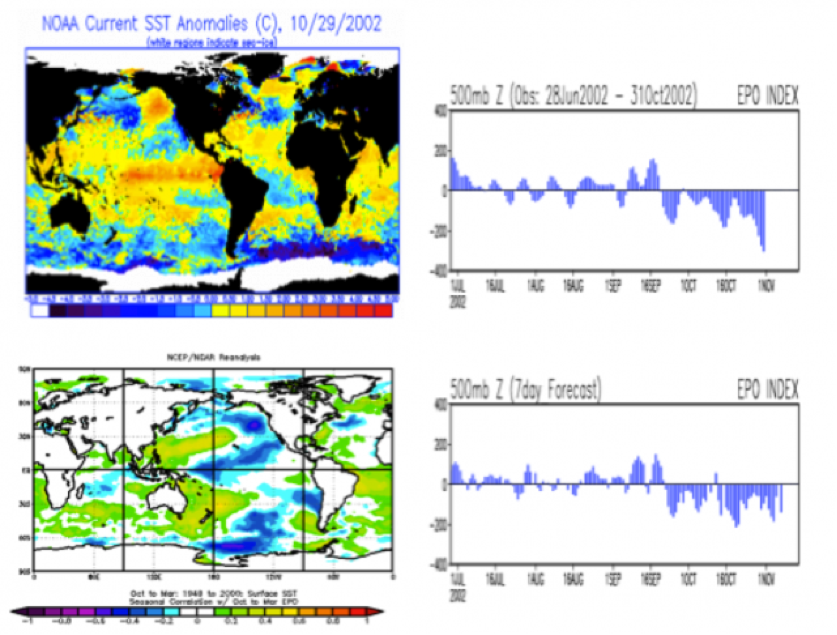
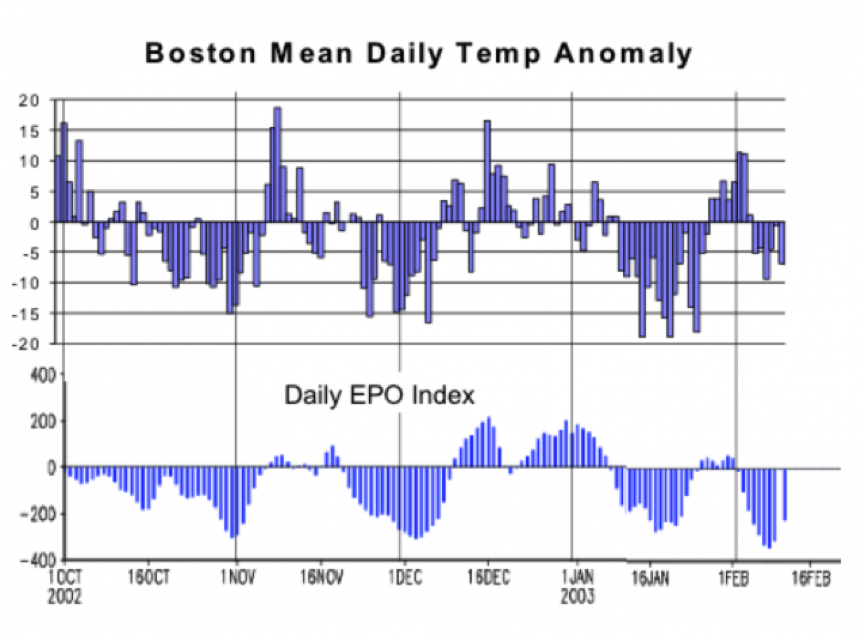
Then as I posted a few days ago, the EPO which has been positive (which favors warm central and eastern US), is not favored with the warm water off the west coast. Cold water like we had 1998-2002 and again 2011 to 2013 favors a +EPO. Warm water, which came on in 2002/03 and 2013/14 favors a -EPO.
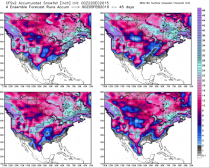
I had indicated the pattern would start to appear, somewhat inconsistently, in the models by the solstice. Indeed they have. The EPS long range shows it in late January. Come to Weatherbell and see the daily, weekly and even the 45 day European high resolution data.
The op run EC shows an impressive cold outbreak and developing east coast threats and widespread snows next month.
Note: Our team does daily briefings of which the above is an abbreviated version of. We do daily videos as well, explaining and further expounding on our forecasts and the reasoning them. We specialize in long range and correctly forecast up to 9 months in advance the last two winters and summers. If weather is of interest or affects your business please consider becoming party of the Weatherbell clients family, 4000 strong.
China leads the world in 2015 with a growth of 7%. India is not far behind at 5.5%. As China and India have spurred growth to become centers of industry, they have employed cheap energy such as coal without, in many cases, the investment in scrubbing or removal of particulates and chemicals from the effluence that the industrialized west has invested in after similar pollution episodes 60 years ago.
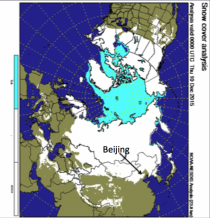
In winters, as cold air settles in, inversions often form in the long nights and daytimes of feeble sun when the winds are light, trapping the pollution. Areas of China and India are suffering from severe pollution episodes this month.
In places like Beijing and other populous areas or eastern China, a cold outbreak with snow helped to ensure the inversions when the cold air aloft moved on.
The high-pressure overhead gets replaced with gusty northwest winds will clean out the air the next week but then cresting of high pressure overhead by week 2 will allow fog and smog to return.
Even with the attention to China, India is suffering too. Of the top 10 most polluted cities in the world, six are in India.
Though environmentalists make a big deal about the small particulate matter content as the problem because that is the ‘carbon pollution’ they are riding to their hoped for Paris agreement, in reality the real damage comes from chemical reaction of effluent gases like sulfur dioxide with water droplets in the ‘fog/smog’ that forms sulfuric acid mist. It is joined by hydrochloric acid. You will read that it is a CO2 problem but one has to remember with every breath, we emit 40,000ppm into air with around 400 ppm CO2 and that CO2 is 0.04% of the atmosphere.
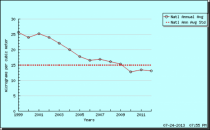
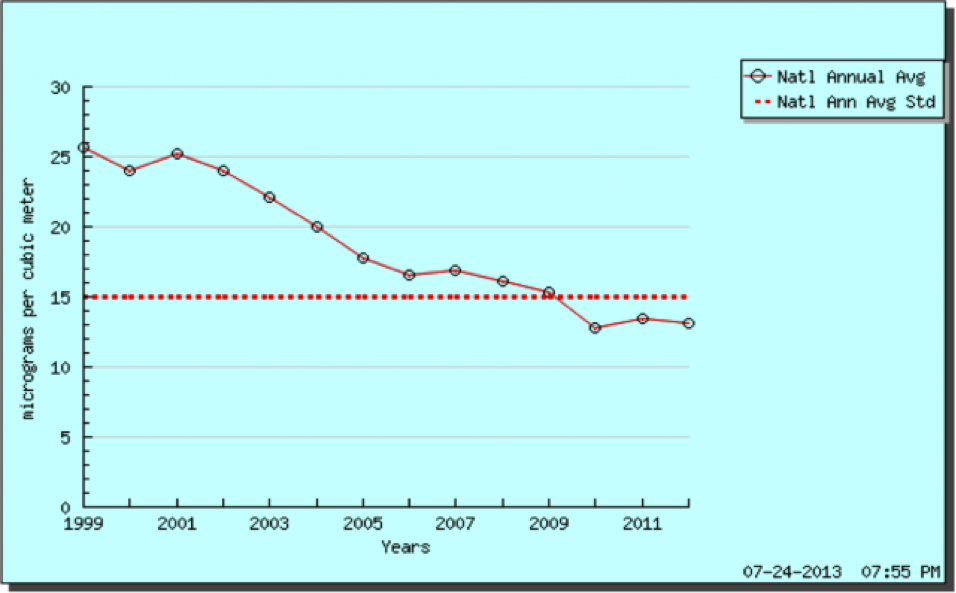
In Europe and North America, we went through similar incidents that forced necessary changes to our air quality control. That improvement continues. We have decreased the small particulate loading of the air by 50% the last two decades to well below the target standards.
That brings to mind some of those trigger incidents.
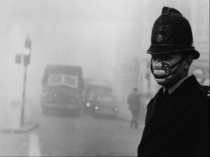
THE GREAT LONDON SMOG OF DECEMBER 1952
As the UKMO described it “The weather in November and early December 1952 had been very cold, with heavy snowfalls across the region. To keep warm, the people of London were burning large quantities of coal in their homes. Smoke was pouring from the chimneys of their houses.
Under normal conditions, smoke would rise into the atmosphere and disperse, but an anticyclone was hanging over the region. This pushes air downwards, warming it as it descends. This creates an inversion, where air close to the ground is cooler than the air higher above it. So when the warm smoke comes out of the chimney, it is trapped. The inversion of 1952 also trapped particles and gases emitted from factory chimneys in the London area, along with pollution, which the winds from the east had brought from industrial areas on the continent.
Fog formed in the calm air as the ground cooled. During the period of the fog, huge amounts of impurities were released into the atmosphere and trapped in the fog beneath the inversion. On each day during the foggy period, in addition to the small particulates from the combustion of coal, the UKMO estimates 140 tonnes of hydrochloric acid and 14 tonnes of fluorine compounds. In addition, and perhaps most dangerously, 370 tonnes of sulphur dioxide were converted into 800 tonnes of sulphuric acid.”
That acid fog is what did most of the damage.
Government medical reports in the following weeks estimated that up until 8 December 4,000 people had died prematurely and 100,000 more were made ill because of the smog’s effects on the human respiratory tract. More recent research suggests that the total number of fatalities was considerably greater, at about 12,000.
As the UKMO reports “This kind of smog has now become a thing of the past, thanks partly to pollution legislation and also to modern developments, such as the widespread use of central heating.”
DONORA PA SMOG EVENT OF 1948
Noontime smog in Donora. Pennsylvania in October 1948
The Donora killer smog event of 1948 was the result of a low level inversion in late October of 1948 resulting in a wall of particulate and chemical laden fog that killed 20 people and sickened 7,000 more in Donora, Pennsylvania, a mill town on the Monongahela River, 24 miles southeast of Pittsburgh. Sixty years later, the incident was described by the New York Times as “one of the worst air pollution disasters in the nation’s history”. The Donora smog event, the worst air pollution disaster in U.S. history, let the public know that industrial pollution could kill. It eventually led to the Clean Air Act.
No one is opposed to clean air. I did my doctoral studies grant work on air resources (after a masters on explosive development in east coast storms). We had real pollution issues back then (CO, SO2, NOx, hydrocarbons), largely resolved now. They need to do the same in China and India.
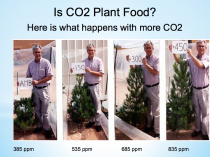
But it is NOT carbon dioxide that is the killer. CO2 is a plant fertilizer that has helped feed the growing world population.
Clean coal plants are being built now in China and in places like Japan and Germany as they have discovered that renewables are unreliable and expensive energy sources for not only the populace but also for industry that requires steady, dependable and economical energy sources to compete in the global economy.
------------
Help us maintain Icecap if you are able. Even small amounts help us pay the maintenance charges for the server that keep coming each month. We keep the site going without a support staff to try and provide you with information you can use. We have over 8000 entries searchable - to help you find the information you need. Alternatively, consider a subscription to Weatherbell.
See Climate Hustle story on Breibart here. See Climate Depot links to red carpet movie premier amid protest and worry that the big lie would be exposed and treaty fail.
The seven most insidious fossil fuel lobbyists in Paris to weaken attempts to agree a global climate deal have been named and shamed as ‘climate criminals’ in a dossier published by the global citizens movement Avaaz.
The group, which spearheaded last weekend’s climate marches which saw 785,000 people take to the streets globally, posted over a thousand ‘Wanted’ posters outside 5-star hotels in the French capital on Monday morning. The poster highlighting the seven most notorious dirty energy lobbyists unearthed from the list of more than 50,000 delegates at summit.
On Monday morning, Avaaz ‘Climate Cops’ will hand out flyers outside key Metro stations leading to the Le Bourget with photos of the lobbyists, who are expected to ramp up their efforts to derail a deal when ministers arrive this week to negotiate the deal.
Emma Ruby-Sachs, Acting Executive-Director of Avaaz says: “These lobbyists have come to Paris to sabotage a global deal for ambitious climate action, despite over 3.6 million citizens around the world calling for 100% clean energy. Ministers must listen to their people, not polluters, and refuse meetings with climate criminals who want to derail a deal the whole world wants.”
Each of the seven named lobbyists is renowned for their backroom dealings to to stop the transition to clean energy and push the interests of dirty fossil fuels. Some have resorted to harassing climate scientists and even calling for them to be ‘publicly flogged’.
The lobbyists include:
Benjamin Sporton, head of the World Coal Association
Fiona Wild, representative of mining-giant BHP Billiton
Marc Morano, whose trademark activity is to publish the email addresses of climate scientists to expose them to hate mail.
Myron Ebell, director of US think tank Competitive Enterprise Institute known for receiving money from ExxonMobil
Chris Horner, funded by the coal industry and known for “harassing” climate scientists in order to access to their email
Bjorn Lomborg, previously backed by funders with links to the Koch brothers, he’s most known as the ‘delayer in chief’ when it comes to climate
James Taylor, senior fellow at climate denial lobby group Heartland Institute
Examples of lobbyists’ far-reaching influence within climate meetings include The World Coal Association setting up shop next to the COP19 summit in Warsaw in 2013 to convince negotiators to embrace coal as a solution to climate change.
This resulted in the Warsaw Communique promoting clean coal, which has been deemed as “a myth” by National Geographic. At the COP17 in Durban in 2011, the Carbon Capture and Storage Association (comprised of major fossil fuel and power companies) successfully lobbied for carbon credits for new coal plants.
With global warming a clear scientific reality, the world has become increasingly intolerant of the fossil fuel industry’s attempts to undermine climate science and climate legislation. The campaign comes off the back of recent cases cracking down on “climate criminals,” including the investigation into Exxon for allegedly lying to the public about the risk of climate change.
The dossier is published as part of Avaaz’s 100% Clean campaign, which has been backed by more than 3.6 million people.
Marc Morano, publisher of Climate Depot and producer of new ‘Climate Hustle’ film having its red carpet debut tonight in Paris: Climate Hustle tonight at the Cinema du Pantheon at 7:30 PM.
Morano statement: “Since the ‘wanted’ posters for me are all over Paris, I have relocated to a secure undisclosed location. I hope my trip to Paris for ‘Climate Hustle’ red carpet premiere will go better than JFKs trip to Dallas.”
UPDATE: Another photo showing the wanted posters:
The ‘Wanted’-style posters went up in Paris late on Sunday. Credit Avaaz
From the New York Times:
Environmental activists pasted more than 1,000 “Wanted” posters outside luxury hotels here overnight, calling seven people who have ties to the fossil fuel industry or are skeptics of climate change “criminals.” The activists also distributed flyers with photographs of the seven.
“These lobbyists have come to Paris to sabotage a global deal for ambitious climate action,” said Emma Ruby-Sachs, acting executive director of Avaaz, the activist group that organized the stunt. “Ministers must listen to their people, not polluters, and refuse meetings with climate criminals who want to derail a deal the whole world wants,” she added.
Mr. Morano sent back a photograph of himself, looking mock-terrified, crouching next to one of the “Wanted” posters that had been posted in the Eighth Arrondissement.
“The posters are an exercise in silliness,” Mr. Morano said. “Climate skeptics are here promoting open debate and arguing to allow dissent. The idea that any alternative views amount to a ‘criminal’ perspective is obscene.
Mr. Taylor, of the Heartland Institute, said in an email: “It is a shame that people must experience such vitriol and harassment when they make scientific arguments supported by scientific data. If such attacks must be made, however, I am glad it was my face that appeared on their posters. I will always be proud to stand up for free and open discourse and ultimate truth.”
The Heartland Institute is hosting a climate change conference of its own on Monday, at the Hotel California here. It posted on Twitter: “Eco-left activists put ‘Wanted’ posters outside our event space last night. We are not intimidated.”
---------------
Paris Climate Talks Are Doomed Because China Knows ‘Climate Change’ Is A Hoax
By James Delingpole
“The fact of the matter is that there’s a reason why you have the largest gathering of world leaders probably in world history here in Paris. Everyone else is taking climate change seriously.” Barack Obama.
Like a lot of the president’s statements on climate change this isn’t actually true. In fact there are lots and lots of people in the world who know it’s a hoax. And among them, unfortunately, happen to be the ruling elite of the most significant carbon emitting nation of them all: China.
We know this because of a devastating report, released today by the Global Warming Policy Foundation, written by one of the West’s leading experts on the Chinese environmental economy, Patricia Adams.
Adams, an economist, executive director of Toronto-based Probe International, who has been working with the Chinese environmental movement since the mid-Eighties, is under absolutely no illusions about China’s real position on “climate change.”
China sees it as a brilliant opportunity to fleece the gullible gwailo for as much money as it can, to burnish its international image by making all the right green noises, and to blackmail the West into providing it with free technology.
But it has no intention whatsoever of sacrificing economic growth by reducing its carbon dioxide emissions.
China knows this. The West either knows this or strongly suspects this. So any agreement reached next week which pretends otherwise will either be a fudge, a lie, or an outright capitulation by Western negotiators - because China knows what it wants and it isn’t budging, no sirree.
Here’s how Adams puts it:
China, the world’s largest emitter of carbon dioxide, is under intense international pressure to reduce its use of fossil fuels. Although China’s leaders aim to reduce the country’s fossil-fuel consumption to 80% of its energy mix by 2030, they will not forsake national economic growth for the supposed global good. This is because China’s Communist Party knows that to stay in power - its highest priority - it must maintain the economic growth rates that have raised the incomes of much of its population and kept opposition at bay. China’s leaders know that GDP growth is tied to fossil fuel use.
So far so disastrous for the COP21 negotiations. But worse is to come, far worse.
Obama and other Western leaders like to pretend that China’s appalling air pollution - the “airpocalypse” afflicting major cities which kills at least half a million a year - gives it a strong incentive to reduce its CO2 levels. But in fact the opposite is true.
That’s because China understands - as the West pretends not to - that CO2 and “pollution” are very different things.
Not only do the goals of reducing carbon emissions and air pollution not reinforce each other, they conflict. Carbon dioxide is a colourless, odourless, tasteless gas that does not harm health. Efforts to reduce it rely on un-proven abatement technologies, and are prohibitively expensive. In contrast, abating air pollutants such as nitrogen oxides and sulfur dioxide rely on proven technologies and are relatively inexpensive.
In fact many greenies in the West secretly welcome China’s pollution because it makes the Chinese population more restive and environmentally conscious. But this is a delusion: even ordinary Chinese know that CO2 is not pollution.
The West’s climate change establishment is worried that if Beijing focuses ‘narrowly’ on eliminating the air pollutants that worry the general population, China will entrench cleaner-burning fossil fuels in its economy, costing the West its leverage over China’s energy policies. Yet the Chinese public is unlikely to tolerate a ‘carbon- first’ abatement strategy while it continues to breathe noxious air.
Adams comments:
“I have never heard of a public protest in China against carbon dioxide emissions. CO2 is a major concern for Western NGOs with offices in Beijing but it’s a non-issue for Chinese citizens and environmentalists at the grassroots.”
Also, the measures China wants to take to deal with pollution - “scrubbers” on power plants, for example will actually increase CO2 because they are more energy-intensive.
The solution to this apparently insoluble conflict of interests is very simple. China will be allowed by the Western negotiators to do and say whatever it wants because China has them by the balls and there’s not a damn thing they can do about it.
The apparent contradiction between what the West wants and what China’s leadership needs is easily resolved. China’s leadership knows that what China says to the West is more important than what China does, absolving it of the need to make any binding commitment to reduce its carbon dioxide emissions. China also knows that Western leaders’ have no firm expectation of concrete commitments in Paris. Rather, their paramount goal is to maintain face at the Paris talks, which would collapse without China’s presence.
Not that we couldn’t have seen this coming. We reported on this a few weeks ago in a piece entitled China shows how much it cares about climate change: with a single upraised finger.
Adams’s report is worth reading in full not just because of the fascinating light it casts on the Chinese, their economy, their corruption, their political mindset and the tensions between the populace and the Communist party but also because of the very basic fact it underlines about Paris - and about all future COP negotiations.
Where international global warming negotiations are concerned, China and developing nations like India, which is similarly reluctant to sacrifice economic growth for meaningless green targets - wears the trousers.
Even if China believed in keeping to emission targets, which it doesn’t, its officials are so corrupt, uninterested and growth-driven they would never police them.
China is leading demands from developing nations that the Western nations pay them $100 billion annually into a climate fund - and after 2020 - contribute 1 percent of their GDP to compensate them for the damage allegedly caused by their years of industrialization. This won’t happen. In return, nor will the developing nations halt or hamper their economic growth for the sake of green flag waving.
So it will be stalemate. Any agreement reached in Paris will be meaningless and toothless. And thank goodness for that.
Because the vested financial and political interests are too great for the alarmists to drop.
In regard to your Dec. 2 editorial “We’ll Always Have the Illusions of Paris”:
Concerning illusions, we will always have the illusions of global warming, too, because the vested financial and political interests are too great for the alarmists to drop. Their illusions are great: Sea level rise is going to be catastrophic despite the top sea level expert, Stockholm geologist Nils-Axel Moerner, saying that is “the greatest lie ever told”; Arctic ice is melting despite its 5% increase in the last nine years; the Ross Ice Shelf in Antarctica is failing despite the increased ice pack there over the past 15 years; extreme weather events will increase because of global warming despite cyclonic activity falling to a 30-year low after Rita and Katrina in 2005, despite tornado activity trending down for 50 years, and despite the U.N. IPCC concurrence that extreme events are not increasing; global warming is caused by increased carbon dioxide atmospheric concentrations despite the U.N.’s model signature for this to occur, a hot spot 10-12 kilometers above the tropics, has never been found, despite those concentrations being much higher though geologic history, at times during glacial periods, and despite the increase in carbon dioxide concentrations over the past 17 years not causing Earth temperatures to rise; temperatures are rising quickly despite satellite data showing no temperature increase since 1998.
These are the lies alarmists say need to be mitigated immediately or there will be catastrophe. The immediacy is needed, of course, before the misinformed populace learns the truth. Perhaps alarmists should abide by their own precautionary principle and not wreck our economy entirely before the science is settled, which it definitely is not.


