Jul 07, 2022
Fast-track transition BACK to electric vehicles - but are we ready and at what cost?
Joseph D’Aleo CCM
You may be surprised to find an electric vehicle isn’t a new concept. In the early 1800s, inventors around the world began building electric-powered buggies. In 1890, William Morrison built the first electric car in the U.S. The car could go 14 miles per hour and fit six people. Karl Benz in 1885 invented the first gas-powered car, which he later received a patent for in 1886. Benz’s first car had three wheels, looked much like an elongated tricycle and sat two people.

Four-wheeled gas-powered cars were later introduced in 1891. That marked the beginning of the vehicular evolution in America. But there was one problem with early electric vehicles. People were interested in owning them, but the elaborate machines were too expensive for the middle class.
It wasn’t until Henry Ford’s 1908 Model T that automobiles started to resemble what we’re familiar with today. Thanks to Ford’s invention of the assembly line, the gas-powered Model T could be mass-produced and became affordable for the general population.
It was Henry Ford’s mass-produced Model T that dealt a blow to the electric car. Introduced in 1908, the Model T made gasoline-powered cars widely available and affordable. By 1912, the gasoline car cost only $650, while an electric roadster sold for $1,750.

Other developments also contributed to the decline of the electric vehicle. By the 1920s, the U.S. had a better system of roads connecting cities, and Americans wanted to get out and explore. With the discovery of Texas crude oil, gas became cheap and readily available for rural Americans, and filling stations began popping up across the country. So many people began driving gasoline cars. In comparison, very few Americans outside of cities had electricity at that time and electric vehicles all but disappeared by 1935.
Fast forward to the late 1960s and early 1970s. Soaring oil prices and gasoline shortages—peaking with the 1973 Arab Oil Embargo—created a growing interest in lowering the U.S.’s dependence on foreign oil and finding homegrown sources of fuel.
Automakers began exploring options for alternative fuel vehicles, including electric cars. For example, General Motors developed a prototype for an urban electric car American Motor Company produced electric delivery jeeps that the United States Postal Service used in a 1975 test program. Even NASA helped raise the profile of the electric vehicle when its electric Lunar rover became the first manned vehicle to drive on the moon in 1971.
Yet, the vehicles developed and produced in the 1970s still suffered from drawbacks compared to gasoline-powered cars. Electric vehicles during this time had limited performance—usually topping at speeds of 45 miles per hour—and their typical range was limited to 40 miles before needing to be recharged.
Fast forward again—this time to the 1990s. In the 20 years since the long gas lines of the 1970s, interest in electric vehicles had mostly died down. But new federal and state regulations helped create a renewed interest in electric vehicles in the U.S. Most automakers are focusing on electric and hybrid gas and electric offerings.
EV CARS ARE APPEALING BUT THERE ARE MAJOR CHALLENGES
There are now about 290 million cars registered in the U.S. (here). As of 2020, there were over a million EVs (Electric Vehicles) on the US road (Argonne National Laboratory, 2021). The Edison Electric Institute projected in 2018, that EV stock will reach 18.7 million by 2030.
EVs clearly have benefits. EVs often cost less to maintain because they have fewer and simpler components. They are very quiet. Most provide an exhilarating acceleration experience, thanks to the instant power on tap from the electric motor, or motors. The biggest obstacles for most drivers in addition to the high relative cost are challenges related to the charging.
EVs take a long time to charge. If you don’t drive more than 40-50 miles a day, plugging into a standard “Level 1” 110 volt charger every night could provide enough energy for your daily commute. The standard Level 1 chargers with purchase of an EV add about 2-5 miles of range per hour of charging according to the Department of Energy.
Faster Type 2 charging systems are usually available ‘nearby’ or at your car dealer. Level 2 charging stations have expanded across the country (see).
If not, you can arrange to have level 2 charging station installed at your home. According to the DOE, “the price of Level 2 residential EVSE varies, but typically ranges from $500 to $2,000 before installation and state or utility incentives. Typical charging time for a Level 2 EV charger is around 8 and 10 hours from near empty to full while the average standard Level 1 EV charger will take up to 20 hours to fully charge.”
Kip Hansen warns here “If you need to charge more than 1 car at night home, you may be looking at the rather expensive job of replacing your electrical system from the pole to the main panel (see illustration far above) - new service drop, service point, service entrance wires, service meter (usually supplied by your power company), probably a new service disconnect, and a new service panel. Cost? Up to $5,000.”
The technology will improve with time. DC Fast Electric Charging Stations recharge an EV at a rate of 3 to 20 miles of range per minute. 80% charge in only 20 minutes. But still, full charge may take 1 hour. But importantly, electricity prices will no doubt skyrocket if the move away from hydrocarbon fuels is mandated for automobiles, trucks, businesses, industries and homes.
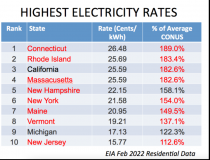
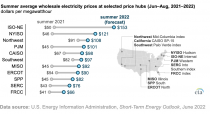
And you should be aware that as the EIA shows, the cost for electricity varies by state, with the Northeast and California having substantially higher rates than the national average and will feel the pain first and most.
VACATION TRAVEL STRESSES
Right now, EVs are not ideal for drivers with long commutes or even more so for taking long trips - to see Grandma at Thanksgiving, to go to Florida to escape the cold in winter, or a long summer vacation. Planning when and where to charge is a challenge part of any long-distance travel plans. Now with gas cars, we know when we need to exit and fill up. But with EVs, the scarcity of charging stations makes pre-planning a necessity.
Moreover, charging can take hours. Very cold or hot temperatures and cabin climate conditioning reduce driving range and needs to be factored in. Research for the AAA found that when outside temperatures reach 95 degrees F during the summer and AC is used in a vehicle, the driving range can decrease by around 17% and using the heater in an electric vehicle in extreme cold, can reduce the driving range up to 41%. See stories on disappointing range and recharge scarcity disruptions here and here.
CASE STUDY EXAMPLE
My daughter, her husband and three granddaughters took an 11-day post COVID vacation this June from New England south to Florida in a carefully planned trip that covered 3,100 miles in 12 states with stays in 7 hotels in 5 states, visits to 9 parks, amusement park, kayak trips. They filled gas tank 11 times for a total fill time of 55 minutes often at the planned stop or along the highway mostly timed for a meal.
If they had an EV vehicle given the time of year with 90 degree heat, they would have had to stop 19 times to charge and the time to charge could exceed 93 hours! That does not include waiting time for a station. Finding charging stations would require a lot of planning. Even if the temperatures were not extreme (fall or spring weather), the charging would be required 16 times for a total over 77 hours. Some vacation.
For this family adventure, a hybrid would make more sense.
Ironically recall that cheap gasoline and the unavailability of electricity outside big cities a century ago led to the demise of electric vehicles and the gasoline car boom. The charging challenges will lead to ‘resistance’ unless addressed. And the need for truck and off-road (farm, construction, mining, marine, etc) fuel will remain.
Any attempt at a transition to electric in trucking is a huge challenge. 15.5 million trucks operate in the U.S.. Of this figure 2 million are tractor trailer. The United States economy depends on trucks to deliver nearly 70 percent of all freight transported annually in the U.S., accounting for $671 billion worth of manufactured and retail goods transported by truck in the U.S. alone. Add $295 billion in truck trade with Canada and $195.6 billion in truck trade with Mexico. Trucks alter routes to avoid potential storm impacts. Now they will have consider charging challenges. As with every other policy, they are taking steps before technology or needed supplies are ready.
Importantly, Rivian Automotive in a Wall Street Journal story warned that the industry could soon face a shortage of battery supplies for electric vehicles “90% to 95% of the supply chain does not exist.”
BUT WE ARE TOLD “WE MUST ACT NOW TO STOP CLIMATE CHANGE”
The rationale for high gas costs and now is to drive the transition to electric vehicles. They claim that is required to reduce greenhouse related warming and extreme weather.
In the Research Report entitled: On the Validity of NOAA, NASA and Hadley CRU Global Average Surface Temperature Data & The Validity of EPA’s CO2 Endangerment Finding, Abridged Research Report, Dr. James P. Wallace III, Dr. (Honorary) Joseph S. D’Aleo, Dr. Craig D. Idso, June 2017 (here) provided ample evidence that the Global Average Surface Temperature (GAST) data was invalidated for use in climate modeling and for any other climate change policy analysis purpose.
”The conclusive findings of this research are that the three GAST data sets are not a valid representation of reality. In fact, the magnitude of their historical data adjustments, that removed their cyclical temperature patterns, are totally inconsistent with published and credible U.S. and other temperature data. Thus, it is impossible to conclude from the three published GAST data sets that recent years have been the warmest ever - despite current claims of record setting warming.”
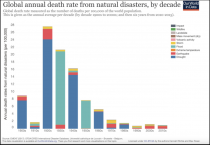
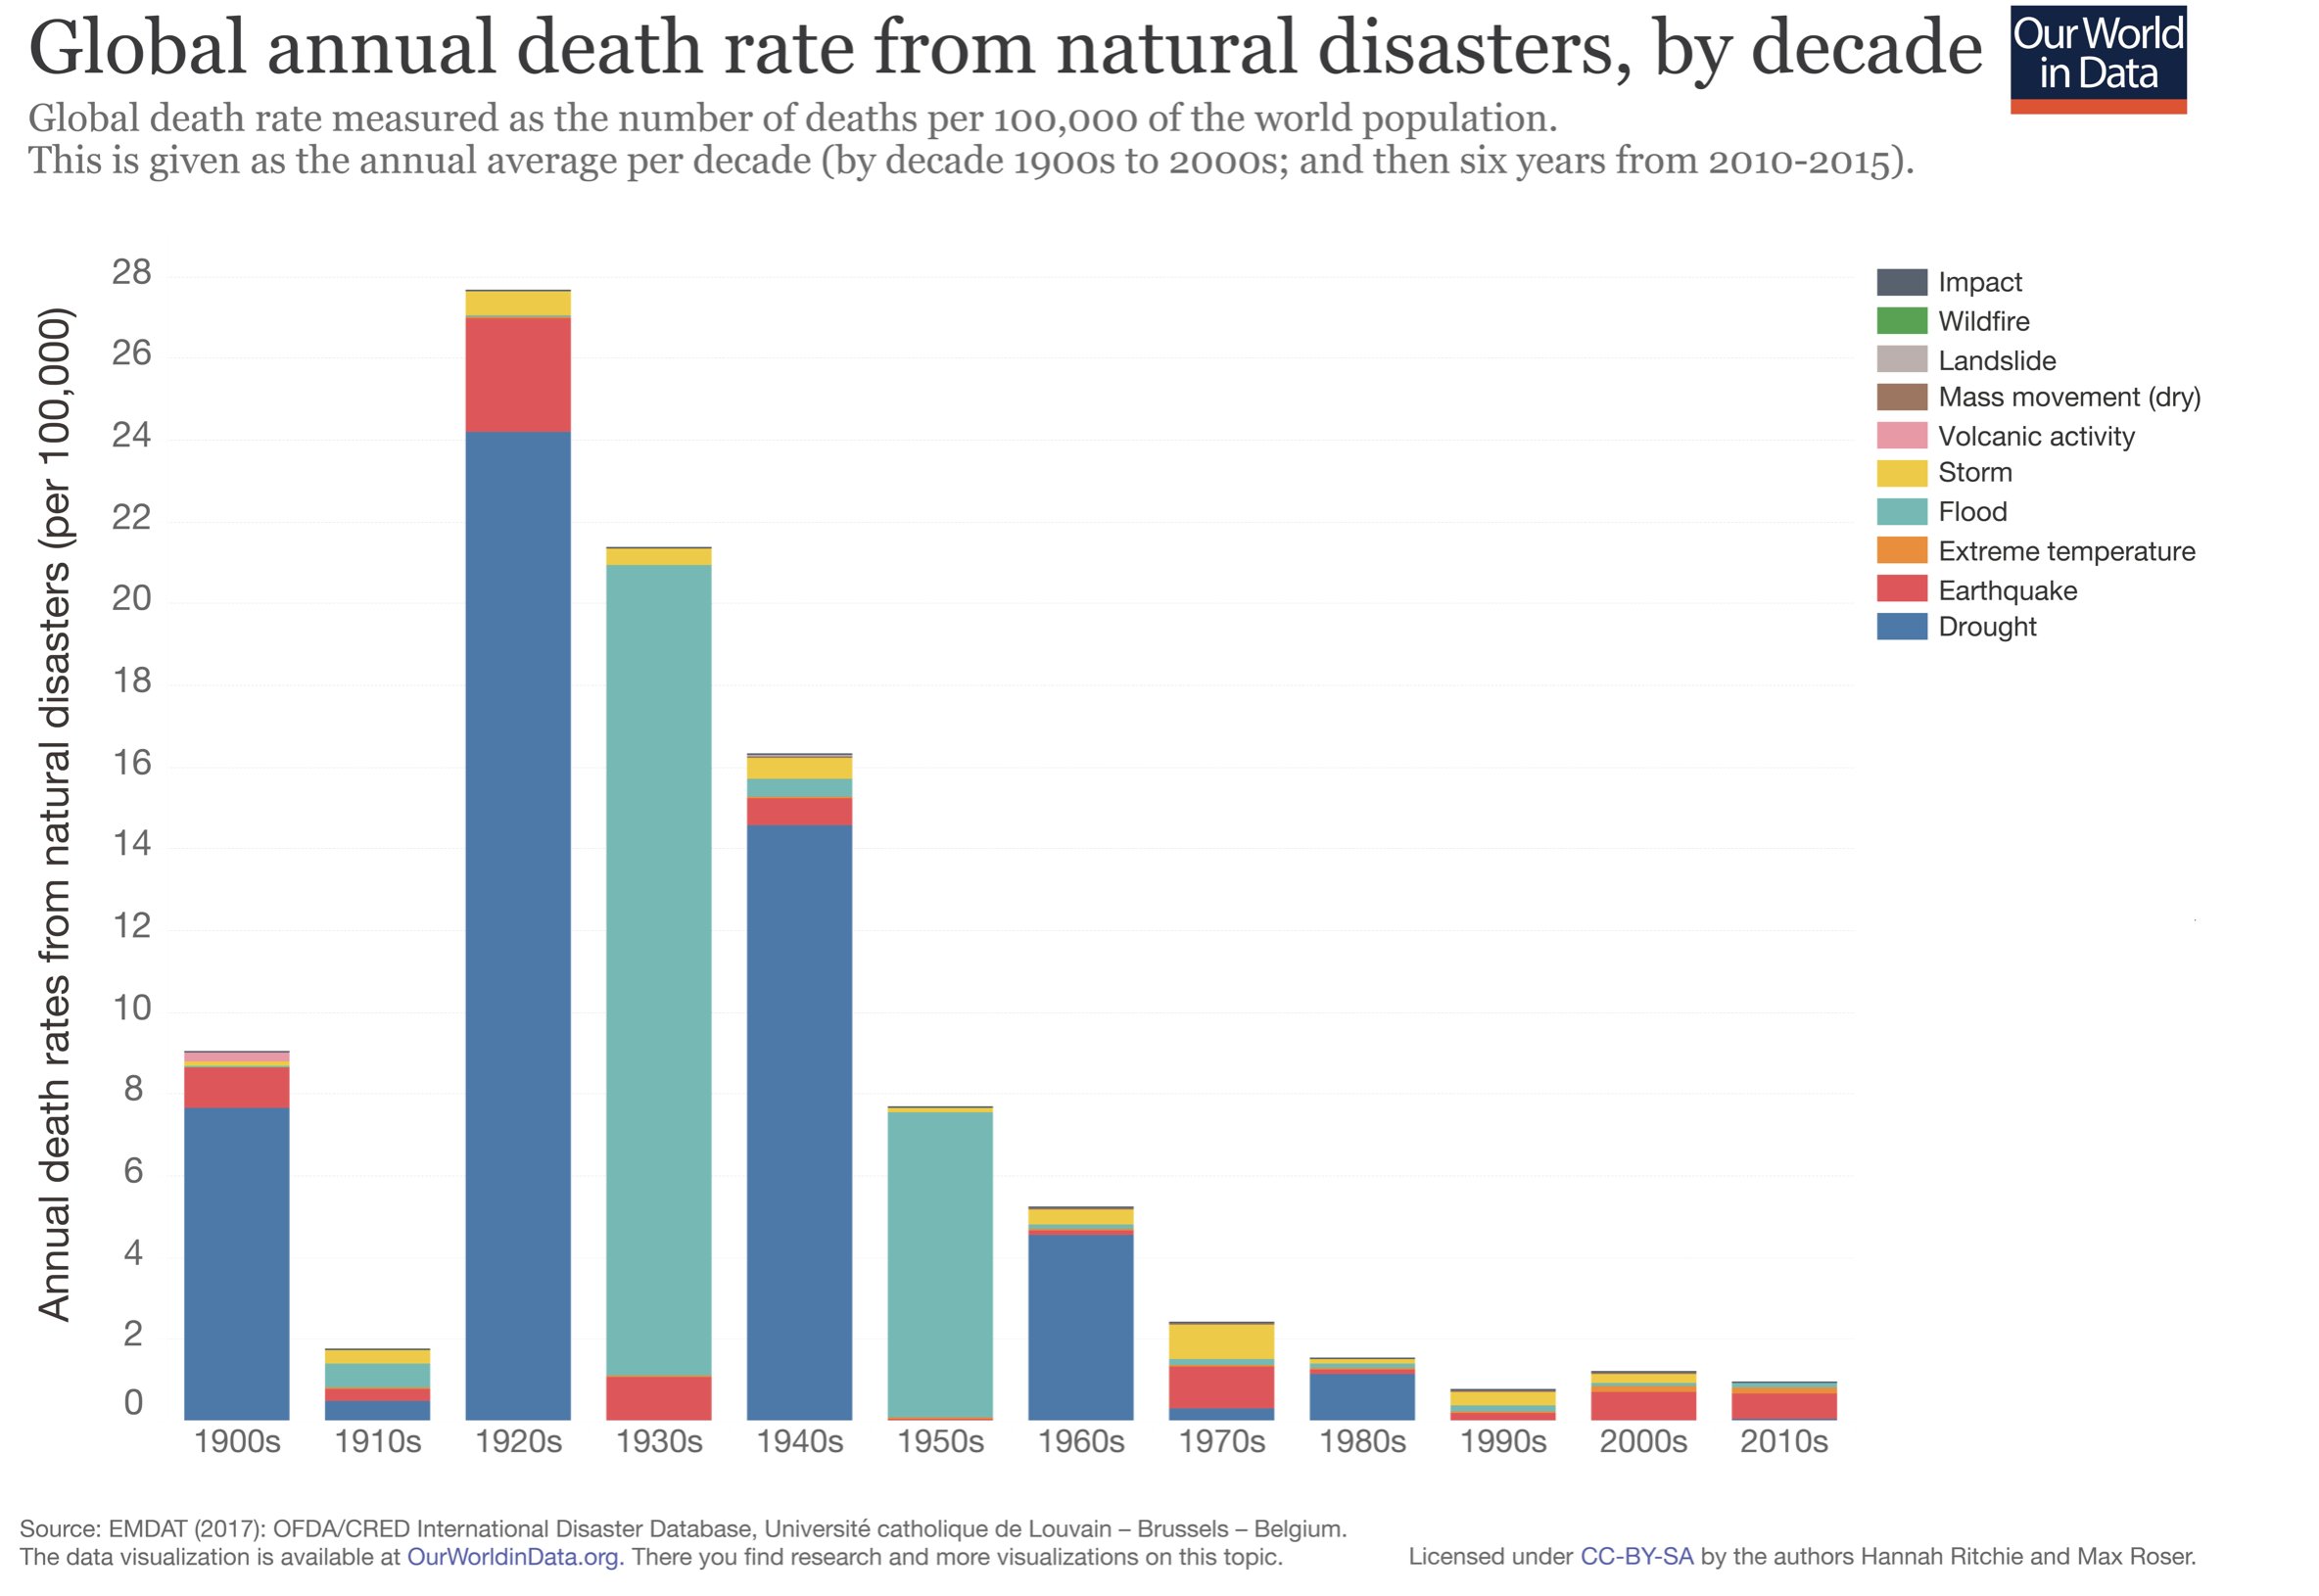
See here how all the extremes listed as man caused are explained by natural factors here. The deaths have declined over the last century (EMDAT 2017) not increased as alleged.
THE PRESCRIBED POLICY CHANGES ARE THE REAL DANGERS
For one, instead of diminishing costs and emissions, the changes will cause all forms of energy to skyrocket and it is likely as we see in Europe, it will force power companies to utilize coal as fracking bans limit the availability of clean natural gas. Electricity prices would triple by the end of this decade.
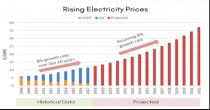
Moreover, the following analysis shows such a forced transition would instead force an increase in the number of power generation and power stations (first guess 25-35%) just to provide the energy for EVs. This would accelerate and magnify price rises.
RENEWABLES ARE NOT DEPENDABLE ENOUGH TO LIGHT THE WAY
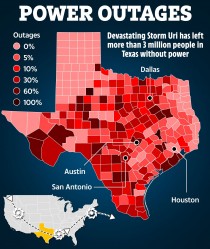
With the war on fossil fuels, unreliable wind and solar can’t fill the gap. We saw a preview of that in Texas in 2021 when sub-zero cold and snow hit and knocked out wind power.
In many European nations they learned their lessons from sitting in the cold and dark too often in winter when ‘intermittents’ could not meet demand. They built coal plants for addressing base load demand. They then moved to clean natural gas imported from Russia. A return to coal burning and nuclear plants are planned in the upcoming winter because over interruption of natural gas due to the Russian/Ukraine war. Europe has been down the green path more aggressively and some countries are realizing they may have put the cart before the horse in thinking wind and solar could eliminate hydrocarbon fuel use. They are planning coal usage this winter to keep the lights on in cold outbreaks.
The elitists can afford ways to keep the lights on and house warm. Obama we are told has sought approval to install 3 propane tanks (totaling 2,500 gallons) at his Martha’s Vineyard Estate.
What is your back-up when the lights go out. How far can you drive in your new EV with no way to recharge? If we go down the path the New World Order religion want us to go, the rest of us may find we must go back to candles and horse-drawn carriages.
Resources: ENERGY.GOV here and here, IDRIVESAFELY here. PIWINENERGY.COM here
Jun 30, 2022
Consumer Advocate Warns: Your Electric Bill Could Balloon by 50 Percent (FYI-just the start)
by Damien Fisher
Already paying some of the highest energy costs in the country, New Hampshire ratepayers will soon be paying a lot more. According to a filing with the Public Utilities Commission, Liberty Utilities is seeking approval for an increase in the default residential energy rate from 8.393 cents per kilowatt-hours to 22.223 cents per kilowatt-hours. Donald Kreis, with New Hampshire’s Office of Consumer Advocate, said the net effect of the charge will be that Granite Staters who use Liberty can expect to pay nearly 50 percent more for electricity when the new rate goes into effect in August. “That means a typical bill for a residential electric customer of Liberty Utilities will go up by nearly 47 percent from its current level,” Kreis said on Twitter.
Granite Staters already pay the seventh-highest residential electricity rates in the nation.
Enlarged
Liberty has about 43,000 electric customers in New Hampshire. Kreis said Eversource, New Hampshire’s main electric supplier, is expected to file for a similar rate increase before the PUC soon. “To my knowledge, these huge default service prices are unprecedented since NH broke up its vertically integrated electric utilities more than 20 years ago,” he wrote on Twitter. He said on Twitter the reason for the rate increases is the rising cost of natural gas, which electric supplies use to generate the power needed. “In New England, we rely on natural gas for the majority of our electricity. Natural gas futures prices for the coming winter have hit $30 per mmBTU. Wholesale electric suppliers have priced those natural gas increases into their bids,” he wrote.
Reached Wednesday, Kreis said New Hampshire doe not have a robust natural gas market for homeowners, the state uses a lot of natural gas to fuel power plants, like the Granite Ridge power facility in Londonderry. Unitil, one of the state’s two other electric utilities, has rates currently at around 10.3 cents per kilowatt-hour and is on a different rate schedule than the other two companies. New Hampshire Electric Cooperative, the second-largest utility in the state, expects to adjust its power supply rate later this summer.
“It’s safe to say that we’re seeing the same dynamics playing out in the New England electric wholesale market. Costs for summer supply are up dramatically from last year, driven primarily by huge increases in the price of natural gas, which is used to generate about half of the power in New England,” said NHEC Communications Administrator Seth Wheeler.
The rate increases coming from Liberty and Eversource far outpace predictions from the U.S. Energy Information Administration. The winter electricity forecast saw a price rise in New England closer to 16 percent, not 47 percent. “We expect the summer increases in retail residential electricity prices will range from an increase of 2.4 percent in the West South-Central region to a 16.1 percent increase in New England,” the EIA forecast states. Kreis said utilities buy power from suppliers in six-month increments, and the rate increases reflect the increased prices they are paying for power under the new six-month contracts, which will start in August. There won’t be another chance to change the rates until next year, meaning prices will remain high until 2023.
New Hampshire’s elected officials have taken note. On Wednesday, Gov. Chris Sununu and Department of Energy Commissioner Jared Chicoine announced that, for the first time ever, the state plans to use Low Income Home Energy Assistance Program (LIHEAP) funding to help struggling households pay for summer electricity costs. The funding will be routed through the New Hampshire Fuel Assistance Program for pre-qualified, low-income households.
“We are allocating $7.5 million in funds to provide low-income families with assistance to help cool their homes this summer,” said Governor Chris Sununu. “As a result of unprecedented Washington spending that has unleashed record inflation, uncertainty in the energy market following President Biden’s anti-domestic energy policies, and the ongoing conflict in Ukraine, energy prices are skyrocketing across the country. While there is not much that states can do to rebuff federal inaction, we are doing what we can at the state level to ease the burden on low-income families.”
Details of the plan, including the exact amount of funding available per family, are still being developed. “The Department of Energy is working diligently with stakeholders to provide summer electric bill assistance to currently-eligible LIHEAP customers,” said Department of Energy Commissioner Jared Chicoine. “We are hopeful that this assistance will help provide some relief to consumers in these challenging times.” Kreis said in the short term consumers should shop around for competitive electric suppliers and lobby their municipalities to enter into power aggregation deals to lower the costs. They can also apply for the state’s energy efficiency programs. New Hampshire energy consumers are looking at a tough winter ahead, too. Home heating oil is selling for close to $6 a gallon, up from about $4.50 a gallon average this past winter, and $3 a gallon from the prior season. Relief is a long way off, as the EIA expects the 2023 winter season to see heating oil back down to under $4 a gallon.
Craig Stevens, a spokesman with the energy and business coalition, Grow America’s Infrastructure Now, said Democratic environmental and energy policies, like restricting domestic energy production, have pushed prices higher.
“The rise in electricity prices is, unfortunately, much too predictable considering the energy policies of the past two Democratic administrations promised - and have since delivered - Americans. Between Presidents Obama and Biden, they have forced the shuttering of power plants across the country, made the siting and construction of transmission lines virtually impossible, stopped pipeline expansion, and closed off domestic energy production,” Stevens said. “We need more than vapid rhetoric, empty promises, and finger-pointing; we need a comprehensive - all of the above - energy policy that recognizes our current energy needs and the growing energy needs of our increasingly electrified economy.”
With prices likely to remain high through to next year, Kreis said New Hampshire ultimately needs to diversify how it generates power in order to avoid another year like 2022.
See more on electricity prices here.
Jun 30, 2022
‘Ten Policies to Unleash American Energy and Fuel Recovery’ (API gets nine of ten right)
By Rob Bradley. Master Resource
” it is time for an energy awakening - for the natural gas and oil supply chain and the government at all levels to open a new era of working together to ensure that essential energy resources are unlocked; to encourage investment opportunities and accelerate infrastructure development; and to strengthen global energy security, affordability and reliability.” (API, below)
The American Petroleum Institute (API) has represented the larger integrated oil companies since its founding just over a century ago. Much of its early mission was to standardize machinery specifications as well as accounting practices to modernize and streamline the industry. But API’s other major function has been politics, which became so great that the trade group moved from New York City to Washington, D.C. in 1969.
Often, the self-interest of the majors was the free market, particularly in the troubled 1970s. But API supported state-level market-demand proration in the 1920s and 1930s forward, and today it supports government subsidies for what its members can do in the name of climate change, such as carbon capture and storage. In fact, API gave up the moral high ground and has been playing defense since ceding the climate debate to the activist Left.
That has now changed. The global energy crisis, and energy problems at home, have given oil and gas a wide opening. The radical anti-fossil-fuel agenda of Joe Biden has citizen voters up in arms - and the oil and gas industry has the answers that Obstructionist Biden does not.
Thus API finds itself on offense and, to some extent, off the greenwash climate-alarmism bandwagon.
So it was of interest to review API’s much advertised 10-point plan to right-size the industry to meet high and growing domestic and world demand for oil and natural gas. There is no Peak Oil or Peak Gas; there is an Outsized Government that is artificially constraining a free-market industry.
Nine of the ten proposals below are free-market-oriented. But #7, mentioned here (yellow), is not:
Advance Lower Carbon Energy Tax Provisions
Congress should expand and extend Section 45Q tax credits for carbon capture, utilization, and storage development and create a new tax credit for hydrogen produced from all sources.
Plank #7 should be changed to:
End Preferential Tax Credits
Congress should should not expand or extend Section 45Q tax credits for Carbon Capture and Storage. Congress should not extend subsidies for Electric Vehicles and should eliminate the Production Tax Credit (PTC) for wind power and Investment Tax Credit (ITC) for solar.
-------
10 for 2022 Manifesto
America’s core promise - the freedom to be, to create, to aspire - drives the opportunity for all Americans to have better lives and reach new heights. American energy empowers American opportunity. Given today’s global unrest and economic uncertainty, this has never been more true.
Americans have been here before, with fuel shortages in the 1970s serving as a vivid reminder. Today, energy demand is outstripping supply. Inflation is the highest it has been in 40 years. Fuel prices have soared. Putin’s brutal aggression in Ukraine has united the West against his regime and the energy he once sold to Europe. It is all connected - and alarming. But a solution is beneath our feet.
Our nation is blessed with abundant natural gas and oil that is the envy of other countries. It is a foundation of our economy, supporting more than 11 million U.S. jobs, and makes our American way of life possible. It has revived Main Street storefronts, restored U.S. manufacturing, driven job creation and bolstered our nation’s ability to compete. It has made America safer in a turbulent world.
Given global circumstances, it is time for an energy awakening - for the natural gas and oil supply chain and the government at all levels to open a new era of working together to ensure that essential energy resources are unlocked; to encourage investment opportunities and accelerate infrastructure development; and to strengthen global energy security, affordability and reliability.
Bottom line: Washington policymakers must confront the global mismatch between demand and supply that has driven higher fuel prices by supporting greater U.S. production. To address the growing crisis we face, Congress and the President must support energy investment, create new access and keep regulation from unnecessarily restricting energy growth. The world is calling out for energy leadership. America can and should step up fast.
API’s 10-point plan to restore U.S. energy leadership and help fulfill our great nation’s core promise.
Lift Development Restrictions on Federal Lands and Waters
The Department of the Interior (DOI) should swiftly issue a 5-year program for the Outer Continental Shelf and hold mandated quarterly onshore lease sales with equitable terms. DOI should reinstate canceled sales and valid leases on federal lands and waters.
Designate Critical Energy Infrastructure Projects
Congress should authorize critical energy infrastructure projects to support the production, processing and delivery of energy. These projects would be of such concern to the national interest that they would be entitled to undergo a streamlined review and permitting process not to exceed one year.
Fix the NEPA Permitting Process
The Biden administration should revise the National Environmental Policy Act (NEPA) process by establishing agency uniformity in reviews, limiting reviews to two years, and reducing bureaucratic burdens placed on project proponents in terms of size and scope of application submissions.
Accelerate LNG Exports and Approve Pending LNG Applications
Congress should amend the Natural Gas Act to streamline the Department of Energy (DOE) to a single approval process for all U.S. liquefied natural gas (LNG) projects. DOE should approve pending LNG applications to enable the U.S. to deliver reliable energy to our allies abroad.
Unlock Investment and Access to Capital
The Securities and Exchange Commission should reconsider its overly burdensome and ineffective climate disclosure proposal and the Biden administration should ensure open capital markets where access is based upon individual company merit free from artificial constraints based on government-preferred investment allocations.
Dismantle Supply Chain Bottlenecks
President Biden should rescind steel tariffs that remain on imports from U.S. allies as steel is a critical component of energy production, transportation, and refining. The Biden administration should accelerate efforts to relieve port congestion so that equipment necessary for energy development can be delivered and installed.
Advance Lower Carbon Energy Tax Provisions
Congress should expand and extend Section 45Q tax credits for carbon capture, utilization, and storage development and create a new tax credit for hydrogen produced from all sources.
Protect Competition in the Use of Refining Technologies
The Biden administration should ensure that future federal agency rulemakings continue to allow U.S. refineries to use the existing critical process technologies to produce the fuels needed for global energy markets.
End Permitting Obstruction on Natural Gas Projects
The Federal Energy Regulatory Commission should cease efforts to overstep its permitting authority under the Natural Gas Act and should adhere to traditional considerations of public needs as well as focus on direct impacts arising from the construction and operation of natural gas projects.
Advance the Energy Workforce of the Future
Congress and the Biden administration should support the training and education of a diverse workforce through increased funding of work-based learning and advancement of STEM programs to nurture the skills necessary to construct and operate oil, natural gas and other energy infrastructure.
Final Comment
API can do more, building on the above plan (except for Plank #7 as it now stands). The writings, lecturing, and advocacy of Alex Epstein and Robert Bryce should be 1) acknowledged for setting up the Great Reversal in policy debate and action that is evident today and 2) promoted to seize the moral high ground in the climate/energy debate.
Jun 15, 2022
Elena Kagan’s Blind Love Of The Expertocracy: SCOTUS Slaps The EPA?
By William. M. Briggs July 5, 2022
SCOTUS ruled 6-3 that, in effect, without Congressional authorization, the EPA does not have the power to regulate carbon dioxide. Justice Elena Kagan dissented.
Kagan opened her dissent thus (whole opinion; with my paragraphification for screen readability):
Climate change’s causes and dangers are no longer subject to serious doubt. Modern science is “unequivocal that human influence” - in particular, the emission of greenhouse gases like carbon dioxide -"has warmed the atmosphere, ocean and land.” [Cites IPCC] ... The rise in temperatures brings with it “increases in heat-related deaths,” “coastal inundation and erosion,” “more frequent and intense hurricanes, floods, and other extreme weather events,” “drought,” “destruction of ecosystems,” and “potentially significant disruptions of food production.” [Cites, of all things, a case in which this was quoted.]
If the current rate of emissions continues, children born this year could live to see parts of the Eastern seaboard swallowed by the ocean. See Brief for Climate Scientists as Amici Curiae 6. Rising waters, scorching heat, and other severe weather conditions could force increases in “mass migration events[,] political crises, civil unrest,” and “even state failure.”
So Kagan has bought and believes, seemingly sincerely, the failed predictions of global warming, which she calls “climate change”. This is her adopted opinion, provided her by climate Experts, who claim there is no “serious doubt” about their theories.
We have seen many times that her (or her ‘Experts’ quoted predictions of doom are false. There have not been an increase, but a decrease, in floods. Same for drought. There is no “destruction of ecosystems.” And just last week a paper appeared- a peer-reviewed paper in the regime-approved journal Nature, going by the name “Declining tropical cyclone frequency under global warming” - which shows the number of tropical cyclones have been decreasing, not increasing. quoted predictions of doom are false. There have not been an increase, but a decrease, in floods. Same for drought. There is no “destruction of ecosystems.” And just last week a paper appeared- a peer-reviewed paper in the regime-approved journal Nature, going by the name “Declining tropical cyclone frequency under global warming” - which shows the number of tropical cyclones have been decreasing, not increasing.
Here’s a picture from that paper (ignore the straight and red lines, which are models and not the data):
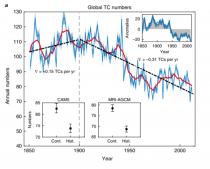
Enlarged
So Kagan’s suppositions about the dooms of global warming are false, and known to be false with only a little investigation. Which she did not make. Nor did Wise Latina, and nor did the other guy who’s now retired and will be quickly forgotten. Both signed Kagan’s dissent.
Their non-curiosity and blind acceptance of the Expert Consensus is point one. And really is our only point, as we’ll see.
Under the Clean Air Act, as Kagan writes, Congress gave power to the “EPA to regulate stationary sources of any substance that ‘causes, or contributes significantly to, air pollution’ and that “may reasonably be anticipated to endanger public health or welfare.”
As we know, EPA called carbon dioxide, the basis of almost all life on earth, the very stuff of your breath, the food of plants, “pollution”. And started to regulate it. Scientifically, this is like the American Medical Association saying “not all women have cervixes”, and allowing the AMA to regulate the English language.
Do people forget, or maybe they never knew, that CO2 is plant food? And not only plant food, but the plant flood. Back in olden days, they used to teach photosynthesis. No longer? Remove CO2 and plants die. Then you die.
So what the EPA did in trying to regulate CO2 was ridiculous - unless you really do believe global warming, a.k.a. “climate change, is an “existential crisis.” As Kagan, Wise Latina, and Gone Guy believe, or say they do. But which all observations show is not so.
Models, on the other hand, show the “existential crisis” is true. And all models only say what they are told to say. So models are told to say that “climate change” is an “existential crisis.” Experts told models to say this.
Experts, therefore, value models over observation. The Deadly Sin of Reification.
The real problem, then, is letting Experts make decisions based on models which are beautiful, to Experts, but which make lousy predictions. Experts are trusted too much.
Even if you think not, and still believe the models, nothing follows from them. That is, no policy is suggested, implied, or necessary because of the models. Not one. It is separately true that all policies, suggested from any source, have consequences, which may be known to greater or lesser extent - their uncertainty in them also are models.
It is scientism, a fallacy, to say Experts who wrote climate models also know what is best to do about the weather. Scientifically, it is like saying the CDC knows what is the best rate to pay for rent during a disease outbreak. Which they did say. And were rebuked for saying. A rebuke which they ignored. Which may happen here with the EPA, too.
Therefore, even if you believe the models, which stink, a fact that requires only minor effort to check, it does not follow the Experts who created those models, including agents in the EPA, know what is best to do about model predictions.
That power should fall to Congress, and to state and local governments, who have that mandate.
In other words, the Expertocracy, which was in part struck down and which Kagan dissented against, is based on two false assumptions. The first is that Expert models have skill. They do not. And the second, which is independent, is scientism, which is that scientists with expertise in one are are equipped with greater senses of good and evil on all subjects, which is absurd.
Kagan, though, embraces the Expertocracy. She said (her emphasis):
Members of Congress often don’t know enough - and know they don’t know enough - to regulate sensibly on an issue. Of course, Members can and do provide overall direction. But then they rely, as all of us rely in our daily lives, on people with greater expertise and experience. Those people are found in agencies. Congress looks to them to make specific judgments about how to achieve its more general objectives. And it does so especially, though by no means exclusively, when an issue has a scientific or technical dimension. Why wouldn’t Congress instruct EPA to select “the best system of emission reduction,” rather than try to choose that system itself?
Second and relatedly, Members of Congress often can’t know enough - and again, know they can’t - to keep regulatory schemes working across time. Congress usually can’t predict the future - can’t anticipate changing circumstances and the way they will affect varied regulatory techniques. Nor can Congress (realistically) keep track of and respond to fast-flowing developments as they occur.
Kagan is quite wrong. For all the reasons we discussed. Congress (as sick as that institution is) does know enough, and it knows vastly more than weather Experts about law. Because it knows, or is supposed to, what laws are, and what laws should do, and what the consequence of laws are. Climate or weather Experts do not. Congress can consult with Experts: “If we pass this law, what are the bounds of uncertainty on this particular weather-effected thing?” That is sensible. But it is rank foolishness to trust weather Experts to decide what laws are best, even if you by subterfuge call those laws “regulations”. And it even more dangerous to trust people who have something to gain, as Experts do, to decide what is “best” to do.
The impetus for the Expertocracy, and the faith in it, is there in Kagan’s words. She reasons, in effect, that Experts know more than anybody else on their subjects of expertise, therefore we have no right to interfere with their decisions on any subject.
It is a bad argument because Experts don’t always know best about their own subjects, as we see now everywhere. And even if Experts do know best about their subjects, they don’t know what is best to do about them.
Buy my new book and learn to argue against the regime: Everything You Believe Is Wrong.
Jun 06, 2022
Blame-game: Hochul Blames Utilities for Costs of State Climate Policies
By James E. Hanley on his blog
Governor Hochul may be in support of the Climate Leadership and Community Protection Act’s (CLCPA) goals, but she clearly doesn’t want anyone to link her to its costs - certainly not now, with a gubernatorial primary looming.
How else to explain her attack on utility companies asking the Public Service Commission (PSC) to allow rate increases to cover - among other business costs - the cost of buying clean energy and promoting energy efficient homes?
Just months ago. Hochul was eager to approve two expensive renewable energy projects - the Champlain Hudson Power Express and Clean Path New York, which will bring hydro and wind energy to New York City. It was made clear at the time that the costs of those projects would be socialized to all New Yorkers through utility rate hikes, including to upstaters who won’t get any of the energy.
Hochul also supports expensive electrification of buildings, including installation of heat pumps.
But now she objects to utility companies New York State Electric & Gas (NYSEG) and Rochester Gas and Electric (RG&E), both subsidiaries of AVANGRID, pursuing rate increases to fund their own programs that in large part support CLCPA goals.
The companies’ plans include supporting NYSERDA’s Empower program by providing free energy audits and efficiency upgrades for low-to-moderate income customers, support for electric vehicle technology, heat pump installation, more connections to emissions-free wind and solar energy, and investments in battery storage.
In addition, the companies need to replace aging infrastructure to prevent blackouts. This is a national problem. Across America the electricity grid is aging and at increasing risk of failure.
All this costs money, but Hochul has declared it “outrageous,” and “unacceptable” to ask upstaters to pay for these efforts to support the state’s climate policies. It’s all too typical of a politician to blame the costs of their own policies on the parties responsible for their implementation.
And as the primary approaches, Hochul’s reaction to the most recent proposed rate hikes is a transparent attempt to distance herself from the consequences of the CLCPA agenda she supports. Her pitch is mainly aimed at upstate voters. But perhaps if upstaters - who already use mostly clean energy -weren’t being asked to help pay to clean up downstate’s dirty energy supply, this rate increase wouldn’t be such a burden on them.
Just how does Hochul expect utilities to pay for achieving the state’s clean energy and efficiency goals? It’s not clear that she understands how businesses actually work. Companies provide a service and customers pay for it. When government makes expensive policies that companies have to comply with, customers still pay for it.
The only alternative is to have the same people pay via taxes, but despite demands from CLCPA supporters, Hochul’s budget largely ignored the problem of paying for the state’s climate policies. That leaves them to be funded by ratepayers, as PSC commissioner John Howard recently warned.
Hochul also made a big deal of demanding that the PSC carefully scrutinize the companies’ request. But that’s what the Commission does by law - regardless of the Governor’s demands. Her grandstanding is neither here nor there as far as the PSC’s job is concerned, but it allows her to look tough on big business. Unfortunately it also raises the specter of political interference with the PSC.
And this from a Governor who pledged to make New York the country’s most business-friendly state.
Major changes like those set in motion by the CLCPA don’t come free. And to be fair, it was Hochul’s predecessor who signed the CLCPA into law. But it’s clear that she doesn’t want to take either the responsibility of rolling it back or the responsibility of finding ways to pay for it. Instead, she’s going for the low-risk, low-leadership, strategy of trying to give the public freebies, and blaming others when the real costs become known.
|

