|
Jun 13, 2008
Final Nail in Hockey Stick Coffin - Hot Climate or Cold, Tree Leaves Stay in Comfort Zone
Agence France-Presse
A new study that shows their internal temperature remains constant at 21.4deg could challenge the way trees are used to determine historical climate data. The internal temperature of leaves, whether in the tropics or a cold-clime forest, tends toward a nearly constant 21.4 degrees Celsius, reports a study released today. It had long been assumed that actively photosynthesising leaves - using energy from sunlight to convert carbon dioxide and water into sugar - are nearly as cold or hot as the air around them.
The new findings not only challenge long-held precepts in plant biology, but could upend climate models that use tree rings to infer or predict past and present temperature changes. For decades, scientists studying the impact of global warming have measured the oxygen isotope ratio in tree-rings to determine the air temperature and relative humidity of historical climates. Oxygen atoms within water molecules evaporate more or less quickly depending on the number of neutrons they carry, and the ratio between these differently weighted atoms in tree trunk rings has been used as a measure of year-to-year fluctuations in temperatures and rainfall.
“The assumption in all of these studies was that tree leaf temperatures were equal to ambient temperatures,” lead researcher Brent Helliker told AFP. “It turns out that they are not.” Helliker and University of Pennsylvania colleague Suzanna Richter turned those assumptions upside down in examining 39 tree species, across 50 degrees of latitude ranging from sub-tropical Columbia to boreal Canada. They compared current observed records of humidity and temperature against the isotope ratios in the trees, and found that tree leaves were internally cooler than surrounding air temperatures in warm climes, and warmer in cool climes. Even more startling was that in all cases the average temperature - over the course of a growing season - was about 21degC. “It is not surprising to think that a polar bear in northern Canada and a black bear in Florida have the same internal body temperature,” because both animals have internal thermostats to prevent overheating or freezing to death, he said. “But to think that a Canadian black spruce and a Caribbean Pine have the same average leaf temperature is quite astonishing,” he added.
Tree leaves keep cool through constant evaporation and reducing sun exposure through leaf angles or reflective qualities. Warmth is gained by decreasing evaporation and increasing the number of leaves per branch. All these tricks should be seen as evolutionary adaptations that help the trees attain a maximum of nutrients through optimal photosynthesis, Helliker said. The fact that part of this adaptation occurs at the level of entire forest canopies, and not just within individual leaves, is one reason direct measurements of tree temperatures have been so hard. The new findings, published in the British journal Nature, are bolstered by a recent study of a mixed species forest in Switzerland based on infrared thermal imaging. Measured across an entire growing season, the forest canopy temperatures were found to be 4degC to 5degC higher than the cool, ambient air in the Swiss Alps.

Jun 13, 2008
Head for the Hills! Creatures Flee Global Warming
By LiveScience Staff
Global warming is forcing 30 species of reptiles and amphibians to move uphill as habitats shift upward, but they may soon run out of room to run. The shift could cause at least two toad species and one species of gecko in Madagascar to go extinct by the end of this century, a biologist says. Uphill movement is a predicted response to increased temperatures, researcher Christopher Raxworthy of the American Museum of Natural History says. Earlier studies in Costa Rica have provided evidence of how tropical animals respond to climate change.
The new research - based on surveys of Madagascar’s amphibians and reptiles conducted in 1993 and 2003 and announced this week - extends that work, expanding the number and diversity of species that the trend affects, making a stronger link with meteorological changes, dealing with relatively large shifts in elevation, and assessing the extinction vulnerability for tropical communities in the mountains. Nowhere to run.
Two of these species were not found again during the most recent 2003 survey. (And for the 30 species that were re-sampled between 1993 and 2003, the majority are already moving upslope to compensate for habitat loss at lower and warmer altitudes.) Extinction is expected to occur between 2050 and 2100 if current trends persist, because there will eventually be no higher ground, predict Raxworthy and his colleagues from the Universite d’Antananarivo in Madagascar, National Chung-Hsing University in Taiwan, University of Michigan and University of Oxford. The prediction is based on a conservative scenario in which warming remains below 2 degrees C (3 degrees F). Warming above 2 degrees C is considered to be dangerous in terms of impacts on biodiversity. “Obviously, more warming will put more species at risk,” Raxworthy told LiveScience. Read more here.
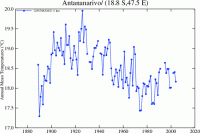
Icecap reality check: here is the NASA annual temperature plot since the 1880s for Antananarivo, a large city in Madagascar with a population of 452,000. See if you spot any signs of global warming. I always thought for there to be warming, temperatures actually had to rise. The creatures can’t read IPCC reports or model forecasts. Maybe they are moving because of the loss of habitat to population growth or trying to escape those crazy scientists with cameras and probes.

See larger graph here
Jun 11, 2008
A Note on Temperature Anomalies by Tom Quirk
By Tom Quirk, Politics and Environment Blog
One of the most vexing things about climate change is the endless debate about temperatures. Did they rise, did they fall or were they pushed? At times it seems like a Monty Python sketch following either the Dead Parrot or the 5 or 10 Minute Argument. However it is possible to see some of the issues by looking at the correlation of the five temperature series that are advanced by the uppers or the downers.
The five groups are:
1. GISS, The Goddard Institute, home of James Hansen,
2. NCDC, The National Climate Data Center, a part of NOAA (as is GISS), the National Oceanographic and Atmosphere Administration.
3. BMO/UEA, The British Meteorological Office and the University of East Anglia.
4. UAH, The University of Alabama, Huntsville, home of Roy Spencer with his colleagues including John Christy of NASA
5. RSS, Remote Sensing Systems in Santa Rosa, California, a company supported by NASA for the analysis of satellite data.
The first three groups use ground based data where possible with a degree of commonality. However since 70% of the surface of the earth is ocean and it is not monitored in a detailed manner, various recipes are followed to fill the ocean gap, if that is the best way of putting it. The last two groups use satellite data to probe the atmosphere and with the exception of the Polar Regions which are less than 10% of the globe, they get comprehensive coverage.
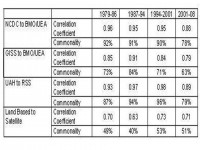
One of the ways to probe this is to look over time at the degree of correlation achieved in the measurements of the global temperature anomaly. The results of such a comparison are given in Table 1 for the monthly time series from 1979 to 2008. There is the Pearson correlation coefficient extracted from the data. A value of 1.00 shows the compared values move in step with each other while a value of 0.00 would give complete independence. (A value of-1.00 is also possible.) “Commonality”, the square of the correlation coefficient is interpreted as showing what proportion of one measurement series is covered by the other series. Note that correlation does not imply connection or causality except that we know there is some commonality with ground based measurements.

See larger table here. Read more of the interesting results here.
Jun 09, 2008
Much More to the Earth’s Climate Dynamics than Human Activity
By Richard Mackey. Submission to Garnaut Review
The linked to in-depth submission with a list of recommendations was made to the Australian Garnaut Review for consideration before making more unwise policy decisions about actions to offset climate change. Though they were meant for the Australian government, decision and policy makers should be made aware of these facts before going ahead here in the United States and elsewhere to take action that would greatly exaggerate the harm already done by prior actions or lack of actions by our presidents and congress of both parties (in part thanks to extensive lobbying by environmentalists) over the last three decades that has left us much more dependent on foreign oil when we could and should be energy independent.
While we are shocked by $4 per gallon gasoline, in countries that are energy independent, gasoline prices are absurdly cheap. In Venezuela gasoline is 12 cents a gallon. In Saudi Arabia it’s 45 cents a gallon. This is made all the more painful by the Chinese drilling for oil just 60 miles off the Florida coast while regulations prevent drilling for the oil and gas we have that could meet our total oil needs for 60 years and natural gas for 40 years giving us time to develop alternative energies. We haven’t built a nuclear plant in decades or a refinery for gasoline since the Carter administration. Instead we go down the ridiculous path of ethanol from corn that drives up all food prices without reducing emissions.
Richard starts out: “The scientific investigation of the Earth’s climate dynamics examines all the factors that give rise to climate change. Policy advice about what a government might do ameliorate the impact of climate dynamics, or more realistically, adapt efficiently to expected impacts of climate dynamics, would have to have regard to all of the main classes of results of this scientific investigation. If it didn’t, the policy advice would be flawed. If the Commonwealth Government was presented with a partial and biased analysis based merely on some aspects of climate dynamics, and policy advice was based only on a limited evaluation of some of those aspects, the legislative and budget measures implemented by the Commonwealth would join the catalogues of bad policy referred to in this Submission.”
He then goes on to recommend they hear a review of all the factors in climate change, hear about the shortcomings of the IPCC report, recognize that large scale oscillations are the norm and adopt a policy that adapts to change, advise research organizations to resume research into the areas of relationships between solar variability and climate dynamics; the natural internal variability of the climate system; and relationships between climate dynamics and the massive re-engineering of the planet by human beings over the last 300 years or so, and based on the finding of the submission, recognize that taxes (direct or indirect), tax expenditures, subsidies, grants, economic transfers or other forms of assistance or industry and/or workforce regulation are not warranted. He then goes into great detail on many of these issues and the science behind them.
Jun 08, 2008
The Death Blow to Anthropogenic Global Warming
By Stephen Wilde, Fellow of the Royal Meteorological Society
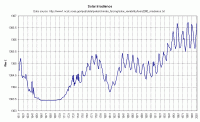
The influence of the sun has been discounted in the climate models as a contributor to the warming observed between 1975 and 1998. Those who support the theory of anthropogenic global warming (AGW), now known as anthropogenic climate change so that recent cooling can be included in their scenario, always deny that the sun has anything to do with recent global temperature movements. The reason given is that Total Solar Irradiance (TSI) varied so little over that period that it cannot explain the warming that was observed. I donít yet accept that TSI tells the whole story because it is ill defined and speculative as regards it’s representation of all the different ways the sun could affect the Earth via the entire available range of physical processes. Despite the limitations of TSI as an indicator of solar influence I think there are conclusions we can draw from the records we do have. Oddly, I have not seen them discussed properly anywhere else, especially not by AGW enthusiasts.

This link shows a larger graph of TSI from 1611 to 2001.
Throughout the period 1961 to about 2001, there was a steady cumulative net warming effect from the sun. The fact that the TSI was, on average, level during that period is entirely irrelevant and misleading. It is hardly likely that such a high level of TSI compared to historical levels is going to have no effect at all on global temperature changes and indeed during most of that period there was an enhanced period of positive Pacific Decadal Oscillation that imparted increasing warmth to the atmosphere. This link contains details of my view that the sun drives the various oceanic oscillations which in turn drive global temperature variations with all other influences including CO2 being minor and often cancelling themselves out leaving the solar/oceanic driver supreme.
Does anyone really think that the CO2 we produce is effective enough to reduce that risk to zero when we have plenty of astronomic evidence of an imminent reduction in solar activity? And, moreover, the real world temperature movements are currently a good fit with the solar driver theory both as regards to warming spell, the subsequent stall and the recent turn downwards. The AGW risk analysis process (if anyone ever bothered with one) is seriously flawed. Read more here.
|
|
|
|


