Dec 19, 2007
Limits on Climate Sensitivity Derived from Recent Satellite and Surface Observations
By Petr Chylek, et.al. in the Journal of Geophysical Research
In a paper published December 2007 in the Journal of Geophysical Research, Petr Chylek et al found another source of model error when they found climate sensitivity is reduced by at least a factor of 2 when direct and indirect effects of decreasing aerosols are included. Their abstract:
An analysis of satellite and surface measurements of aerosol optical depth suggests that global average of aerosol optical depth has been recently decreasing at the rate of around 0.0014/a. This decrease is nonuniform with the fastest decrease observed over the United States and Europe. The observed rate of decreasing aerosol optical depth produces the top of the atmosphere radiative forcing that is comparable to forcing due to the current rate of increasing atmospheric concentration of carbon dioxide and other greenhouse gases. Consequently, both increasing atmospheric concentration of greenhouse gases and decreasing loading of atmospheric aerosols are major contributors to the top-of-atmosphere radiative forcing. We find that the climate sensitivity is reduced by at least a factor of 2 when direct and indirect effects of decreasing aerosols are included, compared to the case where the radiative forcing is ascribed only to increases in atmospheric concentrations of carbon dioxide. We find the empirical climate sensitivity to be between 0.29 and 0.48 K/Wm−2 when aerosol direct and indirect radiative forcing is included.
Icecap Note: This amount is likely still an overestimate because of the assumption that all warming was due to radiative forcing, discounting natural factors, yet the conclusion undercuts the disaster scenarios. Put that together with lack of a long-term increase in precipitable water as noted by Pielke and found in Wang et.al., 2007 here and the oversimplified handling of the solar and oceans, and you can pretty much discard the climate models as an reliable tool for assessing future climate.
Dec 18, 2007
Antarctic Temperatures: 1958-2002
CO2 Science on Chapman and Walsh
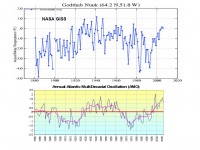
Chapman and Walsh in “A synthesis of Antarctic Temperatures” in the Journal of Climate 2007, used monthly surface air temperatures from manned and automatic weather stations along with ship/buoy observations from the high-latitude Southern Hemisphere to develop a gridded database with resolution appropriate for applications ranging from spatial trend analyses to climate change impact assessments.
The data in the figure above clearly indicate a post-1958 warming of Antarctica and much of the surrounding Southern Ocean. From approximately 1970 to the end of the record, however, temperatures of the region simply fluctuated around an anomaly mean of about 0.12°C, neither warming nor cooling over the final 32 years of the record.
This latter observation is truly amazing in light of the fact that the region of study includes the Antarctic Peninsula, which experienced phenomenal warming during this period. Nevertheless, the mean surface air temperature of the entire region changed not at all, over a period of time that saw the air’s CO2 concentration rise by approximately 47 ppm (about 15% of its 1970 value, as per the Mauna Loa CO2 record).
Clearly, the entire continent of Antarctica, together with much of the Southern Ocean that surrounds it, has been completely oblivious to the supposedly “unprecedented” radiative impetus for warming produced by anthropogenic emissions of CO2 and other greenhouse gases over the last three decades of the 20th century ... and even a bit beyond. See more here.
Dec 17, 2007
Easing Kids Fears on Global Warming
By Laryy Chiaroni, KCBS, San Francisco
A new book aims to soothe childrenâs fears over global warming. Holly Fretwell wrote, âThe Skyâs Not Falling: Why itâs Ok to Chill About Global Warming,â because she says today’s environmental hysteria was scaring her two kids. âI really wanted to provide something for kids that gave them the whole gambit. Something that gave them the full piece of information, and not just a little tiny piece of it to try to distort their view of the world,â said Fretwell, a natural resources policy expert, and economics college professor.

âItâs a great book for kids, as well as parents, as well as just adults who want to get some kind of a primer on whatâs actually happening out there, and what global warming really is,â said Fretwell. âIt says what the policy recommendations are, what the costs of some of those recommendations are, and what some alternatives are for us.â No matter where parents stand on global warming, Fretwell says the best thing we can do for our kids is to encourage them to be critical thinkers. See story here.
For how to access this book, see this release here.
Dec 15, 2007
Is a New Solar Cycle Beginning?
Science at NASA
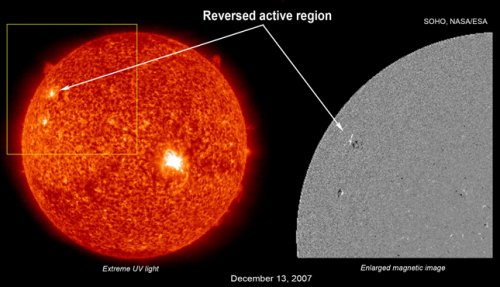
The solar physics community is abuzz this week. No, there haven’t been any great eruptions or solar storms. The source of the excitement is a modest knot of magnetism that popped over the sun’s eastern limb on Dec. 11th, pictured below in a pair of images from the orbiting Solar and Heliospheric Observatory (SOHO). It may not look like much, but “this patch of magnetism could be a sign of the next solar cycle,” says solar physicist David Hathaway of the Marshall Space Flight Center.

See full size image here.
For more than a year, the sun has been experiencing a lull in activity, marking the end of Solar Cycle 23, which peaked with many furious storms in 2000--2003. “Solar minimum is upon us,” he says. The big question now is, when will the next solar cycle begin?
It could be starting now. “New solar cycles always begin with a high-latitude, reversed polarity sunspot,” explains Hathaway. “Reversed polarity “ means a sunspot with opposite magnetic polarity compared to sunspots from the previous solar cycle. “High-latitude” refers to the sun’s grid of latitude and longitude. Old cycle spots congregate near the sun’s equator. New cycle spots appear higher, around 25 or 30 degrees latitude. The region that appeared on Dec. 11th fits both these criteria. It is high latitude (24 degrees N) and magnetically reversed. Just one problem: There is no sunspot. So far the region is just a bright knot of magnetic fields. If, however, these fields coalesce into a dark sunspot, scientists are ready to announce that Solar Cycle 24 has officially begun.
Peaking in 2011 or 2012, the cycle to come could have significant impacts on telecommunications, air traffic, power grids and GPS systems. (And don’t forget the Northern Lights!) In this age of satellites and cell phones, the next solar cycle could make itself felt as never before.
Icecap Note: Though Hathaway is among some solar physicists who believe cycle 24 will be very active (though 25 very quiet), the majority believe it will continue the decline started in cycle 23 which peaked 25% lower than the two previous cycles and forecasts. See a compilations of forecasts here. Also note cycle 23 would have lasted 11 years 7 plus months, more than a full two years longer than cycle 22. Longer cycles usually lead to colder temperatures. Leif Svalgaard notes it was at rather low latitude (for a new cycle spot). This is usually a sign of a weak cycle. The stronger the cycle the higher the latitude of the first spots.
Dec 14, 2007
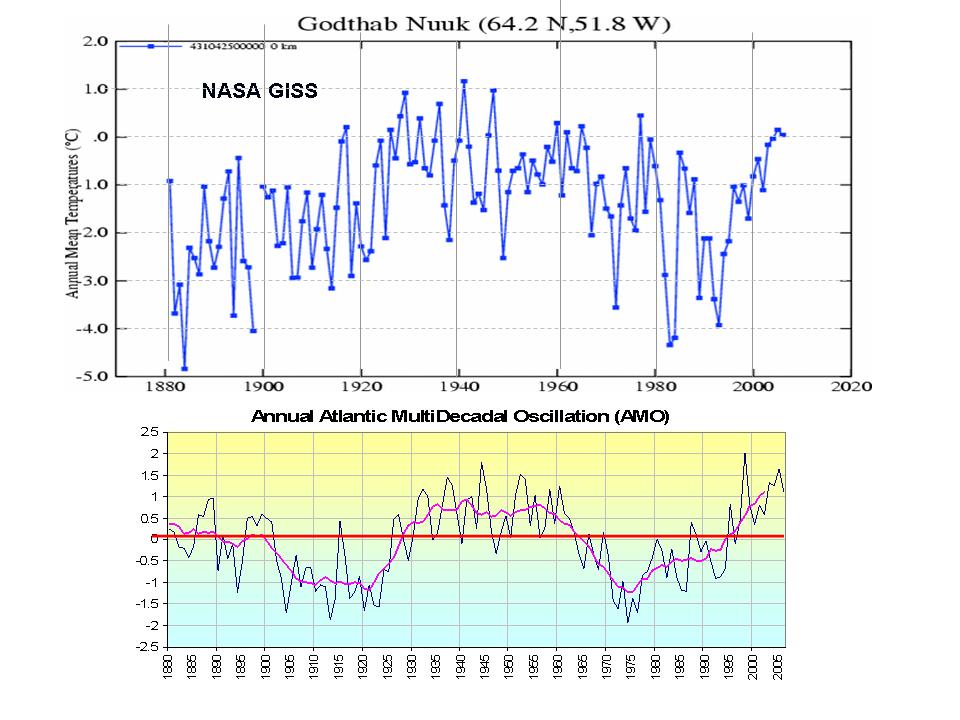
Current Melting Of Greenland’s Ice Mimicks 1920s-1940s Event
Science Daily
Two researchers here spent months scouring through old expedition logs and reports, and reviewing 70-year-old maps and photos before making a surprising discovery: They found that the effects of the current warming and melting of Greenland’s glaciers that has alarmed the world’s climate scientists occurred in the decades following an abrupt warming in the 1920s.
Their evidence reinforces the belief that glaciers and other bodies of ice are exquisitely hyper-sensitive to climate change and bolsters the concern that rising temperatures will speed the demise of that island’s ice fields, hastening sea level rise.
The work, recently reported at the annual meeting of the American Geophysical Union in San Francisco , may help to discount critics’ notion that the melting of Greenland ‘s glaciers is merely an isolated, regional event. They recently recognized from using weather station records from the past century that temperatures in Greenland had warmed in the 1920s at rates equivalent to the recent past. But they hadn’t confirmed that the island’s glaciers responded to that earlier warming, until now. Read more here.
Icecap Note: This supports what we and others have been saying is that the changes observed are cyclical and related to the Atlantic Multidecadal Oscillation and not greeenhouse gases
For full size image go here.
|

