
|
Jul 26, 2007
Falsification Of The Atmospheric CO2 Greenhouse Effects Within The Frame Of Physics
By Gerhard Gerlich, Institute ur Mathematische Physik, Federal Republic of Germany
The atmospheric greenhouse effect, an idea that authors trace back to the traditional works of Fourier 1824, Tyndall 1861 and Arrhenius 1896 and is still supported in global climatology essentially describes a fictitious mechanism in which a planetary atmosphere acts as a heat pump driven by an environment that is radiatively interacting with but radiatively equilibrated to the atmospheric system. According to the second law of thermodynamics such a planetary machine can never exist.
Nevertheless, in almost all texts of global climatology and in a widespread secondary literature it is taken for granted that such mechanism is real and stands on a firm scientific foundation. In this paper the popular conjecture is analyzed and the underlying physical principles are clarified. By showing that (a) there are no common physical laws between the warming phenomenon in glass houses and the fictitious atmospheric greenhouse effects, (b) there are no calculations to determine an average surface temperature of a planet, (c) the frequently mentioned difference of 33 C is a meaningless number calculated wrongly, (d) the formulas of cavity radiation are used inappropriately, (e) the assumption of a radiative balance is unphysical, (f) thermal conductivity and friction must not be set to zero, the atmospheric greenhouse conjecture is falsified.
Jul 25, 2007
Current issues in Climate Science: Focus on the Poles
By Bob Ferguson, Science and Public Policy Institute
Let me give you just one fact. Al Gore says the Antarctic and Greenland ice sheets will melt and cause sea level to rise 20 feet, putting the present-day populations of Manhattan, Shanghai, Bangladesh and other coastal regions at risk. The official scientific consensus, represented by the UN Intergovernmental Panel on Climate Change, says that over the coming century the contribution of these two ice sheets to sea-level rise will be not 20 feet but 2 inches; that in each of the past four interglacial warm periods sea level rose to a height five metres above its present level, and did so without any influence from humankind; that sea level will do the same in the present interglacial period; but that it will not rise by 20 feet for several millennia. Indeed, the UN says the probability that our activities make any difference to sea level is little better than 50:50. So, on the scariest of all the “global warming” scares - sea-level rising and displacing hundreds of millions - Al Gore is exaggerating 120-fold, or almost 12,000 per cent. He does not represent the scientific mainstream consensus, but instead speaks for a small, fringe group of politically-motivated scientists. - Lord Christopher Monckton.
After a much publicized rapid retreat during the period 2002 through 2005, Greenlands Helheim glacier, has stabilized and begun advancing. The restabilization of the Helheim glacier alone could be responsible for a reduction in excess of 10 percent of the current mass loss from Greenland.
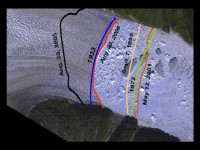
See full report and full size image here.
Jul 23, 2007
Nir Shaviv: Why is Lockwood and Fröhlich Meaningless?
Lubos Motl the Reference Frame
Lockwood and Frolich state that from 1985, there is a discrepancy between solar activity, which decreased, and the global temperature, which increased. Hence, solar activity cannot explain the observed warming. This conclusion, however, is flawed for several reasons.
To begin with, L & W write that solar activity decreased after 1985. This may almost be correct for the sunspot number (which remained the same) and perhaps correct for other solar activity proxies, but this is not correct for the cosmic rays. The 1990 solar maximum caused a larger decrease in the cosmic ray flux, which implies that the temperature should have been higher in the 1990’s than in the 1980’s. This leaves a discrepancy between the solar maximum of 2001 which was weaker than the solar maximum of 1990, and the observed temperature increase.
So why has the temperature continued increasing even though the solar activity diminished? This has to do with the second point, which is very important, but totally ignored by L & F.
L & F assume (like many others before) that there should be a one-to-one correspondence between the temperature variations and solar activity. However, there are two important effects which should be considered and which arise because of the climate’s heat capacity (predominantly the oceans). First, the response to short term variations in the radiative forcings are damped. This explains why the temperature variations in sync with the 11-year solar cycle are small (but they are present at the level which one expects from the observed cloud cover variations… about 0.1°C). Second, there is a lag between the response and the forcing. Typically, one expects lags which depend on the time scale of the variations. The 11-year solar cycle gives rise to a 2 year lag in the 0.1°C observed temperature variations. Similarly, the response to the 20th century warming should be delayed by typically a decade. Climatologists know this very well (the IPCC report, for example, include simulation results for the many decades long response to a “step function” in the forcing, and climatologists talk about “global warming commitment” that even if the CO2 would stabilize, or even decrease, we should expect to see the “committed warming”, e.g., Science 307), but L & F are not climatologists, they are solar physicists, so they may not have grasped this point to the extent that they should have.
See whole blog here.
Jul 23, 2007
Huge Dust Plumes From China Cause Changes in Climate
By Robert Lee Hotz, Wall Street Journal Online
One tainted export from China can’t be avoided in North America—air. An outpouring of dust layered with man-made sulfates, smog, industrial fumes, carbon grit and nitrates is crossing the Pacific Ocean on prevailing winds from booming Asian economies in plumes so vast they alter the climate. These rivers of polluted air can be wider than the Amazon and deeper than the Grand Canyon.
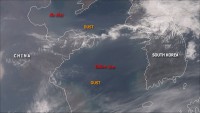
This MODIS satellite image shows a larg area of dust over the Bo Hai Bay and Yellow Sea extending into Korea. It is likely from the Gobi Desert.
“There are times when it covers the entire Pacific Ocean basin like a ribbon bent back and forth,” said atmospheric physicist V. Ramanathan at the Scripps Institution of Oceanography in La Jolla, Calif.
Over the Pacific itself, the plumes are seeding ocean clouds and spawning fiercer thunderstorms, researchers at Texas A&M University reported in the Proceedings of the National Academy of Sciences in March.
The influence of these plumes on climate is complex because they can have both a cooling and a warming effect, the scientists said. Scientists are convinced these plumes contain so many cooling sulfate particles that they may be masking half of the effect of global warming. The plumes may block more than 10% of the sunlight over the Pacific. But while the sulfates they carry lower temperatures by reflecting sunlight, the soot they contain absorbs solar heat, thus warming the planet.
See full story here.
Jul 20, 2007
Record Cold June in Australia in Post 1950 period
Australian Bureau of Meteorology June Summary
June 2007 was the coldest June recorded in Australia in the post?1950 period. It was also a notably wet month in most of northern Australia, as well as along many parts of the east coast. A number of unseasonable cloudbands affected the tropics, and the month was also notable for four major east coast lows forming off the coast of New South Wales and eastern Victoria during the month, bringing heavy rain to much of the region.
Maximum temperatures were particularly low in the tropics due to the influence of increased cloud cover, with both Queensland (anomaly ?3.01°C) and the Northern Territory (anomaly ?3.40°C) breaking regional records by substantial margins. There was an especially exceptional cold episode from 17?22 June which saw vast areas of tropical Queensland and the NT experienced their coldest day on record, with single-digit maxima as far north as Tennant Creek (8.0°C) and Mount Isa (9.4°C). It was also unusually cold further south in Queensland with a state record low maximum for June (4.9°C) set at Applethorpe. See full report here.
The cold has continued into July with new records set. See Queensland breaks cold weather record.
|
|
|
|

