Aug 20, 2007
Probability of Sudden Global Cooling
Dr Peter Harris, Retired Engineer, Queensland
The attached data is well known and was derived mathematically by Quinn et al. in 1991 and it shows the effect of orbital geometry on solar forcing or insolation, and displays global climate as glaciation data on the same time scale. What seems to have been overlooked is the remarkable degree of correlation between insolation (shown in yellow) and sudden changes in global climate which are reflected in the glaciation data.
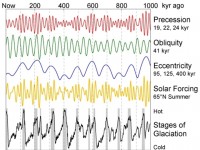
A close review of the attached data shows that over the past 400KY there have been 18 down cycles in insolation and these correlate with 17 sudden downturns in global temperature. We have a rapid decline in insolation now. The data also clearly shows the nominal 100KY cycle for glaciation and the interglacial phases and it shows that we have reached the end of the typical Interglacial cycle and are due for a sudden cooling climate change. Read more here.
Aug 17, 2007
Overturning the IPCC “Consensus” in One Fell Swoop?
By Joel Schwartz, Planet Gore
New research from Stephen Schwartz of Brookhaven National Lab concludes that the Earths climate is only about one-third as sensitive to carbon dioxide as the IPCC assumes. Schwartzs study is in press at the Journal of Geophysical Research and you can download a preprint of the study here:
According to Schwartzs results, which are based on the empirical relationship between trends in surface temperature and ocean heat content, doubling the CO2 concentration in the atmosphere would result in a 1.1 C increase in average temperature (0.12.1 C, two standard deviation uncertainty range). Schwartzs result is 63% lower than the IPCCs estimate of 3 C for a doubling of CO2 (2.04.5C, 2 standard deviation range).
The response time, or time constant, of the climate to greenhouse gas forcing is relatively smallonly five years. In other words, theres hardly any additional warming in the pipeline from previous greenhouse gas emissions. This is in contrast to the IPCC, which predicts that the Earths average temperature will rise an additional 0.6 C during the 21st Century even if greenhouse gas concentrations stopped increasing.
Schwartz is careful to include the appropriate caveats to his results. But he also shows that his estimates are consistent with much of the previous literature on the subject. His study also has the virtue of relying largely on empirical measurements of actual climate behavior during the 20th Century, rather than on climate models.
Stephen Schwartz is a pretty mainstream climate scientist. Yet along with dozens of other studies in the scientific literature, his new study belies Al Gores claim that there is no legitimate scholarly alternative to climate catastrophism.
Indeed, if Schwartzs results are correct, that alone would be enough to overturn in one fell swoop the IPCCs scientific consensus, the environmentalists climate hysteria, and the political pretext for the energy-restriction policies that have become so popular with the worlds environmental regulators, elected officials, and corporations. The question is, will anyone in the mainstream media notice? Read more here.
Aug 14, 2007
Inside the Beltway - Evidence That It has Happened Before
By John McCaslin, Washington Times
D.C. resident John Lockwood was conducting research at the Library of Congress and came across an intriguing Page 2 headline in the Nov. 2, 1922 edition of The Washington Post: “Arctic Ocean Getting Warm; Seals Vanish and Icebergs Melt.” The 1922 article, obtained by Inside the Beltway, goes on to mention “great masses of ice have now been replaced by moraines of earth and stones,” and “at many points well-known glaciers have entirely disappeared.”
“This was one of several such articles I have found at the Library of Congress for the 1920s and 1930s,” says Mr. Lockwood. “I had read of the just-released NASA estimates, that four of the 10 hottest years in the U.S. were actually in the 1930s, with 1934 the hottest of all.”
Read more here.
Aug 14, 2007
Scientific Consensus’ Not Represented in the IPCC Documents
By Madhav Khandehar in the Hill Times
Brant Boucher, in his letter “Scientific consensus” (The Hill Times, Aug. 6, 2007), seems to naively believe that the climate change science espoused in the Intergovernmental Panel on Climate Change IPCC documents represents “scientific consensus.” Nothing could be further than the truth!
As one of the invited expert reviewers for the 2007 IPCC documents, I have pointed out the flawed review process used by the IPCC scientists in one of my letters (The Hill Times, May 28, 2007). I have also pointed out in my letter that an increasing number of scientists are now questioning the hypothesis of GHG-induced warming of the earth’s surface and suggesting a stronger impact of solar variability and large-scale atmospheric circulation patterns on the observed temperature increase than previously believed.
I would further politely ask Mr. Boucher to do a simple reality check regarding the earth’s temperature change. Since mid-1998, the earth’s mean temperature as a whole has not increased at all, despite billions of tonnes of human-added CO2 in the earth’s atmosphere. Read more here.
Aug 12, 2007
Heretical Thoughts about Science and Society
By Freeman Dyson, Professor of Physics at the Institute for Advanced Study, in Princeton
My first heresy says that all the fuss about global warming is grossly exaggerated. Here I am opposing the holy brotherhood of climate model experts and the crowd of deluded citizens who believe the numbers predicted by the computer models. Of course, they say, I have no degree in meteorology and I am therefore not qualified to speak. But I have studied the climate models and I know what they can do. The models solve the equations of fluid dynamics, and they do a very good job of describing the fluid motions of the atmosphere and the oceans. They do a very poor job of describing the clouds, the dust, the chemistry and the biology of fields and farms and forests. They do not begin to describe the real world that we live in. The real world is muddy and messy and full of things that we do not yet understand. It is much easier for a scientist to sit in an air-conditioned building and run computer models, than to put on winter clothes and measure what is really happening outside in the swamps and the clouds. That is why the climate model experts end up believing their own models. Read more here.

