Jul 15, 2010
Global Warming Theory: False in Parts, False in Totality
By Dr. Tim Ball
IPCC: The Flight from Truth: The Reign of deceit in the Age of Information
There are so many variables ignored, underreported or simply not understood in climate science and especially in the computer models that purport to simulate global climate, that they destroy any pretence we know or understand weather and climate. But don’t take my word for it. Consider the comments from proponents of anthropogenic global warming including the Intergovernmental Panel on Climate Change (IPCC).
In the 2001 report they said, “In climate research and modeling, we should recognize that we are dealing with a coupled non-linear chaotic system, and therefore that long-term prediction of future climate state is not possible.” James Lovelock, Gaia hypothesis speculator said, “It’s almost naive, scientifically speaking, to think that we can give relatively accurate predictions for future climate. There are so many unknowns that it’s wrong to do it.” Kevin Trenberth, IPCC author and CRU associate said, “It’s very clear we do not have a climate observing system...This may be a shock to many people who assume that we do know adequately what’s going on with the climate, but we don’t.”
Many reports exist on the inadequacy of temperature data. Ross McKitrick asks whether a global temperature exists at all. Anthony Watts shows the serious problems with the weather stations in the US and these are supposedly the best in the world. We also know how the record is ‘adjusted’ to support the warming theory.
However, measurement of other variables is worse simply because of the complexity of measurements. Instruments to accurately measure precipitation, especially snowfall, have always been a great challenge. Perhaps the most forgotten variable, yet critical to weather and climate, is wind speed. Ancient Greeks knew the importance of wind direction and how it determined the pattern of weather in a region. They even built a Tower of the Winds in Athens honoring the eight wind deities (Figure 1). Direction was critical for sailing as well, so mariners developed the ability to read the wind to 32 points of the compass. Speed was a different matter. Early attempts had a flat board on a spring with a pointer attached that was set against a scale. Wind pushed the board and the pointer indicated the force. The big change came with the wind cup or anemometer in 1846. While this provides an accurate measure, recording the information is important because the work the wind does requires detailed almost continuous data.

Figure 1: Tower of the winds, Athens Source: wikipedia.org (Tower of the Winds)
The atmosphere is heated by air in contact with the ground (conduction) but also by evaporation of moisture that is then released into the atmosphere. In both cases the rate varies with wind speed. Even a small variation in wind speed results in a variation in heat exchange and distribution in the atmosphere.
Wind is created by difference in pressure that is created by difference in temperature. High temperature creates low pressure and wind then blows from the high pressure to redress the imbalance. There are general global wind patterns created by differential heating. If the Earth wasn’t rotating a simple circulation of air rising at the Equator and descending at the Poles would occur, however rotation results in generally easterly winds at the Equator and the Poles with prevailing westerly winds in the middle latitudes. Each region has different land/ water ratios so a shift in these zonal winds will affect the role of the wind in heating the atmosphere.
Figure 2 shows plots of the percentage frequency of south winds at York Factory located on the southwest shore of Hudson Bay for two decades over 100 years apart. In the early decade from 1721 to 1731, which is well within the Little Ice Age (LIA), south winds blow less than 7 percent of the time. In the decade from 1841 to 1851, which is outside of the LIA, south winds are occur over 12 percent of the time with a peak in 1842 of 27 percent.
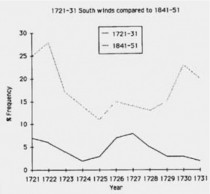
Figure 2: Percentage of south winds at York Factory Source; Ball (1986), Climate Change, Vol. 8 pp. 121-134.
The 2007 IPCC report acknowledges the shifts in some wind patterns and associated weather systems. Based on a variety of measurements at the surface and in the upper troposphere, it is likely that there has been an increase and a poleward shift in NH (Northern Hemisphere) winter storm-track activity over the second half of the 20th century, but there are still significant uncertainties in the magnitude of the increase due to time-dependent biases in the reanalyses. The word “likely” is defined as greater than 66% chance. The shift is not surprising because the prevailing westerly wind and accompanying storm track would move north as the Earth warms. They acknowledge the “significant uncertainties” in the validity of increased frequency. They don’t even attempt to discuss the significance for heat transfer or any other impact on global weather. We know wind causes shifts of Arctic ice to create open water or increase pack ice, but how does this affect heat exchange or evaporation? It is even worse in the Southern Hemisphere (SH). Analysed decreases in cyclone numbers over the southern extratropics and increases in mean cyclone radius and depth over much of the SH over the last two decades are subject to even larger uncertainties.
The degree to which the IPCC and their supporters have fooled the world is amazing. As Jean-Francois Revel said: “How is it possible for a theory, which is false in its component parts, to be true as a whole.” In the case of ‘official’ climate science he could add that many parts of the whole are simply omitted. He explained the mentality that has pervaded the AGW supporters when he wrote, “A human group transforms itself into a crowd when it suddenly responds to a suggestion rather than to reasoning, to an image rather than to an idea, to an affirmation rather than to proof, to the repetition of a phrase rather than to arguments, to prestige rather than to competence” His book titled, “The Flight from Truth: The Reign of deceit in the Age of Information” tells it all. Read post here.
Jul 12, 2010
Tropical Lull Period - Typical For July
By Joseph D’Aleo
After Alex and a TD that both tracked to northern Mexico and southern Texas, the tropical Atlantic has become quiet. The ITCZ has been suppressed south of 10N where development is impaired by the lack of the coriolis effect (that causes the spin when disturbances develop).
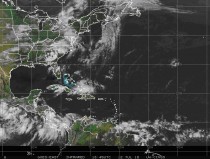
Enlarged here.
One of the key reasons for the quiet period is a large slug of Saharan dust which has blown across the subtropical Atlantic shown in yellows and reds on the Wisconsin CIMSS imagery below. This dry dusty air produces stability and inhibits any convection. It is typical of July and usually explains the mid summer lull.

Enlarged here.
A disturbance can be seen coming off of Africa north of 10N seen above and in the infrared image below. Another will follow. Models do not suggest development.

Enlarged here.
Ocean temperatures have cooled some from early spring levels with some upwelling of cold water off Africa and in the southwestern Gulf after the mixing from Alex and the TD.
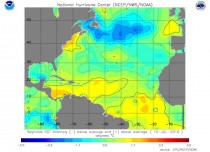
Enlarged here.
Activity usually picks up in mid August as the subtropical high shifts north seasonally and the dust diminishes.
My guess is an above normal season but not the extreme number of storms as in 2005. The AMO remains well above normal with the warmth in the tropics and North Atlantic, usually correlating with active seasons. Warm water off the east coast makes the threat of a major storm more likely. Warm Atlantic summers with a negative PDO usually mean enhanced east coast threats. This post here. More here.
Jul 12, 2010
Anthony Watts interviewed on “Noble Cause Corruption”
By Tom Minchin
Comment by Anthony Watts:
This interview below by Tom Minchin took place in a hospital staff room just a few minutes before my presentation in Hamilton City, Victoria at the hospital auditorium. Tom did a much better job than most reporters because not only did he ask useful questions, he recorded it and wrote from that, rather than just taking notebook scribbles that invariably end up in misquotes and misinterpretations.
-------
“Noble Cause Corruption”
Climate science depends utterly on the integrity of its measurements. In order to extrapolate and make forecasts, there can be no errors in the data. How reliable are the measurements climate scientists use? What happens if their measuring apparatus is altered by something as simple as a coat of paint that lifts the average recordings? Will anyone spot it? And if someone does, what happens if such a desired result matters more than getting the facts straight?
An expert on these questions, Anthony Watts, founder of the most widely visited climate site in the world, the US-based Watts Up With That, (47.3 million hits since the fall of 2007, compared with the leading alarmist site RealClimate’s 11.7 million since December 2004), is wrapping up his national tour at the moment and I spoke to him in Melbourne.
At the start of the interview, Watts, a former TV weatherman, confirmed that he did not begin as a skeptic. As he put it himself with typical bluntness, “I started out actually just being a climate alarmist. I got involved with saving the planet by helping other weather forecasters do the same thing through planting trees. Then when I met the State climatologist in California, his data changed my mind and now I’m a skeptic.”
Watts was not content to let his view rest on someone else’s data. He researched the matter in a wholly original way. Talking to him it became clear just how plain honesty and an inquiring mind are fatal to the alarmist cause. His alertness to measurement problems began well before his skepticism.
When I was in college one of the first jobs I had was to assemble a Stevenson Screen [the slatted box on stilts that protects meteorological instruments from undue influences, widely used up until 1984], and I remember the whitewash coming off in my hand. I’d always wondered about that. My professor told me we couldn’t change it because even though it was an inferior coating that flaked off, it just couldn’t be changed. Then when I learned in 1979 that the Weather Bureau had changed the specification to latex I wondered if that made a difference - and there didn’t seem to be anything in the literature about it. And so as I’d often wondered about it, I finally got around to doing the experiment, and when I did the experiment I discovered that there was indeed a difference, a significant difference [a thermometer in a latex painted screen records a higher average temperature], which was as large as the agreed upon global warming signal. So that sparked my interest. And then when I went to visit screens to test the paint issue, I discovered stations were poorly sited. And so that grew into a larger situation.
It is interesting to see how an active mind makes connections. From a simple concern about flaking whitewash and a response to it by a professor who knows that a standard must be kept constant, a thinker can make the choices to become a global leader in exposing climate fraud and distortion. He continued:
Initially the screens were probably in the right locations, because when a lot of these stations were started there was less urbanization. There was more open space and thus there were more choices available to place them in an open space. However, urbanization built up around a lot of these thermometers. Then when the observer may have died - some of the observers were volunteer observers, some of them were at organizations - or organizations closed, or some other reason would cause them to have to be moved, then there were less available places away from urbanization to move them to. And so gradually there became less and less space to put these things in - or urbanization grew up around them. So that’s the key problem here: how much has the urbanization affected the signal?
I asked him if his conclusion was that the signal was being distorted and thus that “the temperature record was unreliable.” His answer was unequivocal:
Right. The specification from the United States NOAA (National Oceanic and Atmospheric Administration) and through their weather service, NWS - National Weather Service - has a simple rule called the 100 foot rule. And it basically says keep the thermometers away from influences such as concrete, asphalt, car parks, buildings, other heat generating phenomena - keep them away at least 100 feet. Our study in the United States showed that only one in ten met that rule.
So politicians are demanding unprecedented control over our lives based on only one in ten US measuring stations meeting minimum standards.
I asked him how he thinks the fight is going and about his website that is such a pivotal part of that fight. Forty-seven million hits since the fall of 2007 is an impressive number. How does he account for that level of interest?
I think it’s because we’re discussing things other people are not. We have research that’s original, we have a lot of highly skilled people that visit there, and we try to maintain decorum. One of the things that I don’t have tolerance for is flame wars and trolls and all these sorts of things. You know, if were going to have a discussion I want it to be reasonable and I want everyone to be able to participate. People that try to ‘dominate discussions and so forth, I let them know they’re doing it wrong and I give time outs from time to time and things of that nature. I enforce rules to maintain order and I think that’s attractive to a lot of people.
I asked him if he was optimistic about the growth of skepticism. Does he think there is a rising tide?
I do. The Climategate e-mails made a huge impact and they demonstrated a lot of the things that skeptics have been saying for years: that the scientists were actively sequestering data, not making it available when asked, and that they were treating people with genuine, reasonable questions like Steve McIntyre as people to be fought against. They were doing political science, not true physical science.
I asked him what he thinks the chances are of cap-and-trade passing in the United States Senate this year:
Right now about 20 votes short of being passed. I don’t think it will pass this year. However it may pass in the future. The reason I don’t think it will pass this year is because we’re coming up on a November election. The Democratic people know that they’re under the gun, that there’s a lot of dissent amongst the voters and that a lot of that anger is directed towards them and so I don’t think they’re going to do anything that’s going to increase fuel taxes at this juncture. However, that being said they’re very patient people and so I expect it to be back in one form or another even if it doesn’t pass this year.
So the fight is very much alive. What drives it all? If politicians blindly pursue their agendas in order to look hip and increase their power, it’s one thing. But I asked how climate professionals can excuse themselves and what he meant by a term he used to me: “Noble Cause Corruption.” The term was originally a legal one. Its legal meaning is well explained by Steve Rothlein as follows:
There exists a serious threat to law enforcement, which can compromise the high ethical standards and values our profession has achieved during the past several decades. This threat is typically referred to as “Noble Cause Corruption.”
Traditional corruption is defined as the use of one’s official position for personal gain. The personal gain can be economic or otherwise, such as sexual favors. As a profession, we have long understood this type of abuse of power and, when discovered and investigated, those involved are arrested.
A less obvious but perhaps even more threatening type of misconduct in law enforcement is Noble Cause Corruption. This type of misconduct involves not necessarily the rotten apples in the agency but sometimes involves the best officers in the agency, or the golden apples. Noble Cause Corruption is a mindset or sub-culture which fosters a belief that the ends justify the means. In other words, law enforcement is engaged in a mission to make our streets and communities safe, and if that requires suspending the Constitution or violating laws ourselves in order to accomplish our mission, then for the greater good of society, so be it. The officers who adopt this philosophy lose their moral compass.
You can see why the term was adopted by Watts’ friend Steve McIntyre of Climate Audit. It is one Watts clearly likes. I asked him what he meant by it in the climate context. He replied:
Noble Cause Corruption is a belief that what you’re doing is so much more important than what anyone else is doing because your cause is noble, you’re saving the planet, and because you’re saving the planet, you are doing it for the good of mankind. Therefore your cause is much more important than everyone else’s. There was a time when I actually felt that way, when I was doing a project related to planting trees, and having TV meteorologists plant trees back around 1990. It’s easy to get caught up in that Noble Cause Corruption because it makes you feel good. It makes you feel important. It makes you feel powerful. And so all of those things combine to put a blinder on you as to what you’re really doing.
Finally, I asked him what he would advise people to do if they want to push this debate towards a more open and scientific basis, away from the “true believers.” He answered by defining the conflict:
I would say this boils down to a war between the haves and the have-nots. The haves are the people that are getting all the funding. They’re getting millions and millions of dollars of funding. The skeptics, we get scraps, we do things on our own. I funded most of the project on my own. And so who should you trust? People that are being paid for an opinion, paid for an output, versus someone who is not being paid for an output, and I think that’s the question.
When those getting the funding are riddled with “Noble Cause Corruption” his point is unarguable.
His final recommendation was never to let an opportunity pass to engage:
I think that if you want skeptics to have an even keel in the debate, skeptics need to push their position more often and that means writing more letters to the editor, to newspapers, to magazines and trade journals and to scientific journals. And, when there are people on the radio that are claiming things that are patently absurd, someone should be phoning in and calling them on it and not giving them a free pass.
There will be a lot fewer free passes if Watts’ growing success has anything to do with it. See post here.
Jul 12, 2010
The Venusian Atmosphere and “Runway Planet Warming”
By Jules Kalbfeld
The planet Venus has entered the carbon dioxide (CO2)/ global warming discussion because its atmosphere is 96.5% (965,000 ppm.) CO2 and its surface temperature is higher than that of Mercury which is closer to the Sun. Since radiant energy varies inversely as the square of the distance (S) traveled from its source (E~1/S2) and Mercury’s distance from the Sun is about 1/2 that of Venus, Mercury should be exposed to 4 times the Solar energy that Venus is and should experience markedly higher surface temperatures than Venus. Venus is also about 2/3 the distance from the Sun as the Earth is. Using that same relationship “E~1/S2”, the surface temperature of Venus would be expected to be about 2.25 times that of the Earth. However, the average temperature of Venus’s surface is actually about 20 times that of the Earth’s surface.
E = 1/S squared
For Venus/Mercury E = 1/(1/2)2 = 1/(1/4) = 4/1 = 4
For Earth/ Venus E = 1/(2/3)2 = 1/(4/9) = 9/4 = 2.25
These factors have been combined to infer that Venusian “runaway” global warming is primarily induced by the high concentration of CO2 in its atmosphere. This paper is intended to focus on isolated aspects of CO2’s contribution to Venus’s global warming and to thereby promote a discussion of its true influence on Venus’s global temperature.

A detailed analysis of the venusian atmosphere is conducted with results from the Magellan and Venus Explorer probes.
CONCLUSION
Venus is the hottest planet in the Solar system. Venus is hotter than Mercury which is 1/2 of it’s distance from the Sun. Venus’s atmosphere has 93 times the total mass of the Earth’s atmosphere and is 97.7 mass% CO2. The total mass of CO2 in Venus’s atmosphere is 152,451 times the total mass of CO2 found in the Earth’s atmosphere and the mass fraction of CO2 in Venus’s atmosphere is 1,639 times its mass fraction in Earth’s atmosphere. These facts have led to the generally accepted conclusion that CO2 has caused “run away” global warming of Venus and its atmosphere. This conclusion been extrapolated to reenforce the notion of CO2 induced global warming on Earth.
The preceding simple “thought experiment” was designed to explore some possible thermal consequences of an Earth equivalent (in composition) atmosphere on Venus (AIRv) at a pressure equal to Earth’s sea level atmospheric pressure. The results of this “experiment” illustrate that such an atmosphere on Venus would most likely have the same temperature (69 C) as was measured in Venus’s atmosphere at Earth’s sea level pressure by the Magellan and Venus Explorer space probes.
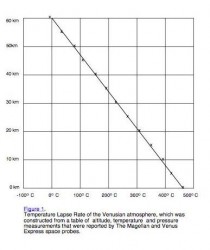
A table of Venusian atmospheric altitude, temperature and pressure data that was collected by the Magellan and Venus Express space probes was used to construct a graph (Fig. 1) depicting the (reverse) temperature lapse rate for the Venusian atmosphere from an altitude of 60 km down to it’s surface. That graph was a straight line, with no deviations, indicating that there were no layers within Venusʼ atmosphere that had trapped and stored reradiated heat.
This study, though hypothetical in nature, tends to question the role of CO2 in the “run away” global warming of Venus and it’s CO2 rich atmosphere. It also tends to minimize the notion of CO2 acting as a green house gas in general.
AUTHOR’S NOTE:
Other factors, such as axial tilt, sidereal rotation period, large variations in wind velocities, etc. can potentially effect the temperature of Venus and it’s atmosphere. However, the intention of this paper is to totally focus on CO2 and it’s contribution to the temperature of Venus and it’s atmosphere. J.K.
Jul 08, 2010
Heat islands: Cities heat quickly, cool slowly
By Deepti Hajela
UPDATE: See this analysis of heat wave days and death trends for 40 major cities. It shows both declining for the periods 1975 - 2004 from 1975 - 1995 here. See further comments after post below.
NEW YORK (AP)—Hot town, summer in the city? No kidding.
The high temperatures blanketing the Northeast and mid-Atlantic regions of the country are making many people miserable, but those in New York City, Philadelphia and other dense, built-up areas are getting hit with the heat in a way their counterparts in suburbs and rural areas aren’t.
Cities absorb more solar energy during the day and are slower to release it after the sun sets, making for uncomfortable nights and no real relief from the heat. And because they haven’t cooled down as much overnight, mornings are warmer and the thermometer goes right back up when the sun starts beating down the next day.
Scientists have known for years about so-called heat islands, urban areas that are hotter than the less-developed areas around them. Cities are just “not well designed to release that summertime heat,” said William Solecki, geography professor at Hunter College and director of the City University of New York’s Institute for Sustainable Cities.
The lack of nighttime relief can make the daytime high temperatures even more difficult for people to take as the days pass and the heat continues, he said.
That’s “where you start to have real problems, if your body’s not cooling down,” Solecki said. “You’re not getting that break.”
Deaths blamed on the heat included a 92-year-old Philadelphia woman whose body was found Monday and a homeless woman found lying next to a car Sunday in suburban Detroit.
The heat-islands effect is significant in the East because “we have a large population living in heavily built-up areas with lots of concrete and lots of steel, good absorbers of heat,” National Weather Service spokesman Sean Potter said.
And there’s nothing like the extreme heat of the past couple of days to make it obvious to everyone.
On Tuesday, the temperature hit 103 degrees in New York City and 102 in Philadelphia, soared past the century mark in Boston, Washington, D.C., and Newark, N.J., and broke records in Providence, R.I., and Hartford, Conn.
The heat-island effect occurs because cities, with their numerous building surfaces and paved roads, absorb more of the solar energy coming from the sun during the day than places that are less built up. At night, those types of surfaces don’t release that accumulated energy as quickly.
Cities also are very dry places, due to the lack of greenery and vegetation that could help bring moisture into the area and keep temperatures down, said Stuart Gaffin, an associate research scientist at Columbia University who focuses on urban climatology and environment.
All that combines to make cities risker places for people during times of extreme heat, he said. “For me,” Gaffin said, “this is the scariest kind of weather.”
Read more here.
The heat was concentrated in the coastal plain and urban areas near the coast and enhanced by downslope compressional warming. Usually the 100F days for the big cities of the northeast come with a northwest wind coming downslope from the higher elevations. This adds 5F or so to the temperature. urban heat islands hold the heat at night. NOAA (thanks to Tom Peterson) and CRU (thanks to Phil Jones and David Parker) denied the contamination effect of urban heat island (UHI) and make no corrections for UHI in their data bases. NOAA USHCN version 1 had such a correction when first implemented in 1990 based on work by Tom Karl (1988). They removed it in version 2 in 2007. NASA GISS to their credit does an urbanization assessment but its corrrective effect is offset by homogenization in the United States and bad metadata globally. They utilize night lights in North America to determine urban, suburban and rural. Globally they had used population but McIntyre showed, their metadata that was used to determine urban vs rural was so bad, they adjusted urban areas warmer as often as cooler. They are moving to night lights globally but the homogenization factor still remains an issue. See more here.
Also predictably, they rolled out their nonsense projections about increasing heat waves in the future today here. Though impressive in the northeast, the heat is not unprecedented and in fact it was moderate in much of the country (typically very warm and humid but not heat waves). Some of the loudest voices are the same clowns that argued that the extreme cold and snow this past winter was weather not climate and should be ignored.
See how the last decade has seen the least number of heat waves since the 1800s in the US and Canada (US below and enlarged here, US and Canada enlarged here).
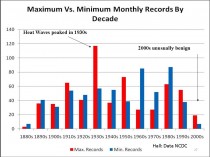
Why we continue to waste our precious research dollars on these useless models is beyond me. Basing policy on them is sheer folly.
|


