The only climate model that agrees with observations says there is NO climate emergency. Meanwhile half of the IPCC models are getting hotter than ever before, hence getting further from reality than ever before. A modeling showdown is looming and CLINTEL is a leader among the climate critics. They make a strong plea that in the current health emergency any climate action should be put on hold. “Why construct a false climate crisis on top of a true corona crisis?”
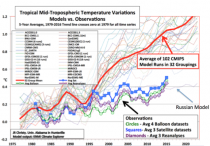
My previous article - ”CLINTEL Manifesto blasts climate scaremongering” - includes the all important graphic showing a dramatic divergence of the IPCC climate model predictions from the satellite temperature readings. The models are all running much hotter than reality.
There is however one major model that agrees with the satellites, that being the Russian model. The reason is simple, yet profound. CLINTEL President professor Guus Berkhout explains it this way: “I have studied Russia’s climate model INM. Unlike IPCC’s models, the Russian INM model predictions fit the measurements remarkably well. A plausible explanation is that it uses a negative cloud feedback: -0.13 W/m2/degree C, while the IPCC models use a large positive cloud feedback: up to + 0.80 W/m2/degree C. This large positive cloud feedback is responsible for the catastrophic IPCC predictions.”
The physics behind this explanation is pretty simple. Warming leads to more water vapor on the air, which causes increased cloudiness. Clouds can then either increase the warming (positive feedback) or decrease it (negative feedback). The scientific question is which occurs? The Russians are finding that it is a negative feedback. Measurements support them.
CLINTEL is an international climate science advisor so it makes sense that they look closely at these findings. Their vision is: “Progress requires Freedom of Speech and Freedom of Scientific Inquiry.” In fact Professor Berkhout has been officially invited by the Russian Academy of Sciences to learn more about the INM model and to share the climate vision of CLINTEL.
Unlike the U.S. and European modelers, the Russian modeling community has not been captured by the alarmists. This has given them the freedom to explore the negative feedback option, which the alarmists have refused to do, at least so far.
Yet even within the alarmist community we see a promising development, as a big fight is shaping up over cloud feedbacks. The IPCC is in the process of writing the latest of its big Assessment Reports, which it does every five years or so, this being the sixth report (AR6). Most of the major alarmist climate models are run to feed into this report.
This time we see that in AR6 about half of these models are running much hotter than they did for the fifth report (AR5). Although the review process is not yet finished, it appears that the AR6 modelers have juiced up the positive cloud feedback. We are not aware of any big new science to support this exaggeration. Has it been done to support the political push for radical zero-carbon laws? The hotter the model the worse the catastrophe it predicts from fossil fuel use, justifying a higher level of panic.
A lot of people within the climate community are questioning this increased global warming in the AR6 model outputs. For one thing it suggests that at least half of the models are wrong, either the half that haven’t become hotter (predicting the same level of panic as in AR5) or the half that have (predicting a higher level of panic as in AR679). In the process the alarmist consensus is coming apart. How the IPCC will handle this schism remains to be seen.
A higher positive cloud feedback may not solve all inconsistencies, but for sure we may state that it is a most unlikely assumption on the modeler’s part. No science compels this choice and measurements strongly advise against it. This opens the door for the empirically confirmed Russian findings, which call into question the entire catastrophe narrative of AR5 and even more AR6.
Professor Berkhout puts it succinctly: “If the Russians are right, the carbon budget - being the amount of carbon mankind may emit before we reach the 1.5 and 2 degree C warming thresholds in The Paris Accord - is very, very large. In other words, there is no problem with continuing CO2 emissions until we have a technologically reliable and economically affordable alternative. Zero emission in 2050 is totally foolish. Looking at the the current health emergency it is a crime against humanity.”
It is ironic, yet fitting, that the “blue sky” fantasy of climate alarmism may be brought back down to earth by clouds. Negative feedback is a truly positive message.
Stay tuned to CFACT to see how this drama unfolds.
David Wojick, Ph.D. is an independent analyst working at the intersection of science, technology and policy. For origins see For over 100 prior articles for CFACT see Available for confidential research and consulting.
I was pleased to see this effort in IBD’s new Issues and Insights effort highlighted below. It is a very much needed addition and we strongly suggest you share and bookmark the story and the site. And financially support their noble and critically important effort.
Let me say something first as an introduction.
Although, I chaired one of the largest departments of meteorology in 6 years in Academia and taught courses at two other colleges and have had 50 years of operational experience with researching and forecasting weather and climate, was Fellow of the AMS, Chair of Weather Analysis and Forecasting committee for the AMS, and elected as a Councilor, I was told by local colleges I was not qualified to teach science. I could tell you many other examples of real scientists being forced out or forced to teach courses like Geography if tenured. Look at GMU for example. Ed Wegman helped expose the climategate saga. He was replaced by environmental radicals and liars. The indoctrination continues. The climate CABAL in government and professional societies and universities controls the message with empty suits as Lead Authors.
Then there is Wikipedia which has used special editors (like Kim Dabelstein Petersen and and William Connolley here) who edit wiki sites that challenge the alarmists position. They change the entries to attack the author or make major changes. They have recently stopped maintaining a list of skeptics. They are hurting as most people get information through search engines that is reducing Wiki coverage. They are begging for donations. Instead please support our site of other sites providing honest science.
The attraction for many is $$$ and plenty of it. Federal funding for climate change research, technology, international assistance, and adaptation has increased from $2.4 billion in 1993 to $11.6 billion in 2014, with an additional $26.1 billion for climate change programs and activities provided by the American Recovery and Reinvestment Act in 2009,” says the GAO. Not a penny goes to anyone who believes it is mostly natural. All our efforts to expose the truth are volunteer (pro-bono). Help us with a donation if you can (left column). If you have an idea how to fund the good scientists being blocked contact me at jdaleo6113@aol.com. Thanks for the help you gave us in 2019 to cover our costs for maintenance for the first time in a few years.
If you count my contributions at Weatherbell.com, I work on 5 web sites:
Icecap.us
Alarmist Claim Research with rebuttals to the dozen alarmist claims in the news and assessments.
Tropical Hot Spot Research started to show our independent peer-reviewed research showing how natural factors can explain the changes we have observed in 14 different data sets.
and one my college roommate wanted me to start Redneckusa with a look at technology - good and bad ideas. See the latest post here on how Ozone Hole Shenanigans were the warm-up act for Global Warming.
Let me know what you think, suggest new stories and submit your own.
--------------
The Academic Blacklist Climate Alarmists Don’t Want You To Know About
February 28, 2020
16 comments
I&I Editorial
The global warming faithful are always quick with the talking points about a “scientific consensus” that doesn’t exist, and the tale that 97% of scientists say man is causing the planet to overheat. But we’ll never hear them discuss publicly how researchers who don’t agree with the narrative have been blacklisted.
What are they afraid of?
Of course the climate alarmists will never admit such a list even exists. But Roger Pielke Jr., who teaches science, environment, and technology policy at the University of Colorado, says it does.
“A climate advocacy group called Skeptical Science hosts a list of academics that it has labeled ‘climate misinformers,” Pielke recently wrote in Forbes. “The list includes 17 academics and is intended as a blacklist.”
Pielke says we know this through a Skeptical Science blogger “named Dana Nuccitelli.” According to Pielke, Nuccitelli believes that Judith Curry should be “unhirable in academia” based on her statements about global warming.
Nuccitelli tweeted that “Curry’s words, as documented… are what make her ‘unhirable.’” Both the blog and Nuccitelli of course deny there’s a blacklist.
The “unhirable” Curry is no crank. She is the former chair of Georgia Tech’s School of Earth and Atmospheric Sciences, and is a fellow of both the American Geophysical Union and American Meteorological Society. She stepped down from her position at Georgia Tech at the insistence of an administrator, she told Pielke. The Earth and Atmospheric Sciences dean had heard from “several activist climate scientists who had a very direct pipeline to the dean’s office, and had expressed their “extreme displeasure” over Curry’s presence at the school, she said.
Curry looked into positions at other universities, interviewed for two, but was never hired. According to her headhunter, “the show stopper” was my public profile in the climate debate.
But there’s no blacklist - nothing to see here, so let’s move on… to Pielke’s father, Roger Pielke Sr. The atmospheric scientist “is also listed on the Skeptical Science blacklist.” The younger Pielke says some statements from the Skeptical Science site that had been obtained through hacking included: “We are HUNTING Pielke,” “We are trying to bring him down,” and “My vote is to take the bastard down!”
What has happened to Curry and Pielke Sr. are not isolated incidents: READ MORE EXAMPLES here.
...
The system is clearly rigged. But the public is not supposed to know this. Only by keeping voters in the dark can the charade continue.
--- Written by J. Frank Bullitt
Issues & Insights is a new site formed by the seasoned journalists behind the legendary IBD Editorials page. We’re just getting started, and we’ll be adding new features as time permits. We’re doing this on a voluntary basis because we believe the nation needs the kind of cogent, rational, data-driven, fact-based commentary that we can provide.
Update: See also how a German Professors says NASA Has Fiddled Climate Data On ‘Unbelievable’ Scale here.
-------------
There’s a top-level oceanographer and meteorologist who is prepared to cry “Nonsense!” on the “global warming crisis” evident to climate modellers but not in the real world. He’s as well or better qualified than the modellers he criticises - the ones whose Year 2100 forebodings of 4 degC warming have set the world to spending $US1.5 trillion a year to combat CO2 emissions.
The iconoclast is Dr. Mototaka Nakamura. In June he put out a small book in Japanese on “the sorry state of climate science”. It’s titled Confessions of a climate scientist: the global warming hypothesis is an unproven hypothesis, and he is very much qualified to take a stand. From 1990 to 2014 he worked on cloud dynamics and forces mixing atmospheric and ocean flows on medium to planetary scales. His bases were MIT (for a Doctor of Science in meteorology), Georgia Institute of Technology, Goddard Space Flight Centre, Jet Propulsion Laboratory, Duke and Hawaii Universities and the Japan Agency for Marine-Earth Science and Technology. He’s published about 20 climate papers on fluid dynamics.
Today’s vast panoply of “global warming science” is like an upside down pyramid built on the work of a few score of serious climate modellers. They claim to have demonstrated human-derived CO2 emissions as the cause of recent global warming and project that warming forward. Every orthodox climate researcher takes such output from the modellers’ black boxes as a given.
A fine example is from the Australian Academy of Science’s explanatory booklet of 2015. It claims, absurdly, that the models’ outputs are “compelling evidence” for human-caused warming.[ii] Specifically, it refers to model runs with and without human emissions and finds the “with” variety better matches the 150-year temperature record (which itself is a highly dubious construct). Thus satisfied, the Academy then propagates to the public and politicians the models’ forecasts for disastrous warming this century.
Now for Dr Nakamura’s expert demolition of the modelling. There was no English edition of his book in June and only a few bits were translated and circulated. But Dr Nakamura last week offered via a free Kindle version his own version in English. It’s not a translation but a fresh essay leading back to his original conclusions.
The temperature forecasting models trying to deal with the intractable complexities of the climate are no better than “toys” or “Mickey Mouse mockeries” of the real world, he says. This is not actually a radical idea. The IPCC in its third report (2001) conceded (emphasis added),
In climate research and modelling, we should recognize that we are dealing with a coupled non-linear chaotic system, and therefore that the long-term prediction of future climate states is not possible. (Chapter 14, Section 14.2.2.2. )]
Somehow that official warning was deep-sixed by the alarmists. Now Nakamura has found it again, further accusing the orthodox scientists of “data falsification” by adjusting previous temperature data to increase apparent warming “The global surface mean temperature-change data no longer have any scientific value and are nothing except a propaganda tool to the public,” he writes.
The climate models are useful tools for academic studies, he says. However, “the models just become useless pieces of junk or worse (worse in a sense that they can produce gravely misleading output) when they are used for climate forecasting.” The reason:
These models completely lack some critically important climate processes and feedbacks, and represent some other critically important climate processes and feedbacks in grossly distorted manners to the extent that makes these models totally useless for any meaningful climate prediction.
I myself used to use climate simulation models for scientific studies, not for predictions, and learned about their problems and limitations in the process.
Nakamura and colleagues even tried to patch up some of the models’ crudeness
...so I know the workings of these models very well… For better or worse I have more or less lost interest in the climate science and am not thrilled to spend so much of my time and energy in this kind of writing beyond the point that satisfies my own sense of obligation to the US and Japanese taxpayers who financially supported my higher education and spontaneous and free research activity. So please expect this to be the only writing of this sort coming from me.
I am confident that some honest and courageous, true climate scientists will continue to publicly point out the fraudulent claims made by the mainstream climate science community in English. I regret to say this but I am also confident that docile and/or incompetent Japanese climate researchers will remain silent until the ‘mainstream climate science community’ changes its tone, if ever.
He projects warming from CO2 doubling, “according to the true experts”, to be only 0.5degC. He says he doesn’t dispute the possibility of either catastrophic warming or severe glaciation since the climate system’s myriad non-linear processes swamp “the toys” used for climate predictions. Climate forecasting is simply impossible, if only because future changes in solar energy output are unknowable. As to the impacts of human-caused CO2, they can’t be judged “with the knowledge and technology we currently possess.”
Other gross model simplifications include
# Ignorance about large and small-scale ocean dynamics
# A complete lack of meaningful representations of aerosol changes that generate clouds.
# Lack of understanding of drivers of ice-albedo (reflectivity) feedbacks: “Without a reasonably accurate representation, it is impossible to make any meaningful predictions of climate variations and changes in the middle and high latitudes and thus the entire planet.”
# Inability to deal with water vapor elements
# Arbitrary “tunings” (fudges) of key parameters that are not understood
Concerning CO2 changes he says,
I want to point out a simple fact that it is impossible to correctly predict even the sense or direction of a change of a system when the prediction tool lacks and/or grossly distorts important non-linear processes, feedbacks in particular, that are present in the actual system…
...The real or realistically-simulated climate system is far more complex than an absurdly simple system simulated by the toys that have been used for climate predictions to date, and will be insurmountably difficult for those naive climate researchers who have zero or very limited understanding of geophysical fluid dynamics. I understand geophysical fluid dynamics just a little, but enough to realize that the dynamics of the atmosphere and oceans are absolutely critical facets of the climate system if one hopes to ever make any meaningful prediction of climate variation.
Solar input, absurdly, is modelled as a “never changing quantity”. He says, “It has only been several decades since we acquired an ability to accurately monitor the incoming solar energy. In these several decades only, it has varied by one to two watts per square metre. Is it reasonable to assume that it will not vary any more than that in the next hundred years or longer for forecasting purposes? I would say, No.”
Good modelling of oceans is crucial, as the slow ocean currents are transporting vast amounts of heat around the globe, making the minor atmospheric heat storage changes almost irrelevant. For example, the Gulf Stream has kept western Eurasia warm for centuries. On time scales of more than a few years, it plays a far more important role on climate than atmospheric changes. “It is absolutely vital for any meaningful climate prediction to be made with a reasonably accurate representation of the state and actions of the oceans.” In real oceans rather than modelled ones, just like in the atmosphere, the smaller-scale flows often tend to counteract the effects of the larger-scale flows. Nakamura spent hundreds of hours vainly trying to remedy the flaws he observed, concluding that the models “result in a grotesque distortion of the mixing and transport of momentum, heat and salt, thereby making the behaviour of the climate simulation models utterly unrealistic...”
Proper ocean modelling would require a tenfold improvement in spatial resolution and a vast increase in computing power, probably requiring quantum computers. If or when quantum computers can reproduce the small-scale interactions, the researchers will remain out of their depth because of their traditional simplifying of conditions.
Key model elements are replete with “tunings” i.e. fudges. Nakamura explains how that trick works
The models are ‘tuned’ by tinkering around with values of various parameters until the best compromise is obtained. I used to do it myself. It is a necessary and unavoidable procedure and not a problem so long as the user is aware of its ramifications and is honest about it. But it is a serious and fatal flaw if it is used for climate forecasting/prediction purposes.
One set of fudges involves clouds.
Ad hoc representation of clouds may be the greatest source of uncertainty in climate prediction. A profound fact is that only a very small change, so small that it cannot be measured accurately...in the global cloud characteristics can completely offset the warming effect of the doubled atmospheric CO2.
Two such characteristics are an increase in cloud area and a decrease in the average size of cloud particles.
Accurate simulation of cloud is simply impossible in climate models since it requires calculations of processes at scales smaller than 1mm. Instead, the modellers put in their own cloud parameters. Anyone studying real cloud formation and then the treatment in climate models would be “flabbergasted” by the perfunctory treatment of clouds in the models.
Nakamura describes as “moronic” the claims that “tuned” ocean models are good enough for climate predictions. That’s because, in tuning some parameters, other aspects of the model have to become extremely distorted. He says a large part of the forecast global warming is attributed to water vapor changes, not CO2 changes. “But the fact is this: all climate simulation models perform poorly in reproducing the atmospheric water vapor and its radiative forcing observed in the current climate… They have only a few parameters that can be used to ‘tune’ the performance of the models and (are) utterly unrealistic.” Positive water vapor feedbacks from CO2 increases are artificially enforced by the modelers. They neglect other reverse feedbacks in the real world, and hence they exaggerate forecast warming.
The supposed measuring of global average temperatures from 1890 has been based on thermometer readouts barely covering 5 percent of the globe until the satellite era began 40-50 years ago. “We do not know how global climate has changed in the past century, all we know is some limited regional climate changes, such as in Europe, North America and parts of Asia.” This makes meaningless the Paris targets of 1.5degC or 2degC above pre-industrial levels.
He is contemptuous of claims about models being “validated”, saying the modellers are merely “trying to construct narratives that justify the use of these models for climate predictions.” And he concludes,
The take-home message is (that) all climate simulation models, even those with the best parametric representation scheme for convective motions and clouds, suffer from a very large degree of arbitrariness in the representation of processes that determine the atmospheric water vapor and cloud fields. Since the climate models are tuned arbitrarily ...there is no reason to trust their predictions/forecasts.
With values of parameters that are supposed to represent many complex processes being held constant, many nonlinear processes in the real climate system are absent or grossly distorted in the models. It is a delusion to believe that simulation models that lack important nonlinear processes in the real climate system can predict (even) the sense or direction of the climate change correctly.
I was distracted from his message because the mix of Japanese and English scripts in the book kept crashing my Kindle software. Still, I persevered. I recommend you do too. There’s at least $US30 trillion ($US30,000, 000,000,000) hanging on this bunfight.
Tony Thomas’s new book, The West: An insider’s tale - A romping reporter in Perth’s innocent ‘60s is available from Boffins Books, Perth, the Royal WA Historical Society (Nedlands) and online here
They include (to give you the flavor)
# “Destabilisation of thermohaline circulation by atmospheric eddy transports”
#"Effects of the ice-albedo [reflectivity] and runoff feedbacks on the thermohaline circulation”
# “Diagnoses of an eddy-resolving Atlantic Ocean model simulation in the vicinity of the Gulf Stream”
# “A simulation study of the 2003 heat wave in Europe”
# “Impacts of SST [sea surface temperature] anomalies in the Agulhas Current System on the climate variations in the southern Africa and its vicinity.”
# “Greenland sea surface temperature changes and accompanying changes in the north hemispheric climate.”
[ii] “Climate models allow us to understand the causes of past climate changes, and to project climate change into the future. Together with physical principles and knowledge of past variations, models provide compelling evidence that recent changes are due to increased greenhouse gas concentrations in the atmosphere ... Using climate models, it is possible to separate the effects of the natural and human-induced influences on climate. Models can successfully reproduce the observed warming over the last 150 years when both natural and human influences are included, but not when natural influences act alone.: A footnote directs to a study by 15 modellers cited in the 2015 IPCC report.
The most significant uncertainties that must be dealt with to properly analyze temperature trends are detailed below. We touch on alarmist claims that are seen in greater detail in the sections of this document summarized in the January 21st blog post under Joe’s Blog.
-------------------
NOAA and NASA can be counted on virtually every month or year’s end to religiously and confidently proclaim that the latest global average surface temperature (GAST) is among the warmest on record. Back in the 1970s when an assessment of a global temperature was first attempted, the scientists recognized that even land-only surface temperature data was a significant challenge given that most of the reliable data was limited to populated areas of the U.S, Europe and eastern China with just spotty often intermittent data from vast land areas elsewhere.
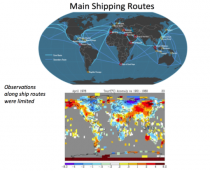
Temperatures over oceans, which covered 71% of the globe, were measured along shipping routes mainly in the Northern Hemisphere erratically and with varying measurement methods. Despite these shortcomings and the fact that absolutely no credible grid level temperature data existed over the period from 1880 to 2000 in the Southern Hemisphere’s oceans (covering 80.9% of the Southern Hemisphere), global average surface temperature data estimation and publication by NOAA and NASA began in the early 1990s.
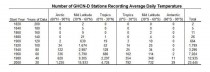
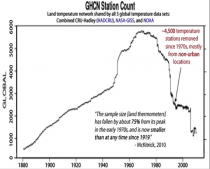
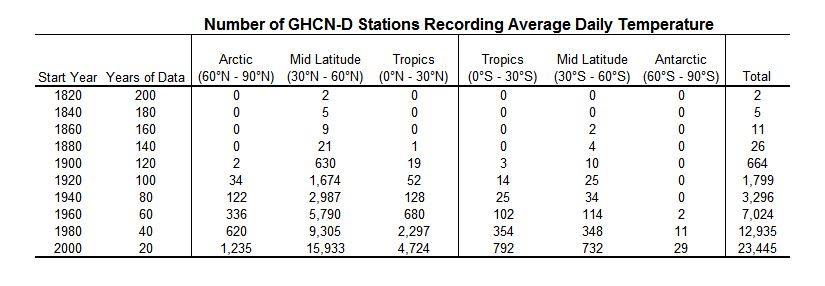
In this era of ever-improving technology and data systems, one would assume that measurements would be constantly improving. This is not the case with the global observing network. The world’s surface observing network had reached its golden era in the 1960s to 1980s, with more than 6,000 stations providing valuable climate information.
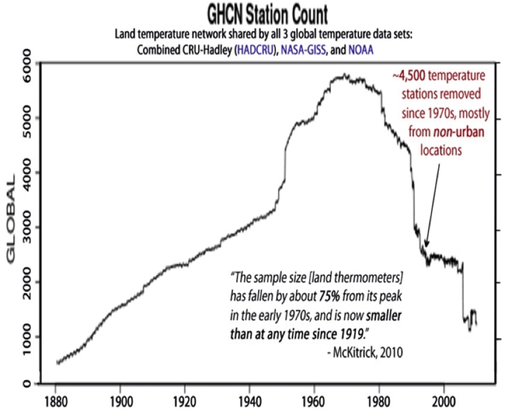
DATA DROPOUT
The number of weather stations providing data to GHCN plunged in 1990 and again in 2005 (as stations in the oversampled lower 48 states were thinned out). The sample size has fallen by over 75% from its peak in the early 1970s, and is now smaller than at any time since 1919. The collapse in sample size has increased the relative fraction of data coming from airports to 49 percent (up from about 30 percent in the 1970s). It has also reduced the average latitude of source data and removed relatively more high-altitude monitoring sites (McKitrick 2010).
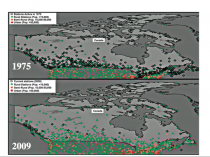
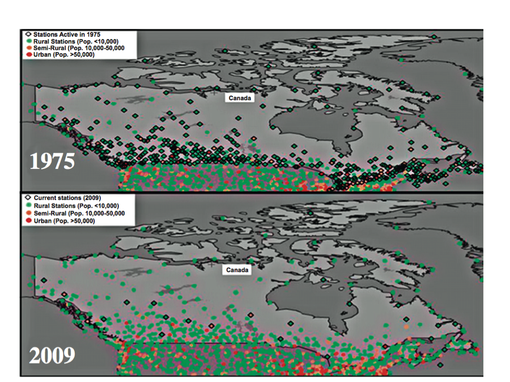
We could show many regional or country examples but here is one, Canada. NOAA GHCN used only 35 of the 600 Canadian stations in 2009. Verity Jones plotted the stations from the full network rural, semi-rural and urban for Canada and the northern United States both in 1975 and again in 2009. She also marked with diamonds the stations used in the given year. Notice the good coverage in 1975 and very poor, virtually all in the south in 2009. Notice the lack of station coverage in the higher latitude Canadian region and arctic in 2009.
Enlarged
Canadian stations used in annual analyses in 1975 and 2009 (source: Verity Jones from GHCN).
Just one thermometer remains in the database for Canada for everything north of the 65th parallel. That station is Eureka, which has been described as “The Garden Spot of the Arctic” thanks to the flora and fauna abundant around the Eureka area, more so than anywhere else in the High Arctic. Winters are frigid but summers are slightly warmer than at other places in the Canadian Arctic.
Environment Canada reported in the National Post, that there are 1,400 stations in Canada with 100 north of the Arctic Circle, where GHCN includes just one.
MISSING MONTHLY DATA
After the 1980s, the network suffered not only from a loss of stations but an increase in missing monthly data. To fill in these large holes, data were extrapolated from greater distances away.
Forty percent of GHCN v2 stations have at least one missing month, It reached 90% in Africa and South America.
According to the World Meteorological Organization’s own criteria, followed by the NOAA’s National Weather Service, temperature sensors should be located on the instrument tower at 1.5 m (5 feet) above the surface of the ground. The tower should be on flat, horizontal ground surrounded by a clear surface, over grass or low vegetation kept less than 4 inches high. The tower should be at least 100 m (110 yards) from tall trees, or artificial heating or reflecting surfaces, such as buildings, concrete surfaces, and parking lots.
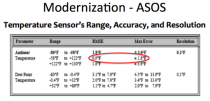
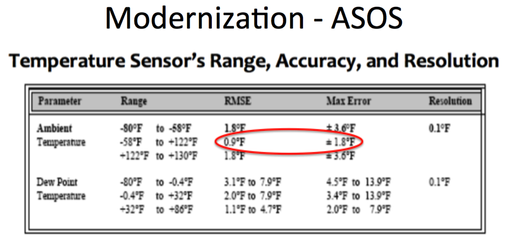
Very few stations meet these criteria. The modernization of weather stations in the United States replaced many human observers with instruments that initially had warm biases (HO-83) and later cold biases (MMTS) or were designed for aviation and were not suitable for precise climate trend detection [Automates Surface Observing Systems (ASOS) and the Automated Weather Observing System (AWOS). Note the specifications required a RMSE of 0.8F and max error of 1.9F. ASOS was designed to supply key information for aviation such as ceiling visibility, wind, indications of thunder and icing. They were not designed for assessing climate.
Also, the new instrumentation was increasingly installed on unsuitable sites that did not meet the WMO’s criteria. During recent decades there has been a migration away from old instruments read by trained observers. These instruments were generally in shelters that were properly located over grassy surfaces and away from obstacles to ventilation and heat sources.
Today we have many more automated sensors (The MMTS) located on poles cabled to the electronic display in the observer’s home or office or at airports near the runway where the primary mission is aviation safety.
The installers of the MMTS instruments were often equipped with nothing more than a shovel. They were on a tight schedule and with little budget. They often encountered paved driveways or roads between the old sites and the buildings. They were in many cases forced to settle for installing the instruments close to the buildings, violating the government specifications in this or other ways.
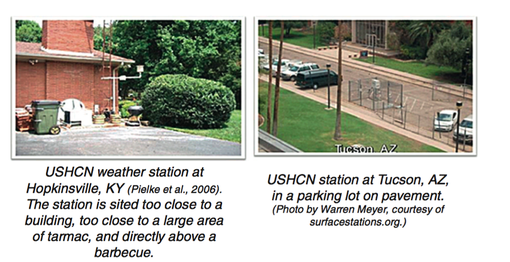
Pielke and Davey (2005) found a majority of stations, including climate stations in eastern Colorado, did not meet WMO requirements for proper siting. They extensively documented poor siting and land-use change issues in numerous peer-reviewed papers, many summarized in the landmark paper “Unresolved issues with the assessment of multi-decadal global land surface temperature trends (2007).
In a volunteer survey project, Anthony Watts and his more than 650 volunteers at www.surfacestations.org found that over 900 of the first 1,067 stations surveyed in the 1,221 station U.S. climate network did not come close to the Climate Reference Network (CRN) criteria. 90% were sited in ways that result in errors exceeding 1C according to the CRN handbook.
Only about 3% met the ideal specification for siting. They found stations located next to the exhaust fans of air conditioning units, surrounded by asphalt parking lots and roads, on blistering-hot rooftops, and near sidewalks and buildings that absorb and radiate heat. They found 68 stations located at wastewater treatment plants, where the process of waste digestion causes temperatures to be higher than in surrounding areas. In fact, they found that 90% of the stations fail to meet the National Weather Service’s own siting requirements that stations must be 30 m (about 100 feet) or more away from an artificial heating or reflecting source.
The average warm bias for inappropriately-sited stations exceeded 1C using the National Weather Service’s own criteria, with which the vast majority of stations did not comply.
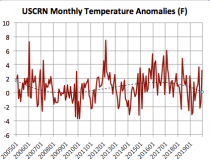
In 2008, Joe D’Aleo asked NOAA’s Tom Karl about the problems with siting and about the plans for a higher quality Climate Reference Network (CRN at that time called NERON). Karl said he had presented a case for a more complete CRN network to NOAA but NOAA said it was unnecessary because they had invested in the more accurate satellite monitoring. The Climate Reference Network was capped at 114 stations and did not provide meaningful trend assessment for about 10 years. Here is the latest monthly time series - now 15 years.
BTW, in monthly press releases no satellite measurements are ever mentioned, although NOAA claimed that was the future of observations.
URBANIZATION/LAND USE CHANGES
The biggest issue though to accurate measurement is urbanization. Bad siting usually enhances the warming effect. Weather data from cities as collected by meteorological stations are indisputably contaminated by urban heat-island bias and land-use changes. This contamination has to be removed or adjusted for in order to accurately identify true background climatic changes or trends.
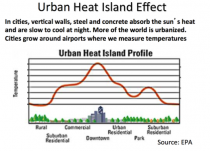
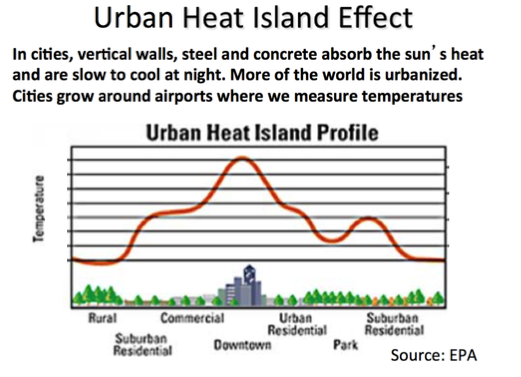
In cities, vertical walls, steel and concrete absorb the sun’s heat and are slow to cool at night. In surrounding suburban areas (often where airports are located), commercialization and increased population densities increase the temperatures at night relative to the surrounding rural areas. More and more of the world is urbanized (population increased from 1.5 B in 1900 to over 7.1 billion today.
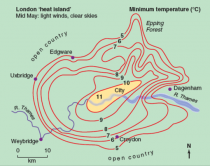
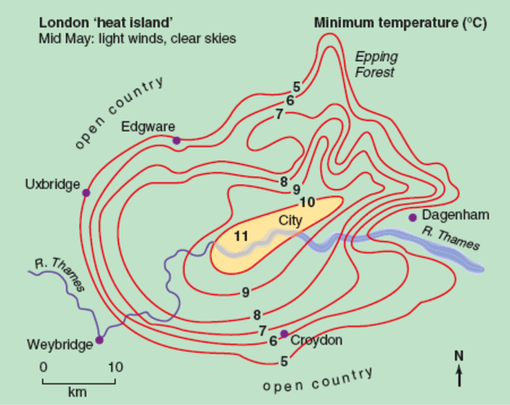
The EPA depicts the typical temperature distribution from city center to rural, similar to the observed minimum temperature analysis surrounding London in mid May (about a 10F difference is shown).
Oke (1973) found a village with a population of 10 has a warm bias of 0.73C, a village with 100 has a warm bias of 1.46 C, a town with a population of 1000 people has a warm bias of 2.2 C, and a large city with a million people has a warm bias of 4.4C.
Zhou et al (2005) have shown global data bases (for China) not properly adjusted for urbanization. Block (2004) showed the same problem exists in central Europe. Hinkel et al (2003) showed even the village of Barrow, Alaska with a population of 4600 has shown a warming of 3.4F in winter over surrounding rural areas, These are but a handful of the dozens of studies documenting the UHI contamination.
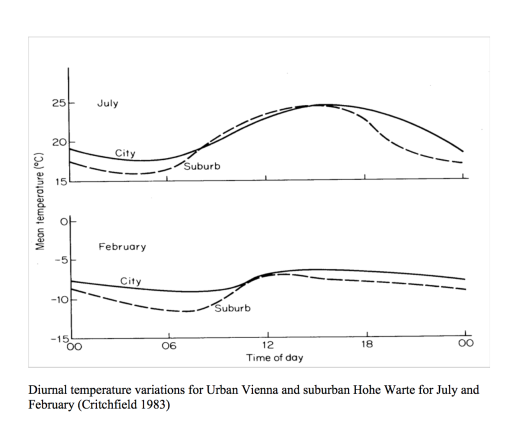
Most confirm the warming is predominantly at night. During the day when the atmosphere is well mixed, the urban and rural areas are much the same. This analysis by in Critchfield (1983) for urban Vienna and suburban Hohe Warte shows the temperature traces for February and July.
Tom Karl whose paper in 1988 defined the UHI adjustment for the first version of USHCN (which was removed in version 2) wrote with Kukla and Gavin in a 1986 paper on Urban Warming:
“MeteoSecular trends of surface air temperature computed predominantly from urban station data are likely to have a serious warm bias… The average difference between trends (urban siting vs. rural) amounts to an annual warming rate of 0.34C/decade… The reason why the warming rate is considerably higher [may be] that the rate may have increased after the 1950s, commensurate with the large recent growth in and around airports.... Our results and those of others show that the urban growth inhomogeneity is serious and must be taken into account when assessing the reliability of temperature records.”
Inexplicably, the UHI adjustment Karl argued for was removed in USHCNv2.
Doug Hoyt, once chief scientist at Raytheon wrote: “It is not out of the realm of possibility that most of the twentieth century warming was urban heat islands.’
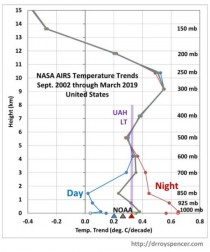
It continues to show up in the data. The nighttime temperatures the last 17 years (NASA AIRS) have warmed in the United States while daytime changes, the best measure of any warming have been very small.
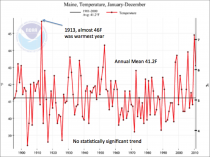
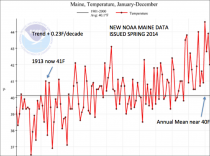
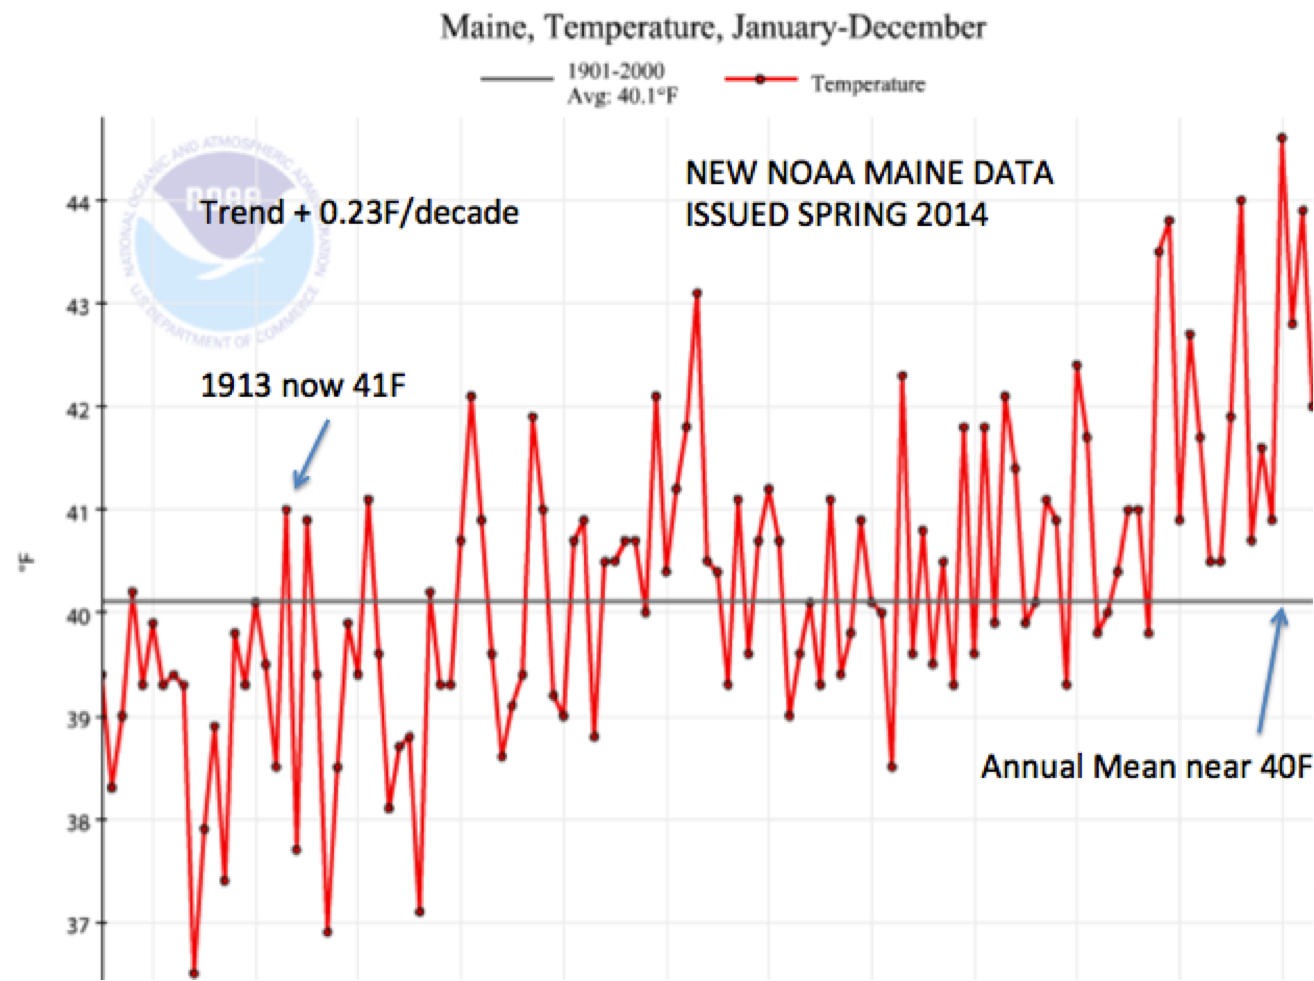
As an example of before and after, the average annual temperatures for the state of Maine downloaded in 2010 before the change (-0.01F/decade) and after the change in 2012 (+0.23F/decade) says it all. We could provide literally hundreds of other examples. Bloggers in many other countries have shown startling examples of fraud.
This is needed when a station is missing data for a month or months. It is accomplished using anomalies. For areas where there are adequate close-by surrounding stations, the assumptions that despite the local temperature differences, most sites will have a similar anomaly (departure from normal) is a reasonable one. But for infilling they can go as far as 1200 km (750miles) away to find data. At longer ranges this become problematic. Take for example northern Canada or the arctic where they must extrapolate over vast distances.
HOMOGENIZATION
This adjustment that blends data for all stations was designed to detect previously undisclosed inhomogeneities (station moves or siting changes) and adjust for urbanization. It may help detect siting discontinuities but is not an adequate substitute for UHI adjustment. The rural stations if properly sited and the Climate Reference network of stations should be reference to adjust the urban stations.
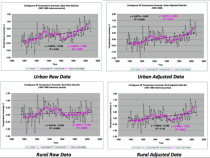
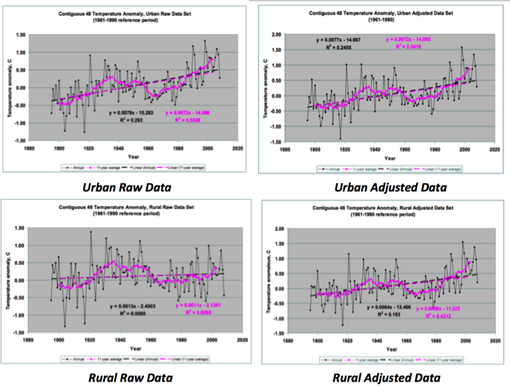
Instead through homogenization the rural areas are contaminated by urban stations, Dr. Edward Long from NASA examined a set of rural and urban stations in the lower 48 states both raw and adjusted. After adjustment, the rural warming rates increased 5 fold while urban warming rates were only slightly reduced. This augmented not eliminated UHI contamination.
The other data set that presents a challenge for a precise assessment of global average surface temperature (GAST) is world’s oceans, which cover 71% of the globe.
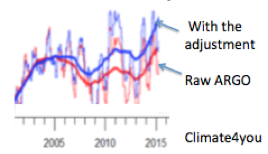
Major questions persist about how much and when to adjust for changing coverage and measurement techniques from buckets to ship intake, to moored and drifting buoys, satellite skin temperature measurements and now ARGO diving buoys.
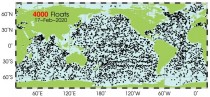
ARGO network of 3341 diving buoys and floats introduced in 2003 (now 4000) were designed to improve the assessment going forward.
But despite the fact this technology was designed specifically for the purpose, the early ARGO buoys, disappointed by showing no confirmation of an upward trend. So the data from the buoys was “adjusted.” John Bates, data quality officer with NOAA admitted “They had good data from buoys...and “corrected” it by using the bad data from ships. You never change good data to agree with bad, but that’s what they did - so as to make it look as if the sea was warmer.”
That was just the latest example of data manipulation. Initially, this global data had a cyclical pattern similar to previously reported Northern Hemisphere data (high in the 1930s and 40s, low in the 70s). Then, as time progressed, the previous officially reported GAST data history was modified, removing the cycle and creating a more and more strongly upward sloping linear trend in each freshly reported historical data set. Peer reviewed, published and readily reproducible research has shown that: “The conclusive findings were that the three GAST data sets are not a valid representation of reality.”
In fact, the magnitude of their historical data adjustments, which removed their cyclical temperature patterns are completely inconsistent with published and credible U.S. and other temperature data. Thus, despite current assertions of record-setting warming, it is impossible to conclude from the NOAA and NASA data sets that recent years have been the “warmest ever.”
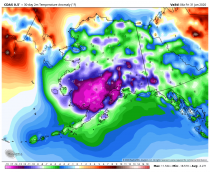
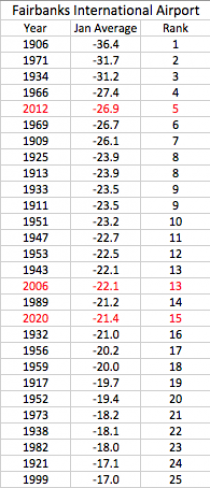
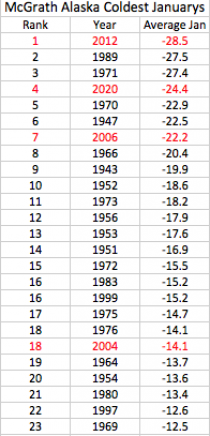
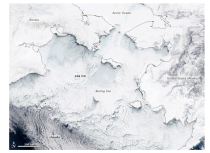
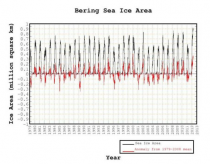
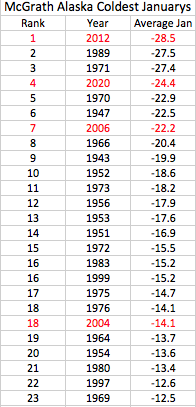
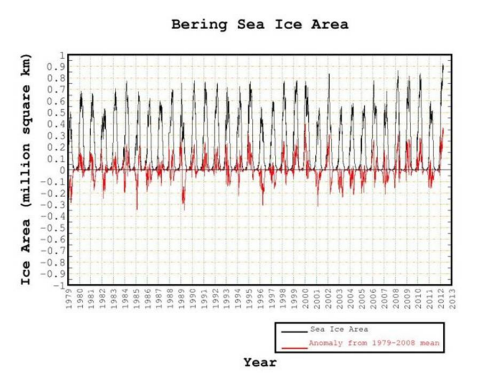
Note that 2012 ranked as 5th coldest in Fairbanks and coldest in McGrath. It had very cold water off the coast then and modern day record Bering Sea ice resulted.
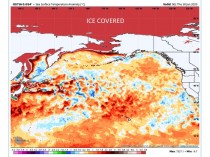
Early departure of Bering Sea ice in 2019 due to strong NPAC storms lead to early ocean warming and record early summer high temperatures.
When NCEI has the monthly data, we will repost with graph of Januarys statewide.
Often cold Alaska retards cold in the lower 48.???
See earlier story when heat followed early Bering Sea ice loss in last years’ warmer winter here.
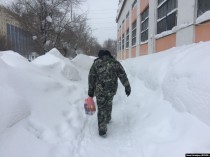
Meanwhile in Saudi Arabia, record cold and snow.
And at Kazakh, capital of Kazakhstan, snow brought deep cold. The cold developed over the deep snowcover, the +NAO had Atlantic flow into Europe and Russia, deflecting the cold air south into Kazakhstan and the Middle East.
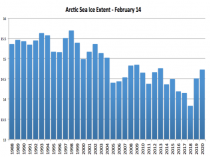
With the cold continuing in the arctic and Alaska, ice has increased for the second year in a row.


_thumb.png)


_thumb.png)


_thumb.gif)
_thumb.png)
.png)