

Massive Cover-up Exposed: 285 Papers From 1960s-’80s Reveal Robust Global Cooling Scientific ‘Consensus’
By Kenneth Richards on NoTricksZone
Beginning in 2003, software engineer William Connolley quietly removed the highly inconvenient references to the global cooling scare of the 1970s from Wikipedia, the world’s most influential and accessed informational source.
It had to be done. Too many skeptics were (correctly) pointing out that the scientific “consensus” during the 1960s and 1970s was that the Earth had been cooling for decades, and that nascent theorizing regarding the potential for a CO2-induced global warming were still questionable and uncertain.
Not only did Connolley - a co-founder (along with Michael Mann and Gavin Schmidt) of the realclimate.com blog - successfully remove (or rewrite) the history of the 1970s global cooling scare from the Wikipedia record, he also erased (or rewrote) references to the Medieval Warm Period and Little Ice Age so as to help create the impression that the paleoclimate is shaped like Mann’s hockey stick graph, with unprecedented and dangerous 20th/21st century warmth.
A 2009 investigative report from UK’s Telegraph detailed the extent of dictatorial-like powers Connolley possessed at Wikipedia, allowing him to remove inconvenient scientific information that didn’t conform to his point of view.
“All told, Connolley created or rewrote 5,428 unique Wikipedia articles. His control over Wikipedia was greater still, however, through the role he obtained at Wikipedia as a website administrator, which allowed him to act with virtual impunity. When Connolley didn’t like the subject of a certain article, he removed it - more than 500 articles of various descriptions disappeared at his hand. When he disapproved of the arguments that others were making, he often had them barred - over 2,000 Wikipedia contributors who ran afoul of him found themselves blocked from making further contributions. Acolytes whose writing conformed to Connolley’s global warming views, in contrast, were rewarded with Wikipedia’s blessings. In these ways, Connolley turned Wikipedia into the missionary wing of the global warming movement.”
After eviscerating references to 1970s global cooling scare and the warmer-than-now Medieval Warm Period from Wikipedia, and after personally rewriting the Wikipedia commentaries on the greenhouse effect to impute a central, dominant role for CO2, Connolley went on to team up with two other authors to publish a “consensus” manifesto in 2008 that claimed to expose the 1970s global cooling scare as a myth, as something that never really happened.
Peterson, Connolley, and Fleck (2008, hereafter PCF08) published “The Myth of the 1970s Global Cooling Scientific Consensus” in Bulletin of the American Meteorological Society, hoping to quash once and for all the perception that there were scientists in the 1960s and 1970s who agreed the Earth was cooling (and may continue to do so), or that CO2 did not play a dominant role in climate change.
The Concoction Of ‘Consensus’ Achieved Via Exclusion
The primary theme of PCF08 can be summarized in 4 succinctly quoted sentences from the paper:
“[T]he following pervasive myth arose [among skeptics]: there was a consensus among climate scientists of the 1970s that either global cooling or a full-fledged ice age was imminent. A review of the climate science literature from 1965 to 1979 shows this myth to be false… During the period from 1965 through 1979, our literature survey found 7 cooling, 20 neutral, and 44 warming papers...There was no scientific consensus in the 1970s that the Earth was headed into an imminent ice age. Indeed, the possibility of anthropogenic warming dominated the peer-reviewed literature even then.”
William Connolley and colleagues claimed that the determination of scientific “consensus” regarding global cooling and the influence of CO2 on climate during the 1970s could be divined by counting scientific publications that fell into arbitrarily-defined categories which allowed them to intentionally exclude hundreds of papers that would undermine the alleged myth-slaying purpose of the paper.
The PCF08 authors decided that when “quantifying the consensus” (by counting publications), a scientific paper could only be classified as a “cooling” paper if it projected that future temperatures would (continue to) decline, or that a “full-fledged ice age was imminent.” Papers published during the arbitrarily chosen 1965-’79 era that affirmed the climate had already been cooling for decades, that this cooling wasn’t a positive development, and/or that the effects of CO2 on climate were questionable or superseded by other more influential climate change mechanisms… were not considered worthy of classification as a “cooling” paper, or as a paper that disagreed with the claimed “consensus” that said the current (1960s-1970s) global cooling will someday be replaced by CO2-induced global warming.
Of course, the global cooling scare during the 1970s was not narrowly or exclusively focused upon what the temperatures might look like in the future, or whether or not an ice age was “imminent”. It was primarily about the ongoing cooling that had been taking place for decades, the negative impacts this cooling had already exerted (on extreme weather patterns, on food production, etc.), and uncertainties associated with the causes of climatic changes.
By tendentiously excluding 1960s and 1970s publications that documented global cooling had been ongoing and a concern, as well as purposely excluding papers that suggested the climate’s sensitivity to CO2 forcing is weak or questionable relative to other mechanisms, the authors could brazenly claim that there were only 7 papers published in the scientific literature between 1965 and 1979 that disagreed with the “consensus” opinion that global warming would occur at some point in the future (due to CO2 increases). According to PCF08, there were 44 papers that fell into the latter warming-is-imminent-due-to-CO2 category from 1965-’79, ostensibly entitling them to claim that dangerous anthropogenic global warming projections “dominated” the scientific literature even then.
An 83% Global Cooling/Weak CO2 Influence Scientific ‘Consensus’ During 1960s, ‘70s
As will be shown here, the claim that there were only 7 publications from that era disagreeing with the presupposed CO2-warming “consensus” is preposterous. Because when including the papers from the 1960s and 1970s that indicated the globe had cooled (by -0.3C between the 1940s and ‘70s), that this cooling was concerning (leading to extreme weather, drought, depressed crop yields, etc.), and/or that CO2’s climate influence was questionable to negligible, a conservative estimate for the number of scientific publications that did not agree with the alleged CO2-warming “consensus” was 220 papers for the 1965-’79 period, not 7. If including papers published between 1960 and 1989, the “non-consensus” or “cooling” papers reaches 285.
Again, these estimates should be viewed as conservative. There are likely many dozen more scientific papers from the 1960s-’70s cooling scare era that would probably fall into the category of a “cooling” paper, but have not yet been made available to view in full online.
But let us say that the PCF08 claim is true, and that there were indeed only 44 papers published between 1965-’79 that endorsed the position that the Earth’s climate is predominately shaped by CO2 concentrations, and thus the Earth would someday start warming as the models had suggested. Interestingly, if we were to employ the hopelessly flawed methodology of divining the relative degree of scientific “consensus” by counting the number of papers that agree with one position or another (just as blogger John Cook and colleagues did with their 2013 paper “Quantifying the Consensus..” that yielded a predetermined result of 97% via categorical manipulation), the 220 “cooling” papers published between 1965-’79 could represent an 83.3% global cooling consensus for the era (220/264 papers), versus only a 16.7% consensus for anthropogenic global warming (44/264 papers).
The 1970s Global Cooling Scare Was Not Mythological
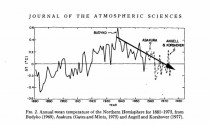
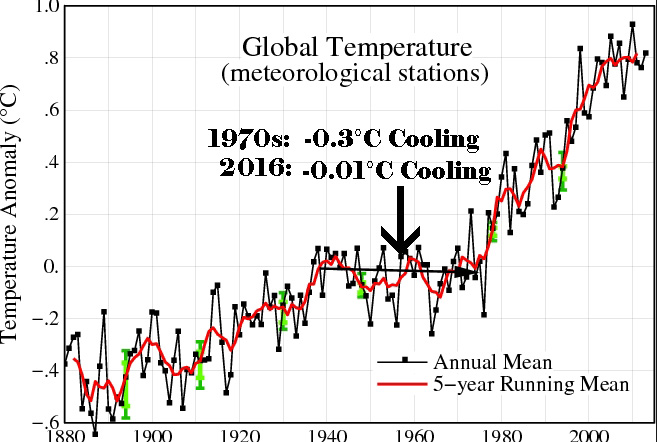
In reviewing the available scientific literature from the 1960s-’80s, it is plainly evident that there was a great deal of concern about the ongoing global cooling, which had amounted to -0.5C in the Northern Hemisphere and -0.3C globally between the 1940s and 1970s.
Of course, this inconvenient global-scale cooling of -0.3C between the 1940s and 1970s has necessarily been almost completely removed from the instrumental record by NASA (GISS) and the MetOffice (HadCRUT). After all, the observations (of cooling) conflicted with climate modeling. Overseers of the surface temperature datasets (such as the MetOffice’s Phil Jones or NASA’s Gavin Schmidt) have recently adjusted the -0.3C of cooling down to just hundredths of a degree of cooling. NASA GISS, for example, has reduced (via “adjustments") the global cooling down to about -0.01C between the 1940s and 1970s, as shown below. It is likely that, during the next few years of adjustments to past data, the mid-20th century global cooling period will disappear altogether and mutate into a warming period.
For those who actually experienced the non-mythological cooling scare during the 1960s and 1970s (that has since been made to disappear from graphs), the consequences of the -0.5 Northern Hemispheric cooling (especially) were frequently discussed in scientific publications. There were geoengineering strategies proposed by scientists to melt Arctic sea ice. Droughts and floods and extreme weather anomalies/variability were blamed on the ongoing global cooling. Glaciers were advancing, even surging at accelerated rates during this period. Sea ice growth and severe Arctic cooling meant that the oceans were much less navigable. Crop growth and food production slowed as the Earth cooled, which was of great concern to world governments. Severe winters in the 1960s and 1970s led many climatologists to assume that the Earth was returning to an 1800s-like Little Ice Age climate. Observations of mammals migrating to warmer climates during the 1960s and 1970s due to the colder temperatures were reported in scientific papers.

For those who actually experienced the non-mythological cooling scare during the 1960s and 1970s (that has since been made to disappear from graphs), the consequences of the -0.5 Northern Hemispheric cooling (especially) were frequently discussed in scientific publications. There were geoengineering strategies proposed by scientists to melt Arctic sea ice. Droughts and floods and extreme weather anomalies/variability were blamed on the ongoing global cooling. Glaciers were advancing, even surging at accelerated rates during this period. Sea ice growth and severe Arctic cooling meant that the oceans were much less navigable. Crop growth and food production slowed as the Earth cooled, which was of great concern to world governments. Severe winters in the 1960s and 1970s led many climatologists to assume that the Earth was returning to an 1800s-like Little Ice Age climate. Observations of mammals migrating to warmer climates during the 1960s and 1970s due to the colder temperatures were reported in scientific papers.
Synonyms for the 1960s-’70s climate cooling conditions commonly used in the literature were words such as deterioration, recession, detrimental, and severe. In contrast, warming periods such as during the warmer Medieval times or the warm-up during the first half of the 20th century were referred to positively, or as optimum (i.e., the Medieval Warm Period was referred to as the “Little Optimum").
According to Stewart and Glantz (1985), in the early 1970s it was the “prevailing view” among scientists that the Earth was headed into another ice age. It wasn’t until the late ‘70s that scientists changed their minds and the “prevailing view” began shifting to warming. This is in direct contradiction to the claims of PCF08, who allege warming was the prevailing view among scientists in the 1960s and early 1970s too. Furthermore, as recently as 1985, it was still acknowledged that “the causes of global climate change remain in dispute.”
Stewart and Glantz, 1985
“The conclusions of the NDU study might have been predicted from a knowledge of the prevailing ‘spirit of the times’ (i.e., the prevailing mood in the science community) when the first part was conducted. This was an interesting time in recent history of climate studies. One could effectively argue that in the early 1970s the prevailing view was that the earth was moving toward a new ice age. Many articles appeared in the scientific literature as well as in the popular press speculating about the impact on agriculture of a 1-2C cooling. By the late 1970s that prevailing view had seemingly shifted 180 degrees to the belief that the earth’s atmosphere was being warmed as a result of an increasing CO2 loading of the atmosphere. ... The causes of global climate change remain in dispute. Existing theories of climate, atmospheric models, and actuarial experience are inadequate to meet the needs of policymakers for information about future climate.”
According to scientists reporting to the U.S. Central Intelligence Agency (1974), 22 of 27 forecasting methods predicted a cooling trend for the next 25 years, and “meteorological experts” were thinking an 1800s climate was around the corner, with the concomitant return to monsoon failures, shorter growing seasons, and “violent weather”.
U.S. Central Intelligence Agency,1974
Potential Implications of Trends in World Population, Food Production, and Climate
“According to Dr. Hubert Lamb–an outstanding British climatologist, 22 out of 27 forecasting methods he examined predicted a cooling trend through the remainder of this century. A change of 2-3 F. in average temperature would have an enormous impact… A number of meteorological experts are thinking in terms of a return to a climate like that of the 19th century. This would mean that within a relatively few years (probably less than two decades, assuming the cooling trend began in the 1960’s) there would be brought belts of excess and deficit rainfall in the middle-latitudes; more frequent failure of the monsoons that dominate the Indian sub-continent, south China and western Africa; shorter growing seasons for Canada, northern Russia and north China. Europe could expect to be cooler and wetter… [I]n periods when climate change [cooling] is underway, violent weather - unseasonal frosts, warm spells, large storms, floods, etc. is thought to be more common.”
------------
See in Real Science how NOAA adjustments increased July warming by 1000% here.
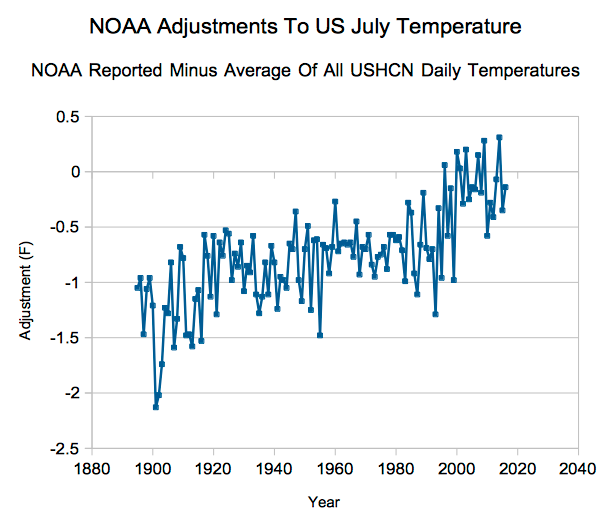
NOAA’s NCED (National Center for Environmental Disinformation) creates this warming by massively cooling the past. They got rid of the hot 1901 by cooling it 2.13 degrees. The cooled 1936 by by 1.13 degrees and cooled 1934 by 1.11 degrees. That is what it took to elevate 2012 to the hottest July.
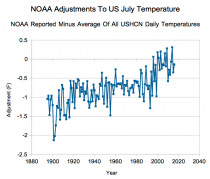
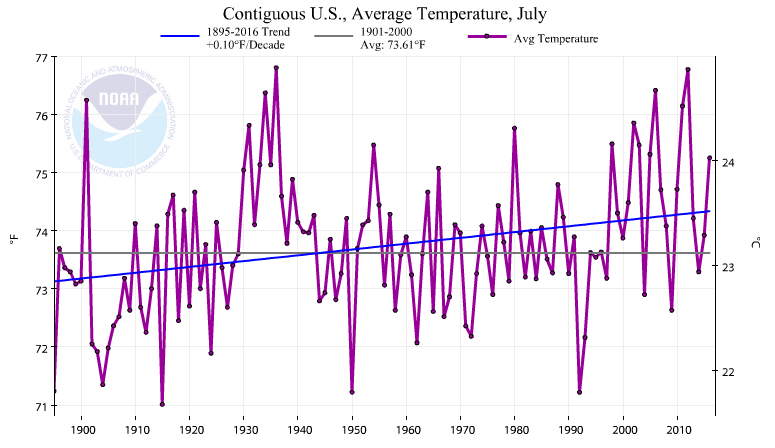
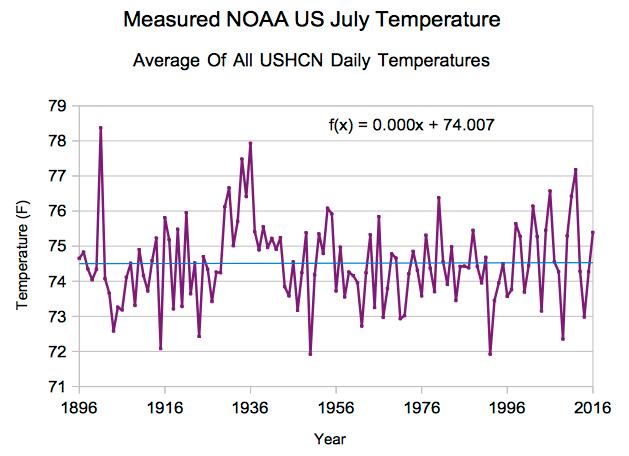
NOAA shows July temperatures increasing at 1.0F per century since 1895, with 2012 tied with 1936 as the hottest July.

Enlarged
Climate at a Glance | National Centers for Environmental Information (NCEI)
The actual raw temperature data they use to generate their graph, shows one tenth as much warming from 1895 to 2016, with 1901, 1936 and 1934 as the hottest years.
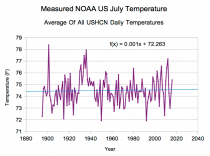
If 1895 is removed, there is no warming at all.

NOAA creates this warming by massively cooling the past. They got rid of the hot 1901 by cooling it 2.13 degrees. The cooled 1936 by by 1.13 degrees and cooled 1934 by 1.11 degrees. That is what it took to elevate 2012 to the hottest July.
_thumb.png)
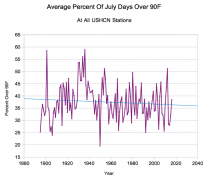
A good measure of how fraudulent the NOAA adjustments are, is the percent of days over 90 degrees. July 1936, 1901, 1934, 1931, 1930 and 1954 all had more days over 90 degrees than 2012 did, yet NOAA shows 2012 as the hottest. The frequency of 90 degree days in the US has declined since the start of records in 1895. July 2016 (NASA’s hottest July ever) was almost exactly average since 1895.
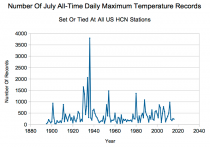
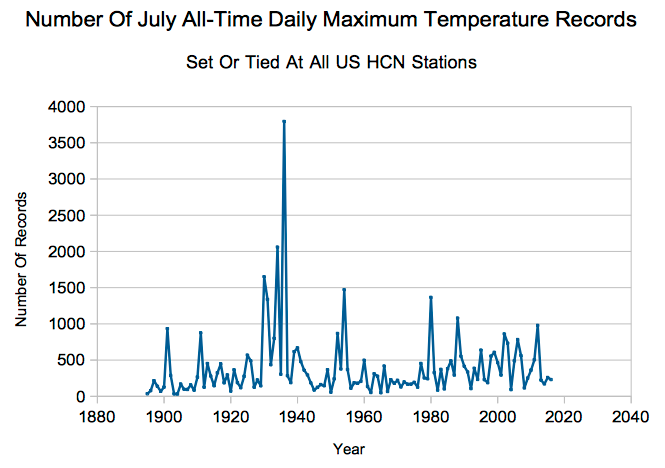
Another very good measure of how fraudulent the NOAA graph is, is the number of July daily maximum temperature records. The 1930’s were much hotter than any recent years.
The claimed warming trend in the US is completely fake, and is altered by people at NOAA who are being paid to push the global warming agenda. Before they were paid to push anthropogenic warming, the very same people at NOAA (i.e. Tom Karl) knew that there was no US warming.
Enlarged
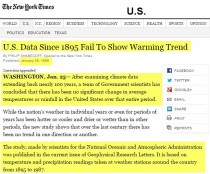
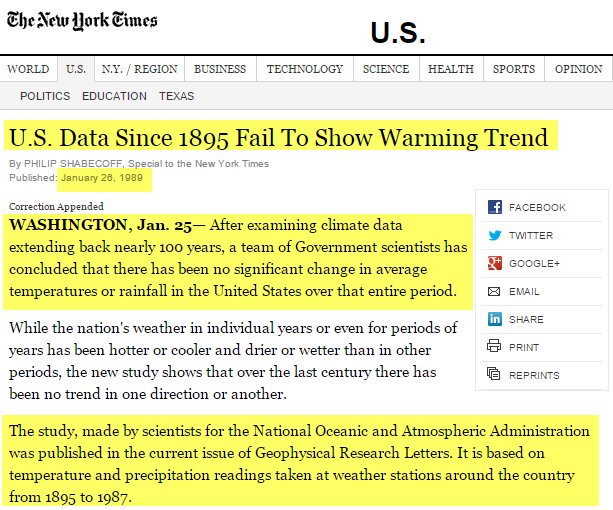
U.S. Data Since 1895 Fail To Show Warming Trend - NYTimes.com
The US makes up less than 10% of the land surface, but contains the majority of the high quality long term temperature monitoring stations for this planet. The global surface temperature record is a farce, which is why the US data is so important.
Alan Carlin/ August 25, 2016
My last post concerned the misplaced faith by climate alarmists in the catastrophic anthropogenic global warming (CAGW) hypothesis despite the lack of valid evidence for it. This post concerns one of their other major articles of faith–that substitution of wind and solar for fossil fuel energy can meet US needs for energy to maintain our modern economy and society. The most recent manifestation of this faith can be found in the 2016 Democratic Party Platform, which includes these points:
We believe America must be running entirely on clean energy by mid-century.
We are committed to a national mobilization, and to leading a global effort to mobilize nations to address this threat on a scale not seen since World War II.
Is an End to Fossil Fuel Use a Practical Possibility by 2050?
So let’s assume that there is a need to end all human-caused carbon dioxide (CO2) emissions in the US despite the lack of any valid evidence that this is the case, and ask whether this is actually possible by 2050 while maintaining US electricity reliability and energy availability. I have previously pointed out the very adverse effects of the current EPA efforts to reduce US use of fossil fuel sources of electricity on US electricity prices. This effort is small compared to what would be required for total elimination of fossil fuels in the US by 2050. This would require prohibiting emissions from fossil fueled vehicles, civilian and military airplanes, military tanks and other vehicles, home heating and air conditioning, lawnmowers and other yard equipment, earth moving equipment, etc., in addition to those from electrical generation.
Three weeks ago I pointed out that the cost of actually doing this would be infinite because of the impossibility of building enough wind and solar capacity to meet even present needs let alone greatly expanded uses necessary to meet all energy needs using wind and solar during periods when the sun does not shine and the wind does not blow and abundant hydroelectric energy is not available. Little wind and sun means little energy generation using wind and solar despite the necessity to do so to avoid disastrous grid breakdowns if demand exceeds supply.
Ending Fossil Fuel Use Is Currently Not a Practical Possibility
This week I would like to report on an interesting experiment and to summarize what we know about the cost and feasibility of the Democratic Platform plan. The interesting experiment has been going on in an isolated area of South Korea which tried to meet its electricity needs without using fossil fuels. The local power company paid the cost of trying to eliminate the use of fossil fuels for generating electricity and paid for solar plus wind nameplate capacity three times higher than the highest previous usage and four times average usage. They also installed a large battery as a backup that could hold enough energy for over a day of ordinary usage.
The experiment failed, however, when during a recent accounting period they were forced to use backup diesel generators for 58% of all electricity because of lack of sufficient wind or sunlight-generated electricity. The cost of all this, if it had been paid by the residents, would have amounted to about $1100 per month in an average resident’s electric bill (compared to US average bills of about $100). All this investment achieved only a 42% decrease in CO2 emissions from electrical generation and thus came nowhere near fossil fuel independence even for electricity generation. When the energy use by vehicles is figured in, this comes to about a 20% decrease in CO2 combined emissions. Their experience mirrors the problems in Western Europe so appears quite believable.
So what does all this mean? Putting together this and other fragmentary and scattered data suggests the following increases in energy prices for substituting wind and solar for fossil fuel sources:
For electricity only: EPA “Clean Power Plan” (about a 25% emissions reduction over what they would have been): Factor of three or four increase based on European experience.
For electricity only: South Korea (42% emissions reduction): Factor of about 10 increase based on US prices.
For electricity only: Full conversion to wind and solar: Infinite increases since it cannot be done without grid collapse during periods when sun does not shine and the wind does not blow.
For electricity plus vehicles: South Korea (about 20% emissions reductions): Factor of about 10 increase.
For all uses of energy: Infinite increases would not meet this goal in the US.
So the general picture suggested is that of perhaps a linear increase in costs initially as substitution proceeds followed by an increasingly steep increase to infinity at higher levels of substitution.
Thus if the Federal Government should carry out the Platform goals all the resources available would not be sufficient to actually meet this goal, so even if the substitution should become the driving purpose of society as under the proposed World War II style mobilization advocated in the Platform, it still could not be achieved. I question whether the American people really want to cover more and more land area with hideous wind and solar thermal generating plants, cover more roofs with ugly solar panels, kill ever more birds and bats, and pay ever higher energy bills with no possibility of ever reaching the proponents’ unreachable goal, which would have no measurable effect on global temperatures even if achieved.
So a Major Political Party Has Apparently Lost Touch with Reality
Yet one of the two largest US political parties advocates that the US Government intervene in the energy markets to do the impossible–and bring great economic hardship to less wealthy US households. Could it be that they have lost all touch with the reality of wind and solar generation and do not care what happens to the less wealthy members of society in their blind desire to reach an abstract goal of energy purity of no real significance?