

By Joseph D’Aleo, CCM
The NYT continues its leftist lie campaign with a story on snow disappearing called ”The End of Snow” by Porter Fox, a reporter for Powder magazine.
It includes this claim:
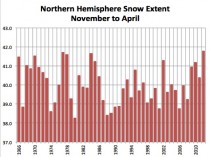
In the last 47 years, a million square miles of spring snow cover has disappeared from the Northern Hemisphere.
Yes but skiers ski in winter. Lets check the facts.
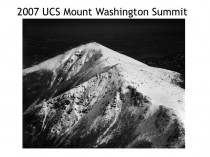
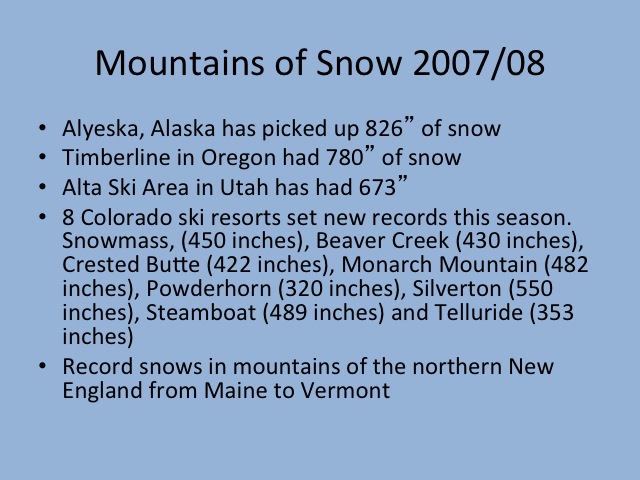
Since 2000, claims have been made by warmists that snow would become a rare commodity. Not only would this disappoint children but would endanger the ski industry (and in New England Maple Sugar industry as the maple trees would pack their bag and move north to Canada). This claim was made to ski areas and the maple sugar industry at a summit on top of Mt. Washington by the Union of Concerned Scientists (an environmental advocacy group - not real scientists) in the summer of 2007.
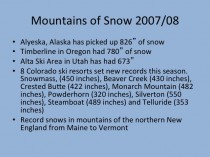
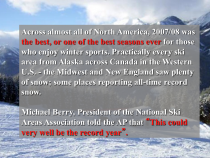
That winter that followed, record snows fell from Alaska to Colorado and northeast to northern and central New England. Michael Berry, President of the National Ski Area Association said it was likely the best season ever.
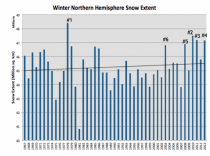
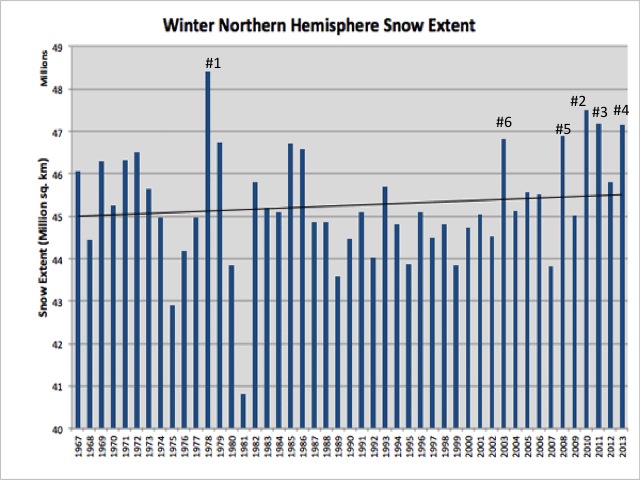
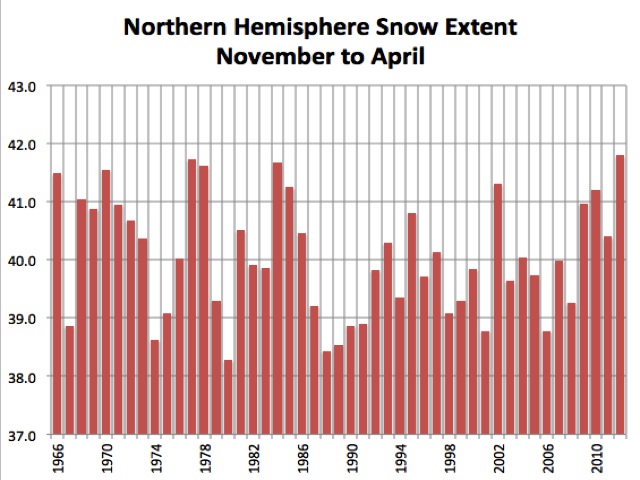
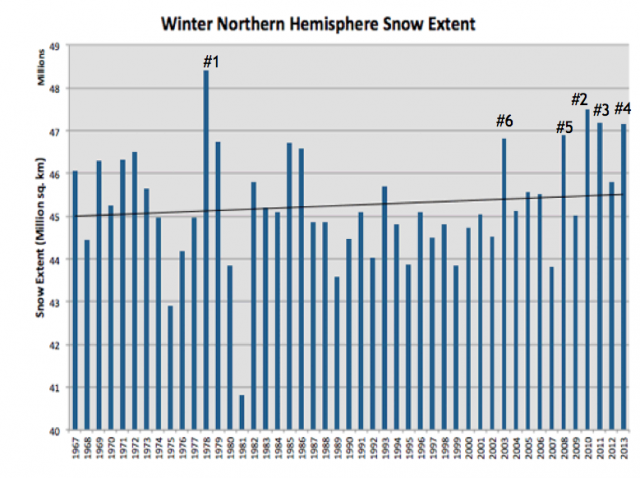
Snow has been increasing in thee fall and winter the last 48 years.
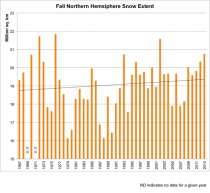
4 of the top 5 snowiest winters for the northern hemisphere have occurred in the last 6 years.
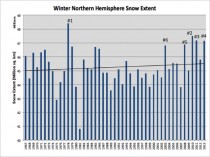
Last November to April had a record snowcover for the hemisphere.
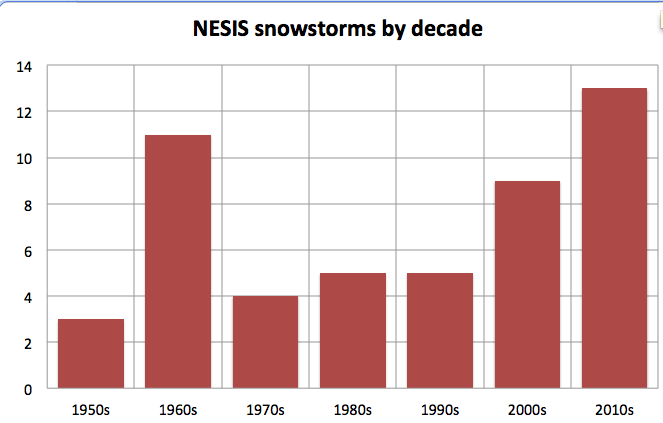
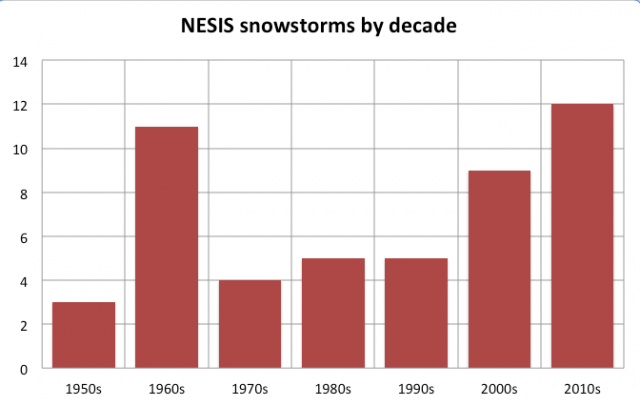
The number major impact east cost storms this decade just 4 years in is up to 13 (3 already this year), makes this the snowiest decade on record.

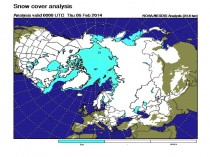
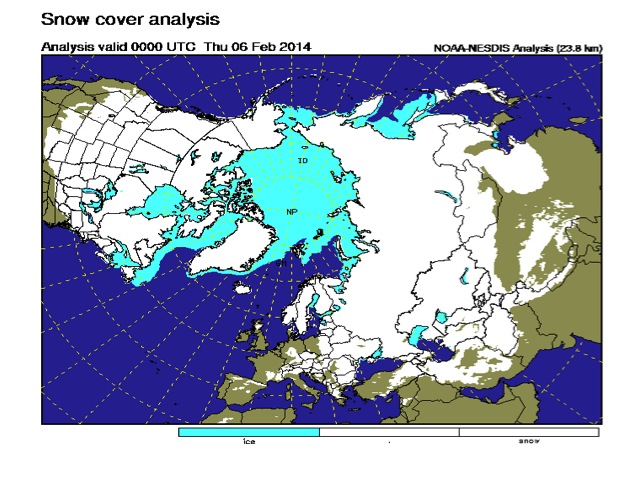
The snowcover today for the hemisphere is extensive even with a gap in Europe (after 5 snowy years).
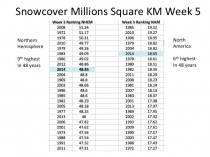
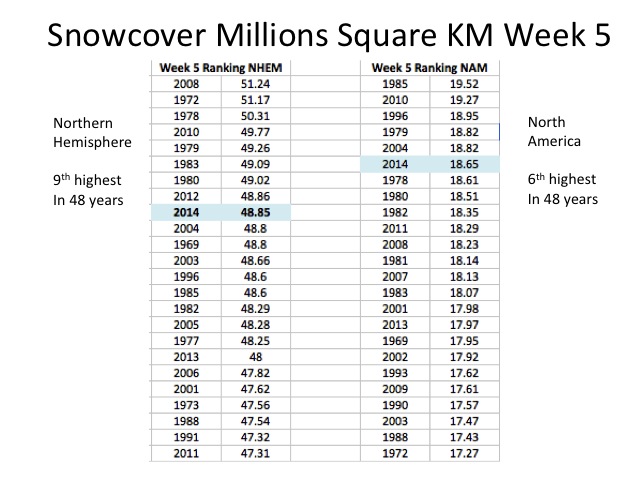
The snowcover for the first week of February is 6th greatest for North America and 9th greatest for the Northern Hemisphere (out of the 48 years the NYT article claims).
Another few winters like those of recent years and maybe the psuedo-scientists and their adoring fact-less feckless media may be preserved in ice for future generation’s amusement.
By Joseph D’Aleo, CCM
AMS is meeting in Atlanta this week as the north gets buried in snow and cold continues. The academics though still are pushing their agenda making the meeting uncomfortable for those who don’t buy into the scam. Many skeptics have left the society. Many like me remain because we have earned a CCM, a Broadcast Seal or CBM, designation as a Fellow. We will prevail. We want to be around to pick up the pieces.
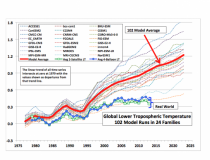
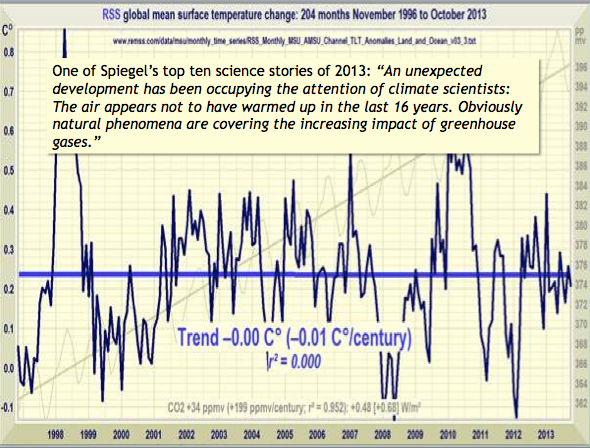
For 19 going on 20 years, global warming has stopped. Cooling has replaced warming in winters during that same period for the CONUS - we will update after this year for 20 years). Using projected February anomalies and anomalies to date it will rise to -1.25F/decade cooling for the last 20 winters.
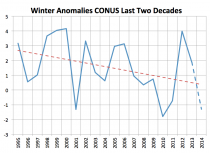
This has been true even as CO2 has risen 9.7%. In Europe and in places elsewhere including the US, the green agenda has led to harmful increases in the cost of energy or energy shortages, as winters have trended colder and snowier. This has falsified the climate models and assessments which had accelerated warming and snowless winters.
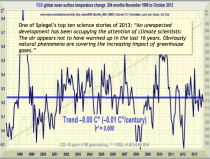
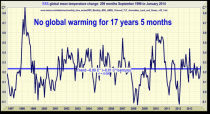
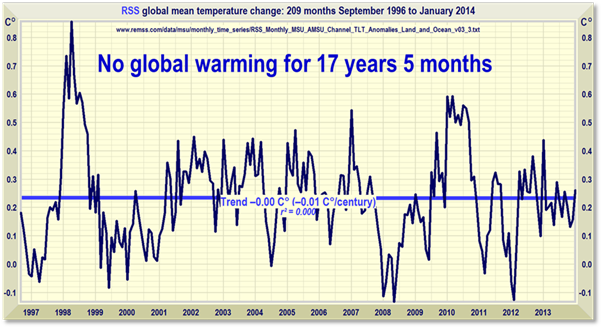
That was through October 2013. Now, Lord Monckton has updated it through January 2014, and no change is seen for 17 years and 5 months.
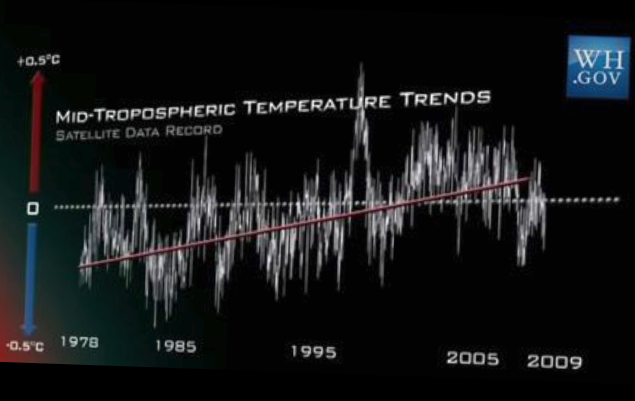
Glen Beck’s team disassembled John Holdren’s graph on WhiteHouse.gov
This is what you get when you rotate so the no change line is flat and not up.
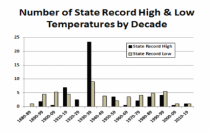
In the United States, the number of high heat extremes have been declining since the 1930s. 23 of the 50 state all time heat records occurred in the 1930s and 39 before 1960. More cold than heat extremes have been set since the 1940s. The claims to high temperature months and years is with ‘adjusted’ (manipulated) data. The actual heat and cold records are unadjusted.
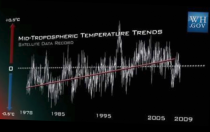
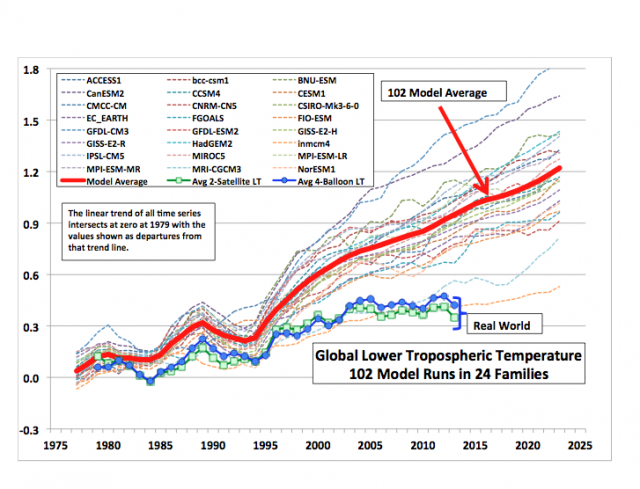
The tropical heat build-up in the atmosphere and oceans, one of the key outputs in ALL the climate models, has not been seen in the weather balloon, satellite data, or the dense ocean buoys used to track El Nino and La Ninas down to 300 meters depth, in the last 3 to 5 decades or 2000m in the ARGO buoy data since its implementation in 2004.
Sea level rise has slowed dramatically from the 20th century, and there is no upward trend in incidents of droughts and floods. Hurricane activity globally is at a 34 year low. ‘Superstorm’ Sandy was a borderline Category 1 storm. Eight Category 3 or greater storms hit the Atlantic coast from 1938 to 1960. The total tornado count this year was over 140 incidences less since records started in 1953. The number of wildfires are the lowest since modern records began in 1985.
The arctic icecover bounced back over 50% with one of the coldest arctic summers on record while new records for ice were set in Antarctica, even trapping a research ship this past month, during the Antarctic summer.
Snow was supposed to become increasingly rare. Instead as this week will reinforce, it is increasing. 4 of the top 5 snowiest years for the northern hemisphere have been in the last 6 years. In just 4 years, we have had more east coast snowstorms this decade than any in history.

The great physicist Richard Feynman said not matter how smart you are, who you are or how beautiful your theory, if data doesn’t support your theory, it is wrong. Einstein noted a model or a hypothesis cannot “prove” anything. But data can invalidate a hypothesis or model. Einstein described the “Key” to science well when he said: “The case is never closed.” “Many experiments may prove me right but it takes only one to prove me wrong.”
In the case of global warming, we have many examples proving it wrong, but with the political motivation of heavy funding, exceeding $79B the last decade, data is ignored with claims of a consensus. Dr. Michael Crichton wrote “Historically the claim of consensus has been the first refuge of scoundrels; it is a way to avoid debate by claiming that the matter is settled.”
By claiming both sides of every weather extreme (warm or cold, drought or flood, no now or too much snow), they have created an unfalsifiable hypothesis. They want you to believe every weather event proves their hypothesis. The most recent example is the controversy over the ‘polar vortex’. Though this is a common phenomenon, somewhere around the hemisphere most every winter, and has occurred in the United States often in the cold decades, as well as the last decade, they believe they can convince you that (You and your SUV are responsible).
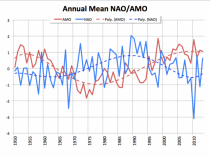
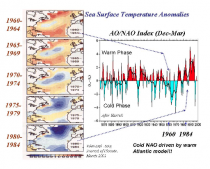
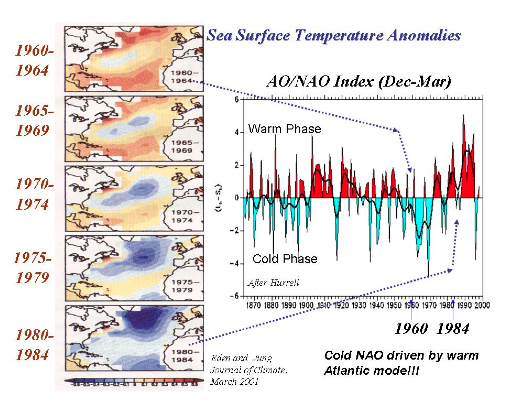
Some mets have convinced themselves that AGW is real because of the extremes (which in reality have not increased as discussed above) and the negative North Atlantic Oscillation in recent years they relate to the arctic warming and melting of arctic ice which has resulted in inconvenient colder winters in varying parts of the northern hemisphere.
They need to look further back in time. The arctic ice and warming relates to the AMO, and warming and melting happened before when the AMO was last in its warm mode from the 40s to 60s when winter turned colder and blockiness increased.
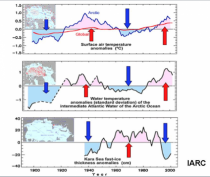
The University of Alaska at Fairbanks shows how warmer Atlantic waters make their way into the arctic increasing ice melt (from the bottom) and air temperatures.
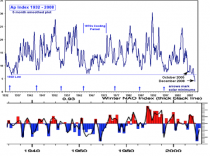
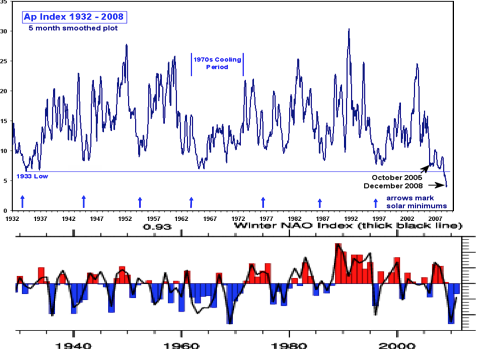
It appears also influenced by the geomagnetic solar activity.
_thumb.gif)
Our quiet sun in recent years and reduced geomagnetic Ap aligns with a declining NAO much as we have seen in similar circumstances in the past.
By Joseph D’Aleo, CCM
The two surviving teams going to the superbowls coming from the two states that have legalized marijuana. I will avoid speculating a possible role of that in bringing that outcome, I will make the point that they can thank CO2 for increasing photosynthesis, limiting the transpiration and through that limiting the water usage needs for Cannibas.
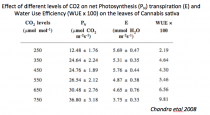
A paper published in Physiol. Mol. Biol. Plants, 14(4)–October, 2008, Photosynthetic response of Cannabis sativa L. to variations in photosynthetic photon flux densities, temperature and CO2 conditions by Suman Chandra, Hemant Lata, Ikhlas A. Khan and Mahmoud A. Elsohly tells us the story. From the abstract we see:
Effect of different photosynthetic photon flux densities (0, 500, 1000, 1500 and 2000 μmol m-2s-1), temperatures (20, 25, 30, 35 and 40 degrees C) and CO2 concentrations (250, 350, 450, 550, 650 and 750 μmol mol-1) on gas and water vapour exchange characteristics of Cannabis sativa L. were studied to determine the suitable and efficient environmental conditions for its indoor mass cultivation for pharmaceutical uses.
.gif)
An average of 30 to 33 % increase in PN and productivity of C3 plants with doubling atmospheric CO2 concentration has been already reported by Kimball 1983a, b; 1986; Idso and Idso 1994; Bazzaz and Gabutt, 1988; Cure and Acock, 1986. In Cannibas sativa, a doubling of CO2 concentration (750 μmol mol-1) suppressed E 29 % stimulated PN by 50% as compared to ambient CO2 concentration. Doubling CO2 level had a significant effect on all these parameters.
We may gain more converts into the battle against the cabonistas if we educate the public in these blue green states on this fact!!!!

Puts a new light on Arte Johnson’s character from Laugh-In. Very interesting.
Note:
The New York Times (1/23/14) reports: “The bottom line is that the policies will increase the cost of carbon and electricity,” said Roger Bezdek, an economist who produced a report for the coal lobby that was released this week. “Even the most conservative estimates peg the social benefit of carbon-based fuels as 50 times greater than its supposed social cost.” Some tycoons are no longer listening. At the Swiss resort of Davos, corporate leaders and politicians gathered for the annual four-day World Economic Forum will devote all of Friday to panels and talks on the threat of climate change. The emphasis will be less about saving polar bears and more about promoting economic self-interest.”