


By Roy W. Spencer, Ph.D.
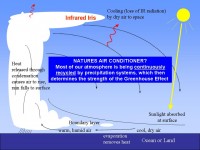
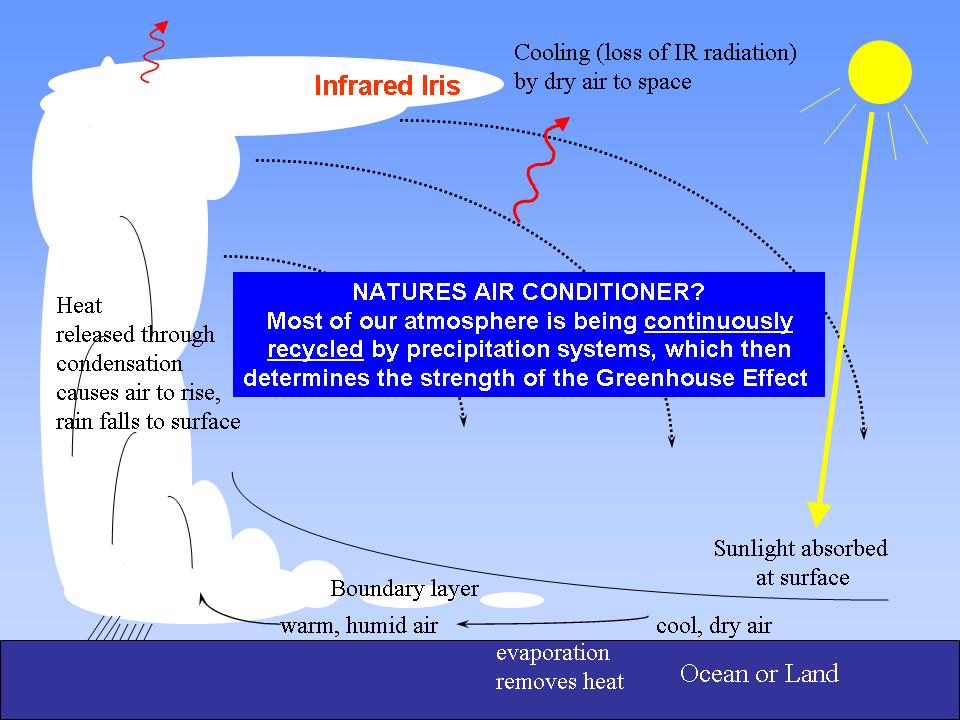
We live in an invisible atmospheric sea of water vapor, Earth’s primary greenhouse gas. Our atmosphere could hold much more water vapor than it does, which would then lead to a much warmer Earth—but it doesn’t. So, why is the greenhouse effect limited to its current value? We don’t know; scientists simply “assume” that it magically stays that way.
Current computerized climate models that predict large amounts of global warming only do so after making very crude and uncertain assumptions about how the Earth’s natural greenhouse effect is maintained. In the following article I will explain why I believe that modern science can not say with any level of confidence how much of our current global warmth is caused by mankind without knowing why the Earth’s greenhouse effect is limited to its current value.
In the following article I will explain why the answer to this question must be through the operation of precipitation systems, for only they can remove water vapor from the atmosphere. Even though all climate models DO contain the “average effects” of precipitation systems—this is NOT the same as knowing how precipitation systems interactively regulate the climate system. ”Recent Evidence for Reduced Climate Sensitivity”, my PowerPoint slideshow was presented on Tuesday, March 4, at the 2008 International Conference on Climate Change, Marriott Marquis Times Square, New York City.
See full size image here
Icecap Note: Roy’s presentation at the conference was excellent. Note how his important research showing that the water vapor feedback appears to be negative and not positive as we find in all the climate models, has been published in the GRL in 2007 and acepted for publication in the Journal of Climate for 2008. The concept is very well described in the powerpoint and in more detailed form on the Global Warming and Nature’s Thermostat site.
Nongovernmental International Panel on Climate Change edited by S. Fred Singer, Ph.D and the Heartland Institute
This is the Policymakers Summary of the Nongovernmental International Panel on Climate Change (NIPCC), an international coalition of scientists convened to provide an independent examination of the evidence available on the causes and consequences of climate change in the published, peer-reviewed literature - examined without bias and selectivity. It includes many research papers ignored by the Intergovernmental Panel on Climate Change (IPCC), plus additional scientific results that became available after the IPCC deadline of May 2006.
The IPCC is pre-programmed to produce reports to support the hypotheses of anthropogenic warming and the control of greenhouse gases, as envisioned in the Global Climate Treaty. The 1990 IPCC Summary completely ignored satellite data, since they showed no warming. The 1995 IPCC report was notorious for the significant alterations made to the text after it was approved by the scientists - in order to convey the impression of a human influence. The 2001 IPCC report claimed the twentieth century showed ‘unusual warming’ based on the now-discredited hockey-stick graph. The latest IPCC report, published in 2007, completely devaluates the climate contributions from changes in solar activity, which are likely to dominate any human influence.
The foundation for NIPCC was laid five years ago when a small group of scientists from the United States and Europe met in Milan during one of the frequent UN climate conferences. But it got going only after a workshop held in Vienna in April 2007, with many more scientists, including some from the Southern Hemisphere. The NIPCC project was conceived and directed by Dr. S. Fred Singer, professor emeritus of environmental sciences at the University of Virginia. Read the report here.
By Peter Harris, Retired Engineer Queensland
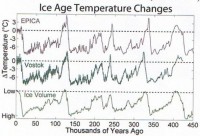
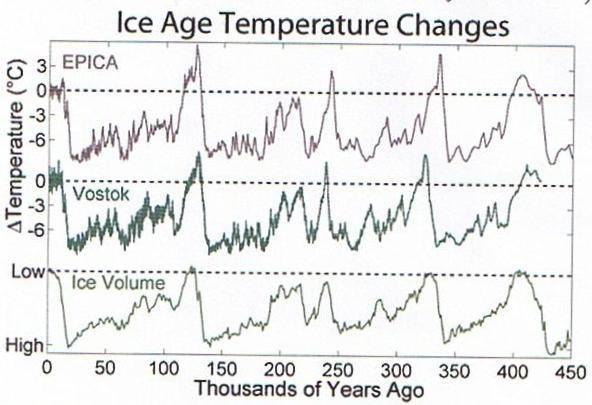
There is a strong case for an imminent change to glacial conditions based on the orbital/climate analogue and historical data. When paleoclimatologists gathered in 1972 to discuss how and when the present warm climate would end, termination of this warm climate we call the Holocene seemed imminent and it was expected that rapid cooling would lead to the coming Ice Age. These ideas were based on the 1 million year record which shows how climate has regularly and predictably responded to the variations in energy or Insolation reaching Earth from the Sun as Earth orbit slowly changes under the influence of the complex gravity changes due to planetary movements in our solar system. It was first proposed by Milutin Milankovitch (1941) that these cycles correlate with major transitions in climate between Interglacial and Ice Ages on a regular nominally 100,000 year (100KY) cycle.
See larger image here
The case for anthropogenic global warming by CO2 emission is claimed by the use of global climate models that do not fully simulate all climate responses and it depends on a hypothesis for CO2 radiative forcing which is not supported by factual measurement of the recent temperature trend. There is no evidence to support CO2 warming by radiative forcing. Based on the orbital/climate analogue there is abundant evidence for a sudden change to glacial conditions. The diversion of science to the modeling of climate forecasting has been at the expense of sensible evaluation of the simple analogue for sudden major climate transitions which has been forgotten for over 30 years. Climate forecasts from the modeling and the claims for future warming are unsafe.
We should accept the reality that the interglacial climate is an exception to the more extensive glacial phases. The orbital/climate analogue prediction of the coming ice age has been overlooked and should be revisited and validated without further delay. Further work is needed to reach an understanding of the mechanism of sudden climate transitions and to consider and plan for the contingency of sudden cooling. See this interesting but controversial story here.
Eugenio Hackbart, Brazil METSUL
Preliminary data indicate that the monthly SOI for February will be around 20.5, according to the Australian daily monitoring tool. The final number will be released on Monday (March 3rd) by the Australian Bureau of Meteorology (BoM), but it is already possible to anticipate a major and historic milestone. The monthly value for this February can be the highest ever, since data began in 1876, for any month of February.
If the average stays above plus 20, as indicated by the data released so far by the Queensland government, it would be the highest monthly value since November 2000. If we only consider this time of the year (Northern Hemisphere winter and Southern Hemisphere Summer from December to March), it would only be 7th occasion with a monthly SOI value over plus 20. The Southern Oscillation Index peaked over 20 at this time of the year previously in the years of 1889 (December), 1890 (January), 1917 (December), 1950 (December) and in 1974 (January and March).
The very high value for the SOI is associated with a strong La Nina event (picture above). It is also interesting to point that remarkably high SOI averages as seen recently and now in February also took place in the past during periods of global cooling as late in the 19th century and in the 50’s and the 70’s as the PDO experimented a negative phase. This strong La Nina event and the behavior of the Pacific Decadal Oscillation may hint the beginning of a new negative phase of the PDO, but is too early to tell and it could be another false indicator as seen in 1999 and 2000. The same could be said about global cooling. The recent trend of global temperature (read Anthony Watts’s excellent tracking) can be a brief lapse in the curve of global warming or may indicate the beginning of a long term cooling trend. I entirely agree with WOOD-TV Craig James’ opinion (read more) that this can be “just a noise in the upward trend or is it the start of a downward trend in temperatures”. The famous and very competent meteorologist from Grand Rapids tells ‘it is a little too early to be proclaiming that global warming has ended” and it sounds reasonable to me, but at the same time it is very nice to see that natural forcing and not manmade global warming is driving our planet temperature. See Eugenio’s entire post on the METSUL site here.
By Michael Asher, Daily Tech
Twelve-month long drop in world temperatures has wiped out a century of warming. Over the past year, anecdotal evidence for a cooling planet has exploded. China has its coldest winter in 100 years. Baghdad sees its first snow in all recorded history. North America has the most snowcover in 50 years, with places like Wisconsin the highest since record-keeping began. Record levels of Antarctic sea ice, record cold in Minnesota, Texas, Florida, Mexico, Australia, Iran, Greece, South Africa, Greenland, Argentina, Chile—the list goes on and on.
No more than anecdotal evidence, to be sure. But now, that evidence has been supplanted by hard scientific fact. All four major global temperature tracking outlets (Hadley, NASA’s GISS, UAH, RSS) have released updated data. All show that over the past year, global temperatures have dropped precipitously.

See large image here
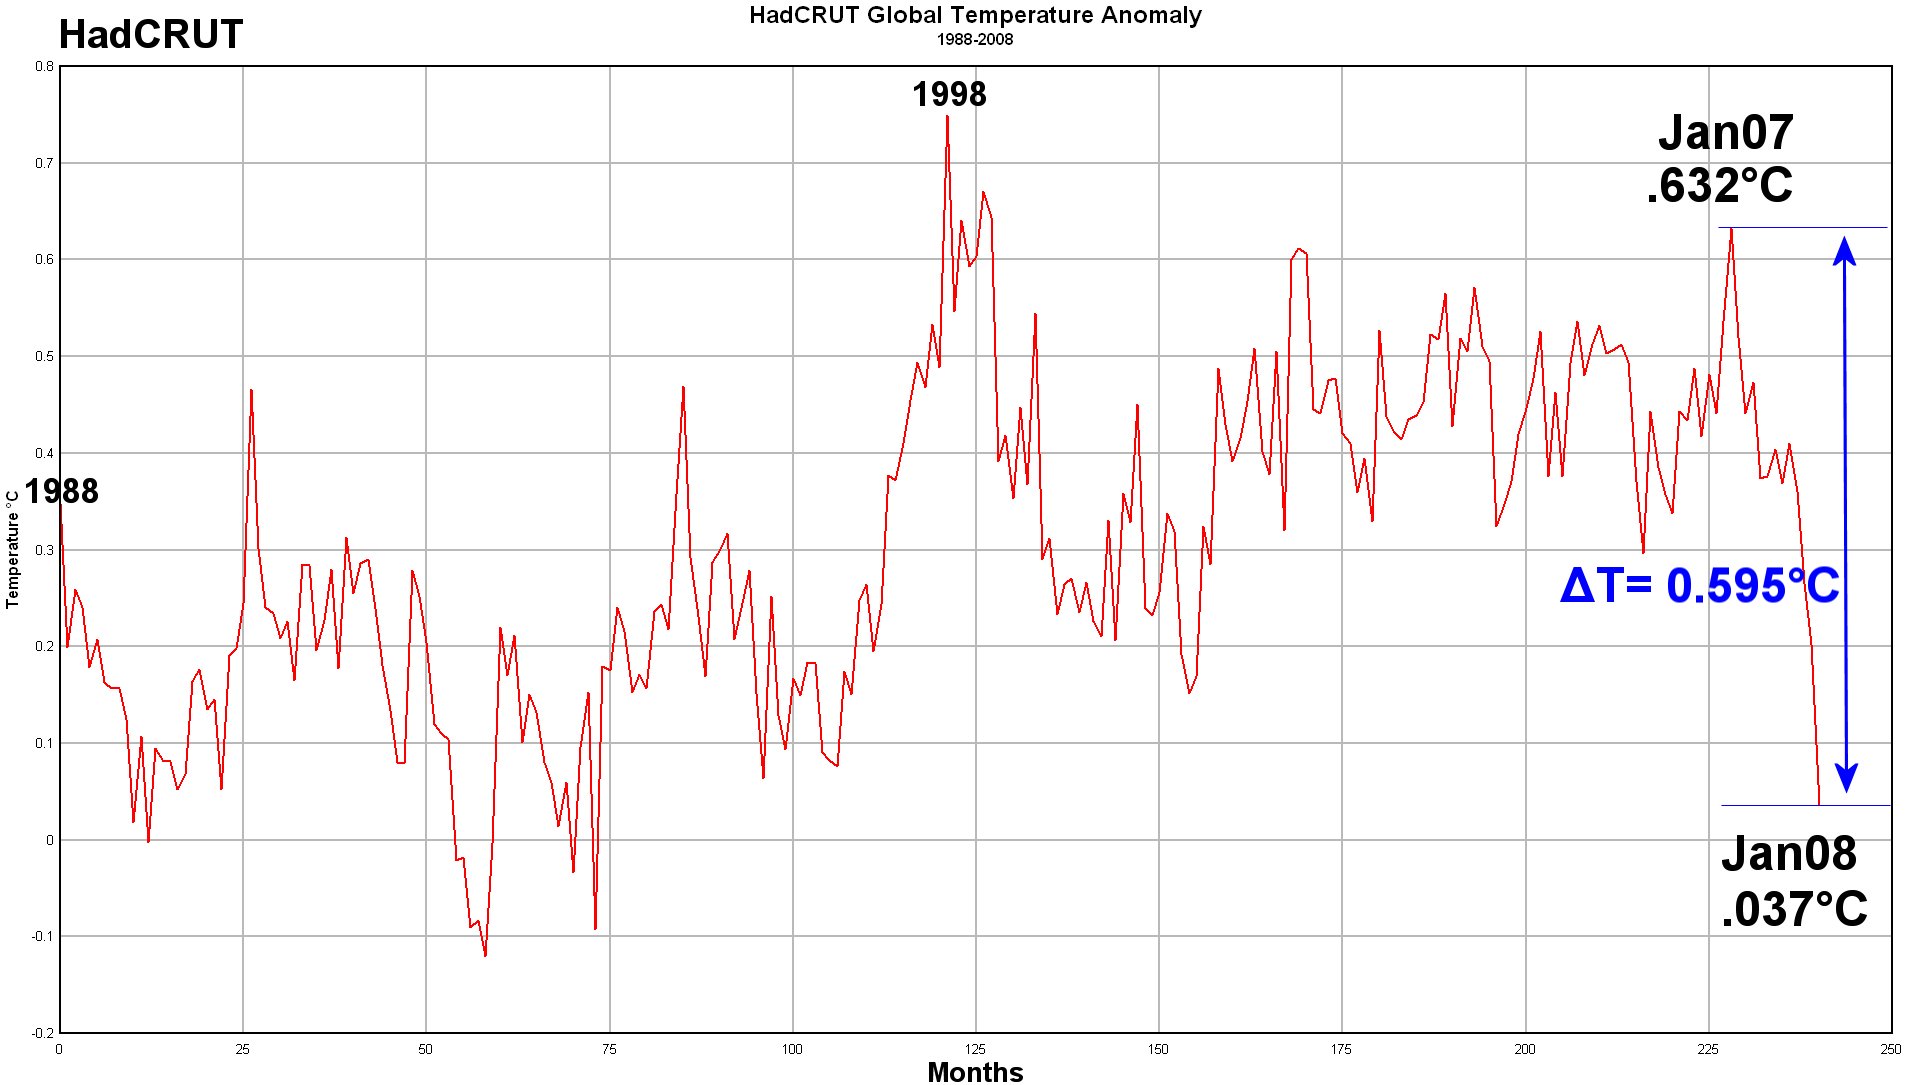
A compiled list of all the sources can be seen here. The total amount of cooling ranges from 0.65C up to 0.75C—a value large enough to wipe out nearly all the warming recorded over the past 100 years. All in one year’s time. For all four sources, it’s the single fastest temperature change ever recorded, either up or down. Read more here.
NOAA Press Release
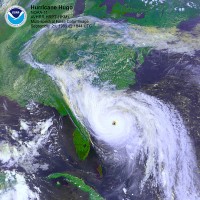
Increased Hurricane Losses Due to More People, Wealth Along Coastlines, Not Stronger Storms, New Study Says
A team of scientists have found that the economic damages from hurricanes have increased in the U.S. over time due to greater population, infrastructure, and wealth on the U.S. coastlines, and not to any spike in the number or intensity of hurricanes.
“We found that although some decades were quieter and less damaging in the U.S. and others had more land-falling hurricanes and more damage, the economic costs of land-falling hurricanes have steadily increased over time,” said Chris Landsea, one of the researchers as well as the science and operations officer at NOAA’s National Hurricane Center in Miami. “There is nothing in the U.S. hurricane damage record that indicates global warming has caused a significant increase in destruction along our coasts.”
By the CEI staff
The Competitive Enterprise Institute’s new online video spot, Where’s the Warming?, challenges global warming alarmists to justify their calls for restrictions on energy use. Carbon dioxide from man’s energy use has continued to increase in the atmosphere in recent years, but recent studies show that average global temperatures have not.
The two-minute video, which can be viewed on YouTube, pays tribute to the famous “Where’s the Beef?” ads of two decades ago. It contrasts clips from Al Gore’s movie, An Inconvenient Truth, with actual temperature data. The basic alarmist contention is that we must restrict affordable energy use because CO2 is the most important determinant of global temperatures. But this year’s unexpectedly cold winter and, more importantly, the temperature trends of the last few years tell a different story. There has been practically no global warming in the last five years or more. Even prominent climate modelers have admitted natural factors are coming into play.
CEI Senior Fellow Iain Murray commented, “Temperatures ought to be at a peak, but instead they’ve held steady for at least the last five years and by some accounts, they’ve actually dropped. The case for urgent action to restrict energy use is getting weaker, not stronger. Given that affordable energy is the best hope of escape from poverty for billions around the globe, politicians need to ask themselves “where’s the beef” before pushing their anti-energy policies.” Read more here.
By Roger Pielke Sr., Climate Science
In this part III of our discussion of issues raised in our JGR paper, Unresolved Issues with the Assessment of Multi-decadal Global Land Surface Temperature Trends , we focus on major problems with the microclimate exposure of a subset of surface Historical Climate Network (HCN) sites have been photographed. The temperature instruments that are used in the HCN are often sited close to buildings, under trees, and near other local influences on the microclimate. These microclimate influences also change over time.
The issue of the spatial and temporal representation of the temperature data that is collected is so fundamental that it is a scandal for any climate assessment that constructs a global average surface temperature to ignore this issue.
Anthony Watts has, therefore, provided us a critically important study to document these surface temperature measurement sites, since the US government agency tasked with this responsibility (the National Climate Data Center; NCDC) has refused to provide this photographic documentation, despite information that they actually have accomplished this task (the implication is that they are too embarrassed to show them to the public). The extensive photographic library already completed under the direction of Anthony Watts with his volunteers can be accessed at “Weather Stations”. This a rich source of information, and I urge readers of Climate Science to access his website. Note Anthony and his volunteers have now compeleted surveys of over 500 of the 1221 climate sites. See more here.
The message from these analyses is that the use of the surface temperature record from such observation sites to construct regional-, zonal- and global- averages introduces a bias (which is expected to be a significant warm bias) of an unknown magnitude. That this issue has not been questioned in the climate assessments nor by most of the media reports of the assessments is a scandal. The serious problem with poor sited surface temperature stations is a worldwide problem, based on our sampling so far. The World Meteorological Organization and the National Climate Date Center have been derelict in obtaining photographic documentation of these observing sites. Read more here.