


Climate Resistance
On Gristmill, Andrew Dessler provides us with an excuse for a self-indulgent recap: “I was at a meeting earlier this week and was talking to one of the coordinating lead authors of the recent IPCC working group 1 report on the physical science of climate change. He remarked that he was quite surprised that how little substantive criticism the IPCC Fourth Assessment Report had received since its release just about one year ago. “My opinion, and the opinion of all the governments of the world, is that we should listen to people who specialize in climate science. That’s the IPCC.” Following that, we did a survey of all of the contributing authors to the IPCC AR4 reports, and found that most weren’t climate scientists, as he had argued. Many, in fact, were precisely the social scientists, computer scientists, and economists he believed should be excluded from the debate.
In his latest contribution, Dessler goes on to say: “In fact, it is quite amazing to me that essentially none of the IPCC documents produced over the last 18 years has been found to contain any substantive errors. Has he forgotten the controversy caused by the use of the “Hockey Stick” graph, invented by Micheal Mann, who also happened to be lead author on the IPCC working group which made it famous? (Roughly equivalent to a researcher “peer-reviewing” his own work).
Finally he notes “The trolls, of course, will come out with their litany of “errors” that the IPCC contains (I suspect a few will appear in the comments to this post), but when you look closely, the trolls are almost always misrepresenting the IPCC’s statements.” But Dessler is doing the trolls’ work for them. It’s just that he is only sensitive to the misrepresentation of the IPCC in one direction. It is even funnier that he himself misrepresents the IPCC. One of the people doing the best job of discrediting the IPCC in the world right now is Andrew Dessler himself. May he keep up the good work. Read full story here.
By Madhav Khandekar, Calgary Herald
David Suzuki has lowered himself by his proclamation to jail policymakers who disagree with the view of global warming science. Such proclamations, even though symbolic, must be rejected by the scientific community in a civilized society like ours. The science of global warming as espoused by the Intergovernmental Panel on Climate Change and its ardent supporters like Suzuki is intensely debated in the scientific community at present and for someone like Suzuki, who is not a climate specialist, such proclamation makes a mockery of science and the entire process of scientific development and progress.
Equally disconcerting is why established scientific institutions like McGill University chose to invite a pseudo-scientist like Suzuki to talk on such a controversial topic as global warming and climate change. There are several excellent scientists in Canada who could have provided a more balanced view of the science than Suzuki’s diatribe at McGill.
As someone who has spent more than 50 years in the science of weather and climate, I am appalled at Suzuki’s neurotic outburst on a topic on which his knowledge is slightly more than perfunctory.
Dr.Madhav L. Khandekar is a retired scientist who worked at Environment Canada.
By Roger Pielke Sr., Climate Science
Climate Science has emphasized the importance of monitoring the variability and trends of ocean heat content as the most appropriate and accurate way to assess global warming and cooling (i.e., the radiative imbalance of the global climate system); e.g., see here.
There is a critically important new paper on the reasons for sea level rise, that has been accepted in the Journal of Geophysical Research, which adds important new insight into this subject, as well as updates our knowledge of the recent trends in the global ocean heat content (and thus the global radiative imbalance). This paper is Willis, J. K., D. P. Chambers and R. Steven Nerem, 2008: Assessing the Globally Averaged Sea Level Budget on Seasonal and Interannual Time Scales. Journal of Geophysical Research-Oceans. Read why this paper leads Roger to conclude: that global warming, at least as diagnosed by tropospheric and upper ocean heat content, has not been occurring since 2004. It is impossible to know if this lack of warming will continue, but these observations are inconsistent with the predictions of the long-term global climate predictions, such as reported in the 2007 IPCC report.
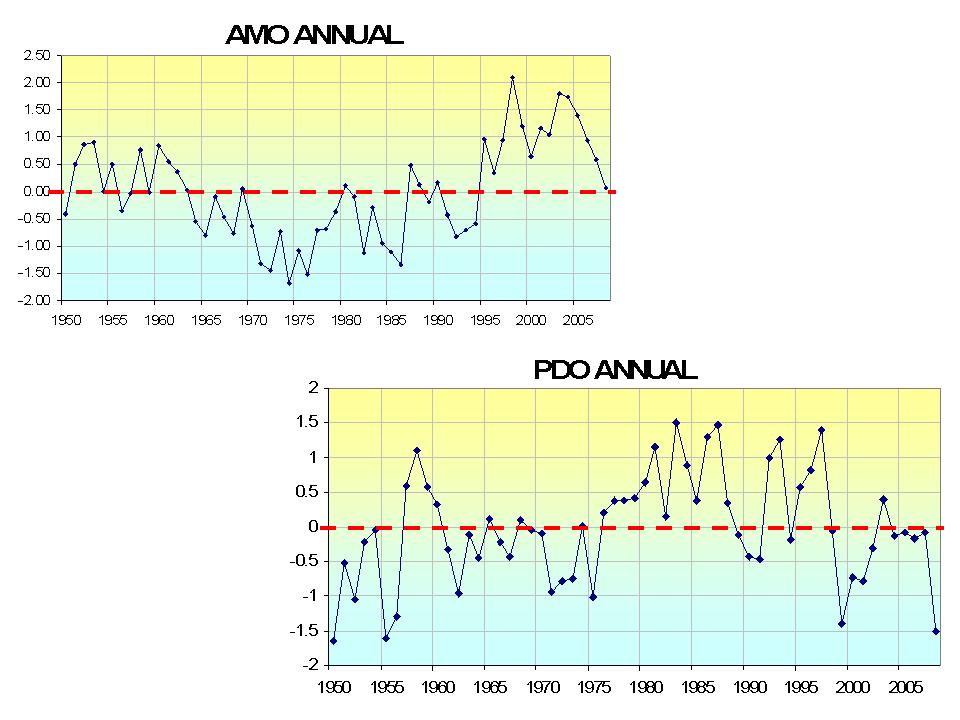
Icecap Note: By the way, both the PDO and AMO have declined precipiously in the last few years. The positive state corrresponds to ocean warmth in the Northern Hemisphere.

See full size image here.
Given our findings here that the PDO and AMO correlate best with global temperatures, this suggests a global cooling trend may be indeed underway especially if solar cycle 24 is a quiet one as increasingly appears likely (solar is another powerful climate driver).
By Anthony Watts, Watts Up with That
The sun has gone quiet. Really quiet. It is normal for our sun to have quiet periods between solar cycles, but we’ve seen months and months of next to nothing, and the start of Solar cycle 24 seems to have materialized (as first reported here) then abruptly disappeared. The reverse polarity sunspot that signaled the start of cycle 24 on January 4th, dissolved within two days after that. But the real news is just how quiet the suns magnetic field has been in the past couple of years. From the data provided by NOAA’s Space Weather Prediction Center (SWPC) you can see just how little magnetic field activity there has been. I’ve graphed it below:
See full size image here.
What is most interesting about the Geomagnetic Average Planetary Index graph above is what happened around October 2005. Notice the sharp drop in the magnetic index and the continuance at low levels. This looks much like a “step function” that I see on GISS surface temperature graphs when a station has been relocated to a cooler measurement environment. In the case of the sun, it appears this indicates that something abruptly “switched of” in the inner workings of the solar dynamo. Note that in the prior months, the magnetic index was ramping up a bit with more activity, then it simply dropped and stayed mostly flat. Given the current quietness of the sun and it’s magnetic field, combined with the late start to cycle 24 with even possibly a false start, it appears that the sun has slowed it’s internal dynamo to a similar level such as was seen during the Dalton Minimum. One of the things about the Dalton Minimum was that it started with a skipped solar cycle, which also coincided with a very long solar cycle 4 from 1784-1799. The longer our current cycle 23 lasts before we see a true ramp up of cycle 24, the greater chance it seems then that cycle 24 will be a low one. No wonder there is so much talk recently about global cooling. I certainly hope that’s wrong, because a Dalton type solar minimum would be very bad for our world economy and agriculture. Read more here.
By Roger Pielke Sr., Climate Science
In our weblog A Serious Problem With The Use Of A Global Average Surface Temperature Anomaly To Diagnose Global Warming - Part I,One of our conclusions is “In constructing a global average of global average temperature change T’, its spatial distribution matters since T’ in regions with a baseline colder temperature has a significantly smaller effect on the return of heat energy to space (through infrared emission) than regions with a warmer baseline temperature.”
As an example, assume a region of the Earth with a base temperature of 270K and another region with a base temperature of 300K. The difference in the outgoing long wave radiation (assuming blackbody behavior where the emission is proportional to T**4) results in a 34% greater emission from the warmer location. Adding a temperature increase of 1K to each location results in a 38% greater change when this increase is applied to the warmer temperature (i.e. comparing the difference between the incremental change in outgoing long wave radiation at the cold and warm locations).
Thus, by constructing a global average value of T’ in the equation introduces a significant error in diagnosing the actual global radiative imbalance. A 1C increase in surface temperature in the higher latitudes has less of an effect on the outgoing long wave radiation than a 1C increase in the tropics. This also means that using the mean daily temperature over land, rather than a diurnal cycle where the long wave emission from the surface is substantially larger at the time of maximum daily temperature, introduces yet another error.
Thus when the science assessments and policymakers claim we need to keep the global average temperature change below some threshold (e.g. 2K), they should be questioned on how this number is constructed both in the observations and in the models. Read more here.
By Bob Ferguson, SPPI
"Any half-literate child can type into an internet search engine the words “tornado history in Tennessee” and “history of hurricanes in Florida” and immediately discover that Sen. Kerry appears climatologically not smarter than a fifth grader,” says Robert Ferguson, president of D.C.-based Science and Public Policy Institute. On MSNBC, Kerry commented on recent storm events in Tennessee, blaming “global warming” for “more and more intense storms” and “changed” weather patterns. He decried that we just aren’t paying enough attention to “issues.” Perhaps Kerry should pay more attention to facts.
Several papers on SPPI’s website examine the climate histories of Florida, Tennessee, Kansas and Kentucky - all states that experience severe weather events.
Records show that the recent apparent increase in tornado observations can be explained by non-climate factors such as the expanded use of Doppler radar by the National Weather Service, an increase in the number of observers (or “storm chasers"), and an increase in the population density. Consequently, small tornadoes that were once missed are now being detected by radar and the larger observing network. The total number of violent tornados (F3, F4, F5) each year from 1950-2006 have actually declined. Records also show that winter “outbreaks,” as in Tennessee, are not that uncommon; the worst by far being the ”super outbreak” of April 3rd and 4th in 1974, with 24 reported twisters.
“Senator Kerry’s assertions are observationally unsupportable and scientifically illiterate. Is Senator Kerry engaging the insensate practice of pressing a political agenda on the backs of the suffering and grieving?” asked Ferguson.
Icecap Note: Also see this analysis by Anthony Watts on Watts Up with that.
By Roger Pielke Sr., Climate Science
As a follow up to the NASA press release on the diagnosis of landscape changes in the eastern 2/3 of the United States that was posted on Climate Science on February 4 2008, there is an excellent slide presentation by Professor Jon Foley of the University of Wisconson at the April 2007 NASA Land-Cover and Land-Use Change Program meeting. Professor Foley’s slides are titled ”Planet Against the Grain”.

It includes the very important conclusions that “agriculture and land use release more greenhouse gases than any other single human activity”, “effects on physical climate often get ‘washed out’ in outdated climate metrics of radiative forcing and global mean temperature”, “global change is much more than CO2 and global warming” and “current focus on CO2/Climate Connection is very short sighted”.
The entire set of slides is very much worth seeing. Professor Foley effectively summarizes the perspective on the human role in the climate system that should be communicated to policymakers. The current emphasis on energy reductions of CO2 emissions will not have the benefit of altering the climate that is being claimed by the AGU Position Statement on “Human Impacts on Climate” where they state “The cause of disruptive climate change is tied to energy use”. This is much too narrow a perspective of how humans are altering the climate system. Read Roger’s full post here.
By Patrick J. Michaels, CATO Institute
Indonesia is a land in turmoil, home to massive volcanoes, tsunamis, and earthquakes. On Monday, January 14, it experienced a brand new type of disturbance, the world’s first food riot caused by another nation pandering to the global warming mob. Indonesians took to the streets, demanding that their government to do something about the price of soybeans, a dietary staple.
All over the world, food prices are on the rise. For most of the late 1990s and up until 2005, the price of beans on the Chicago Board of Trade had remained stable at about $5 a bushel. Since then, they have shot up over 150 percent, to around $13. Corn has doubled, to $5. Wheat prices have tripled.
It all started with the 2005 Energy Policy Act, passed by a Republican congress and signed by a Republican president, mandating that an increasing amount of ethanol be admixed with gasoline. The bill was sold as a road to “energy independence” and as lowering the amount of carbon dioxide we emit, reducing dreaded global warming. By now, 15 percent of our corn crop is being distilled, diverted from the proper purpose for such distillates (i.e. drinking), combusted, and sent out your car’s tailpipe.
The ethanol malaise has also hit here at home, as a trip to the grocery store will reveal that the price of just about everything containing corn, wheat, or soybean products, or parts of animals fed on those crops, is skyrocketing. It’s hard to find a decent steak for under $12 a pound these days.
IT’S ONLY GOING to get worse. As if to add more 200-proof to the fire, President Bush, citing global warming in his 2007 State of the Union speech, called for production of 35 billion gallons of ethanol by 2017, displacing 20 percent of our current gasoline consumption with this intoxicating elixir. This is five times the amount mandated in the 2005 Energy Act. He claimed that this would help us get off Middle Eastern oil. What does that do about global warming? It prevents .02F worth of warming in the next century, based upon a formula published by the National Atmospheric Research Center in 1998. Read more here.
Patrick J. Michaels is senior fellow in environmental studies at the Cato Institute and a member of the United Nations’ Intergovernmental Panel on Climate Change.