


By Joseph D’Aleo, CCM, AMS Fellow
INTRODUCTION
The US congress sub-committee on Energy and Commerce Committee held hearings on whether to restrict in some way the EPA’s regulatory authority relative to greenhouse gas emissions.
There were 7 scientists invited to testify. Three of the four who argued not to restrict the EPA played a key role in the last IPCC report (and will also in the next one) and generally started with the position that IPCC science was sound and there was a consensus of all real scientists.
In the attached analysis we take a look at the IPCC based science. We are going to ignore all the many ‘gates’ that were uncovered like the Himalayan glaciers, Amazon rain forests, how many real scientists there were who authored the key summaries and all the issues as to whether the summaries truly reflected the scientific information in the chapters and despite claims to the contrary, how a significant percentage of citations were not peer reviewed.
We will not attempt to address the issues of sensitivity for CO2 or solar and cloud and water vapor feedbacks relative to the models. We will also ignore the many model shortcomings - like inability to forecast regional patterns, ocean oscillations, etc. Each of these alone discredit the consensus ‘settled science claim.
We will focus on how actual data compares to the consensus science, model based virtual world view of climate.
We will look at some of the major findings, assessments or model predictions from the IPCC and other national climate centers and NGOs, that we believe have failed and let you decide then whether or not the their science and model projections should be the bedrock onto which we build public policy.
The ten issues:
1. Warming is said to be unprecedented and accelerating. It is neither.
2. Global warming is not GLOBAL
3. Winters would grow increasingly warm
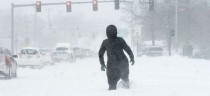
4. The entire Northern Hemisphere would experience less snow and snowcover
5. The arctic oscillation (AO) would become increasingly positive, aiding in the warming
6. Global warming would lead to a permanent or semi-permanent El Nino
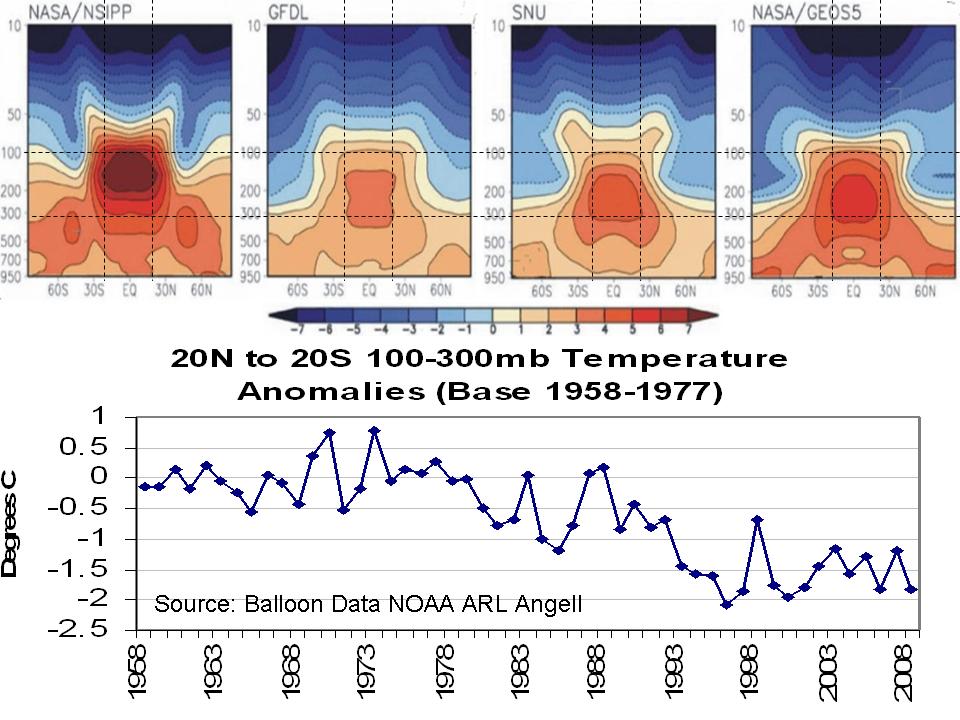
7. Atmosphere will warm faster than surface (because that is where the heat trapping gases are).

Enlarged. Balloon data for actual 100-300 mb from 20S-20N from NOAA ARL Angell (anomalies relative to base period 1968-1977) compared to models forecasts of warming 20S-20N 100-300mb. Note the cooling observed where models suggest most GHG warming. This is similar to depictions from Singer etal NIPCC 2007 and others.
8. Record highs and heat waves are increasing
9. Sea levels are rising at an increasing, alarming rate
10. Droughts and floods will worsen
We have actually made a list of 30 such ‘failures’ or ‘shortcomings’, but decided to focus on the first ten.
See the analysis part 1 and part 2.
By Joseph D’Aleo, CCM
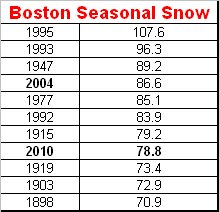
Early in April, we will update on the Weatherbell Analytics blog, the snow season and the half dozen plus cities, where it will rank in the top ten or even five snowiest ever. As we showed in yesterday’s post, for the second year in a row had 4 important ranking northeast snowstorms according to NOAA NCDC NESIS scale. The winter was the third straight winter with memorable storms. 9 of the 44 top impact storms observed since 1956 have occurred since March 2009. 1 in March 2009, 4 in 2009/10 and 4 more in 2010/11. 6 were classified as major, 2 significant and 1 notable.
Go here to see NOAA NESIS Northeast Snowfall Impact Scale. Click on the storm date and see the map of the snowfall amounts.
Also Joe Bastardi will be introducing in the next week on his blog, the Weather Bell hurricane power and impact scale, we will use this upcoming season. I am excited by his approach which will use the pressure and wind and changes in intensity. In early April Dr. William Gray will be updating his seasonal outlook. In December, he and his associate Dr. Philip Klotzbach had forecast another active season with 17 names storms, 9 hurricanes and 5 major hurricanes (CAT 3+). They believe that unlike last year, the mainland may not be as lucky with a 49% of landfall along the east coast and Florida (climatological average is 31%) and 48% chance in the Gulf versus the 30% average.
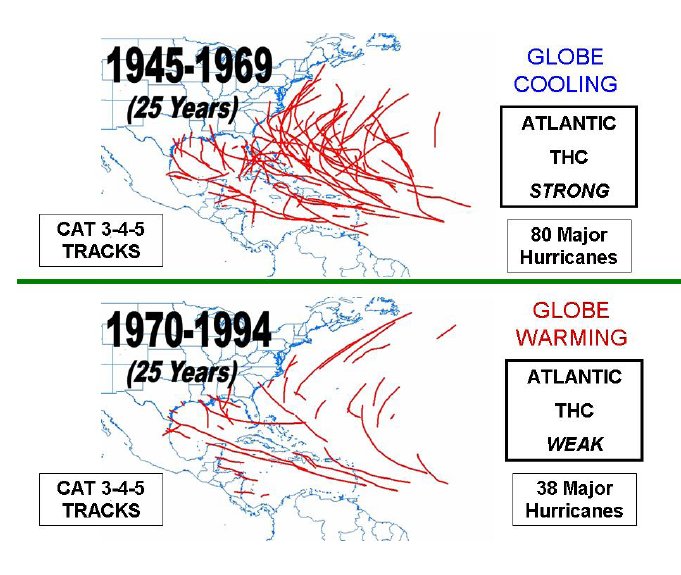
In this excellent presentation at the AMS Annual meeting, Dr. Gray talked about why the activity has increased since the AMO (Atlantic Multidecadal Oscillation) flipped positive in 1995. See his analysis here.
Bill shows how he believes activity and the AMO relate to the strength of the Thermohaline Circulation (THC). He concludes: When the THC is strong the Atlantic atmospheric and oceanic sub-tropical gyres are weaker than normal and we have much more Atlantic major hurricane activity. When the Atlantic THC is weaker than average, the gyres are stronger than normal and we encounter less major hurricane activity in the Atlantic. Below, enlarged.

The tracks of major (Category 3-4-5) hurricanes during the 16-year period of 1995-2010 when the Atlantic thermohaline circulation (THC) was strong versus the prior 16-year period of 1979-1994 when the THC was weak. Note that there were approximately 2.5 times as many major hurricanes when the THC was strong as when it was weak.

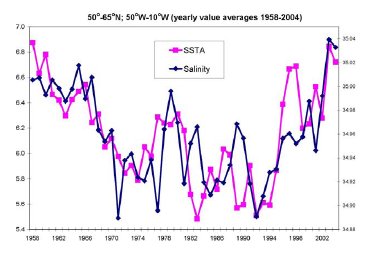
Illustration of the strong association of annually-averaged North Atlantic SSTA and North Atlantic salinity content between 1958 and 2004.
Enlarged.
See also the Weatherbell post on the September Surprise, the Hurricane of ‘38. “The year is 1938. Another hot Dust Bowl summer was drawing to a close. The heat has not been as extreme this summer as in some of the prior summers that decade, but it still had been hot, by most all accounts, too hot. The hurricane season was well underway. This one had been uneventful...so far.”
By Paul Driessen
Even as the shale gas and fracking revolution shakes up the US and global energy and climate change scene, both United States and European political elites insist on pursuing policies that make sense only in a parallel universe. In the universe inhabited by real US and EU workers and families, those policies will likely usher in a future defined by energy prices and access to electricity commonly found only in the Third World.
My latest article explores this situation, underscores the economic and employment benefits that oil and gas hydraulic fracturing could bring, and challenges Obama Administration policies that are blocking this and most other real energy development - except what requires constant infusions of taxpayer subsidies. The drag on our economic recovery is enormous.
Develop American energy or say good-bye to jobs, revenue and modern living standards !
As Britain suffered through its coldest December in a century, families were forced to choose between keeping homes warm and feeding their children nourishing meals - thanks to climate policies that have forced extensive reliance on wind power and deliberately driven energy prices skyward.
Barely two months later, the UK’s power grid CEO informed the country that its days of reliable electricity are numbered. Families, schools, offices, shops, hospitals and factories will just have to “get used to” consuming electricity “when it’s available,” not necessarily when they want it or need it. A new “smart grid” will be used to allocate decreasing electricity supplies, on a rolling basis or according to bureaucratic determinations as to which consumers most need available power - mostly from wind turbines that provided a pitiful 0.04% of Britain’s electricity during its coldest days last December.
Meanwhile, the EU’s Energy Commissioner warned that German electricity prices are already at “the upper edge” of what society can accept and businesses can tolerate. Taxes, levies and regulations imposed in the name of reducing carbon dioxide emissions and global warming are forcing companies to relocate to other countries and causing “a gradual process of de-industrialization” across Germany.
Former German Chancellor Helmut Schmidt called for a full and independent investigation of the Intergovernmental Panel on Climate Change, its practices and suspect science. The IPCC no longer has integrity or credibility, he said, and some of its researchers “have shown themselves to be fraudsters.”
To all of which, the autocratic European Commission essentially said “Drop dead.” The EU, it decreed, will spend $375 billion annually to slash CO2 emissions by at least 40% below 1990 levels by 2030, and 80% by 2050.
Welcome to the Third World, Europeans, where costly electricity is available only from time to time, at unexpected hours, depending on bureaucratic whims and how much power wind turbines and other “environment-friendly” generators can muster.
Is the USA next in line? The United States is reaping imaginary bounties from its $814-billion “stimulus” spending orgy. It hemorrhaged $223 billion in red ink during February alone - on its way to a projected 2011 deficit of $1.5 trillion, the Congressional Budget Office reports.
Over 13.7 million Americans remain unemployed; another 8.3 million are involuntarily employed only part-time; black unemployment stands at 15.3 percent; and gasoline prices have hit $4 per gallon, foretelling more rough waters ahead for the still fragile US economy.
America depends on abundant, reliable, affordable energy - 85% of it hydrocarbons. Coal generates half of all US electricity, and up to 90% in its manufacturing heartland - versus 1% from wind and solar. Newfound natural gas supplies promise a sea change in US energy supplies and electricity generation. However, oil still powers transportation, shipping and petrochemicals - and in 2010 the United States exported $337 billion to import 61% of this precious liquid fuel.
Thankfully, the Obama Administration, environmentalists and (mostly Democratic) politicians take this situation very seriously, and are doing something about it...according to their parallel universe.
Democrats are willing to trim up to $5 billion from the $3.8 trillion 2011 federal budget (0.15%), while Republicans insist that $57 billion (1.5%) should be “slashed.” As to reducing the deficit by increasing revenues, most of that discussion still centers on raising taxes on whatever “rich” people are still out there. On the energy front, things are truly disconnected from reality.
Unlocking America’s still abundant hydrocarbon resources and unleashing our innovative, hard-driving free enterprise system would generate hundreds of billions of dollars in leasing, royalty and tax revenues for federal, state and local governments. It would put millions back to work....help stanch the flow of red ink...keep tens of billions of crude oil spending and investment in America...and create enormous new wealth, instead of redistributing a dwindling pool of old wealth.
We must drill safely, use fuel more efficiently in vehicles and power plants, and get more from every underground reservoir. And we could do so, if government would allow it.
Just consider the incredible revolution that the genius of American capitalists has presented the world: hydraulic fracturing or “fracking” to tap previously inaccessible oil and gas deposits. This technology has turned “depletion” and “sustainability” claims upside down. It has already doubled US natural gas reserves and given North America over a century of recoverable gas, at current consumption rates.
It is also unlocking oil wealth in the vast Bakken shale formation of Montana, North Dakota and Saskatchewan. Oil production there has already soared from 3,000 barrels a day five years ago to over 225,000 today. The US Energy Information Administration says it could reach 350,000 barrels a day by 2035; industry sources say it could top a million barrels by 2020. Related oilfield employment has soared from 5,000 to over 18,000 in the same five-year period, and could eventually reach 100,000 jobs. At $100 a barrel, even 350,000 barrels a day could mean $1.6 billion in annual royalties, from Bakken oil alone.
The new Made in America technology is already changing energy, economic and political landscapes in Europe, and will soon do so across the globe. It is a technologically possible and economically affordable solution that generates bountiful jobs and revenues - as opposed to pixie dust solutions that require perpetual subsidies and address speculative problems. Offshore and ANWR drilling could do likewise.
Unfortunately, the White House, Environmental Protection Agency, Interior Department, and too many in Congress, courts and state legislatures are determined to restrict and obstruct this hydrocarbon revolution. They want to select business winners and losers, force America to convert to expensive, subsidized, unreliable, land-intensive wind, solar and ethanol power - and tell people how much energy they can have, and when.
EPA Administrator Lisa Jackson is using groundless claims about possible groundwater contamination to delay fracking operations. Because Congress rejected cap-tax-and-trade, she has rewritten the Clean Air Act to label plant-fertilizing carbon dioxide a “pollutant” and restrict CO2 emissions from power plants, refineries and other facilities. That will further increase energy costs for families and businesses, forcing more companies to lay more people off or close their doors - even as China and India build new coal-fired power plants every week, spurring plant growth by sending global CO2 levels higher and higher.
Interior Secretary Ken Salazar has shut down leasing and drilling in the Gulf of Mexico, put tens of thousands out of work, ignored court orders to end his moratorium, and issued decrees that make millions of additional onshore and offshore acres off limits to drilling. He has blocked exploration in ANWR because its oil riches won’t make us energy independent (as though even massive wind, solar, ethanol and electric car programs would do so).
President Obama wants oil, gas, coal and electricity prices to “skyrocket,” to make “green” energy appear more attractive. Energy Secretary Steven Chu wants to “boost the price of gasoline to levels in Europe” - over $8 per gallon! Most of all, these anti-hydrocarbon politicians want a self-sustaining political-environmentalist-industrial-public sector union complex based on government subsidies to favored industries and companies, in exchange for campaign contributions that will keep them in power.
This palpable, intolerable insanity must end. It’s time to tell Congress (and the European Commission) we need real energy for real jobs, real revenues and a revitalized economy. And we need it now.
Paul Driessen is senior policy advisor for the Committee For A Constructive Tomorrow and Congress of Racial Equality, and author of Eco-Imperialism: Green power - Black death.
By Joe Bastardi
On March 11th, Weatherbell Analytics announced that Joe D’Aleo and I would be working together to develop the premier long range weather forecasting center in the world. When I looked at what was coming together, I decided this is where my next step in doing what I was made to do had to be.
First of all, in Joe D’Aleo, I have a colleague that needs no introduction to the major meteorology people of the world. Joe and I have similar methods of arriving at forecasts, and understand big picture to small focus forecasting ideas.. where one must be able to step back and understand the major players on the field to be able to correctly identify and forecast the events that carry so much wait in any given forecast. So many times, I saw we had an independent consensus.
In other words we arrived at the same conclusion, without consulting with each other, that it became apparent that we were on the same wavelength. However the differences we have will be used to challenge each other to come up with the right final conclusion. The fact that we have similar ideas on the overall trend in the global temperature, and for the same basic physical reasons, which trump the idea that a trace gas needed for life on the planet can cause so much variation, gives us an up on those that simply want to bet its going to be warm. Knowing where we were, but where we are going is crucial to having the correct backdrop in a forecast.
The owner and founder of the company, Michael Barak is a Cornell engineering graduate who loves the weather and will give us the chance to use our skills in many more ways than we have done so far. A good long range forecast can supply many needs. The vision and boldness of Michael gives us a major up. He is determined to make sure Joe and I can fight in all the arenas available, so the success of the company will rely on the success of the forecasts, being used the right way.
WeatherBell has given me a system where I can blog to my hearts content with all the graphics I want, and our video setup is one where my new video vigilantes, the atmospheric avenger and the WeatherBell Raging WeatherBull will appear several times a day.. and at night. Quite frankly, for me, this set up is manna from heaven.
In short, its a long road to be part of a start up and try to reach the top. But Joe and I live for the weather, we both understand it is what we were made to do, and we are here to do it. I have already said we are the LaMotta and Marciano of weather, men whose names end in a vowel, and wont throw in the towel. And we are here with WeatherBell with one mission.. to climb to the top.
Interesting company name and appropriate for both Joe and I, because we will answer the WeatherBell in every round.
Icecap Note: See the start of a new tiered weather service with Joe Bastardi and I here. Here is my blog and here is Joe B’s. Joe has video capabilities now. I will shortly. The service for now is free. It will be reasonable for the hobbyiest and highly competitive with existing services in other markets. We will partner with the very best companies and people in the months ahead. We will stay close to our mission of providing the best weather and climate forecast services. I will continue to comment on climate change issues here. More to follow. For those who know the name...Dr Dewpoint rides again.
See the Weatherbell main site. See stories on Late Season snowstorms can sneak up on you,, NAM (AO) Trumphed ENSO, Dr. Dewpoint Rides Again, and Big time Tornado and Flood Season.
By Joseph D’Aleo, CCM, AMS Fellow
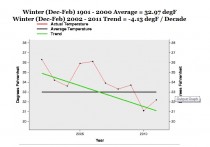
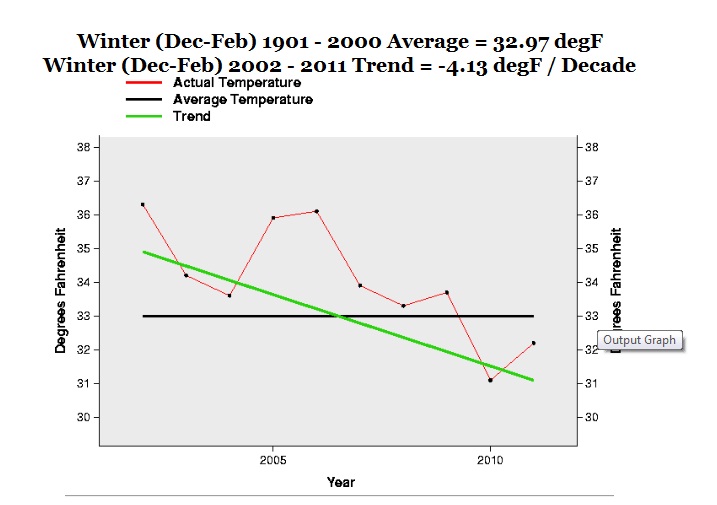
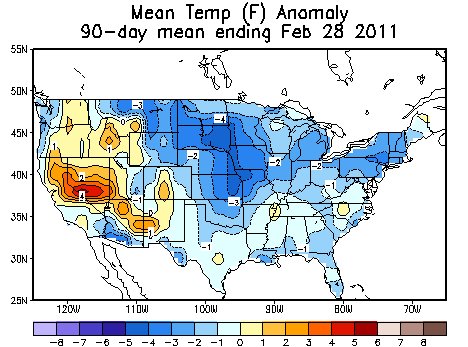
The winter for the United States ended as the 39th coldest.
Again as last year, the coldest was in the central and southeast despite last year was a strong El Nino, this a strong La Nina.
The decadal trend continues down at a rate of 4.1degF/Decade (41F per century!)
Winter (Dec-Feb) 2002 - 2011 Data Values:Winter (Dec-Feb) 1901 - 2000 Average = 32.97 degF
Winter (Dec-Feb) 2002 - 2011 Trend = -4.13 degF / Decade
---------
A Large Increase In Thick Ice Over 2010
By Steve Goddard
2.5+ metres thick
Animated enlarged.
3+ metres thick
Animated enlarged.
Icecap Note: alarmists like to make the claim that though the extent of the antarctic ice is increasing, the thickness may be decreasing. Here they are ignoring the increased thickness and focusing on the diminished extent. Despite the thickening, I believe it is possible we will make a run at the 2007 minimum this late summer or in 2012 given the warmth of the Atlantic last year. There is a few year delay for the warm water to reach under the ice to the Siberian coast from the North Atlantic. Recall the last Atlantic warm peak was in 2004-05 and the ice minimum in 2007. The Atlantic cooled some and the ice recovered after 2005. The record blocking led to another pop in North Atlantic temperatures last year which will likely thin the ice the next two years. This is similar to what happened the last Atlantic warm mode 70 years ago, and 70 years before that when cod fish were said to have been caught off the Russian arctic coast.
By Joseph D’Aleo
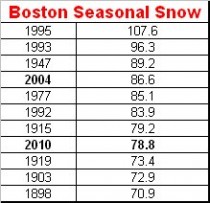
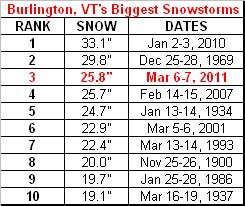
The latest city to make a run at an all-time record is Burlington, Vermont. A monstrous storm dumped 25.8 inches of snow, the third largest snowstorm ever. It just beat out the Valentine Day’s blizzard of 2007 which dumped 25.7 inches which now drops to fourth place. It fell short of the 33.1 inches that fell on January 2-3rd in 2010, the biggest snowstrom in history and the 29.8 inches that fell in the Christmas week (25-28th) in 1969.

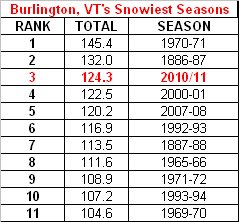
It pushed the 2010/11 season into third place with 124.3 inches behind the 145.4 inches in the 1970-71 La Nina and 132.0 inches in 1886-87.

Up to 32 inches fell in the region (Bloomingdale, NY). See listing.
Climate Depot
Moore: ‘I quit my life-long subscription to National Geographic when they published a similar ‘sixth mass extinction’ article in February 1999’
Greenpeace Co-Founder and ecologist Dr. Patrick Moore, slammed a new study claiming a dramatic and irreversible mass species extinction. “This [journal Nature] article should never have made it through the peer-review process,” Moore told Climate Depot in an exclusive interview. “The fact that the study did make it through peer-review indicates that the peer review process has become corrupted,” Moore, the author of the new book “Confessions of a Greenpeace Dropout,” added.
“The authors [of the journal Nature study] greatly underestimate the rate new species can evolve, especially when existing species are under stress. The Polar Bear evolved during the glaciation previous to the last one, just 150,000 years ago,” Moore explained.
The new alarming species mass extinction study was described in an article in Yahoo News and AFP on March 4, 2011 titled: ‘World’s sixth mass extinction may be underway: study.’ The AFP article reported: Mankind may have unleashed the sixth known mass extinction in Earth’s history, according to a paper released by the science journal Nature. Over the past 540 million years, five mega-wipeouts of species have occurred through naturally-induced events. But the new threat is man-made, inflicted by habitation loss, over-hunting, over-fishing, the spread of germs and viruses and introduced species, and by climate change caused by fossil-fuel greenhouse gases, says the study. [End article excerpt.]
But Moore, in an interview with Climate Depot, refuted the claims of the species study. “The biggest extinction events in the human era occurred 60,000 years ago when humans arrived in Australia, 10-15,000 years ago when humans arrived in the New World, 800 years ago when humans found New Zealand, and 250 years ago when Europeans brought exotic species to the Pacific Islands such as Hawaii,” Moore explained.
“Since species extinction became a broad social concern, coinciding with the extinction of the passenger pigeon, we have done a pretty good job of preventing species extinctions,” Moore explained.
“I quit my life-long subscription to National Geographic when they published a similar ‘sixth mass extinction’ article in February 1999. This [latest journal] Nature article just re-hashes this theme,” he added. Moore left Greenpeace in 1986 because he felt the organziation had become too radical. Moore also challenges man-made global warming fears. See: Greenpeace Co-Founder Dr. Patrick Moore Questions Man-Made Global Warming, Calls it ‘Obviously a Natural Phenomenon’
This is not the first time Moore has gone to battle of alarming claims of species extinction. In the 2000 documentary ”Amazon Rainforest: Clear-Cutting The Myths”, Moore bluntly mocked species extinction claims made by biologist Edward O. Wilson from Harvard University. Wilson estimated that up to 50,000 species go extinct every year based on computer models of the number of potential but as yet undiscovered species in the world.
Moore said in 2000: “There’s no scientific basis for saying that 50,000 species are going extinct. The only place you can find them is in Edward O. Wilson’s computer at Harvard University. They’re actually electrons on a hard drive. I want a list of Latin names of actual species.” Moore was interviewed by reporter Marc Morano (now with Climate Depot) in the 2000 Amazon rainforest documentary:
Environmental activist Tim Keating of Rainforest Relief was asked in the 2000 documentary if he could name any of the alleged 50,000 species that have gone extinct and he was unable.
“No, we can’t [name them], because we don’t know what those species are. But most of the species that we’re talking about in those estimates are things like insects and even microorganisms, like bacteria,” Keating explained.
UK scientist Professor Philip Stott, emeritus professor of Biogeography at the University of London, dismissed current species claims in the 2000 Amazon rainforest documentary.
“The earth has gone through many periods of major extinctions, some much bigger in size than even being contemplated today,” Stott, the author of a book on tropical rainforests, said in the 2000 documentary.
“Change is necessary to keep up with change in nature itself. In other words, change is the essence. And the idea that we can keep all species that now exist would be anti-evolutionary, anti-nature and anti the very nature of the earth in which we live,” Stott said.
Bye Bye Global Warming Movement—Welcome to the Next Eco-Scare—Species?!
Many critics of the environmental movement believe that as man-made global warming fears continue to fade scientifically and politically, species extinction will be touted as the next environmental scare. See:
Bye Bye Climate Fears? Media Says Hello to Next Eco-Scare! BBC touts report claiming ‘1/5 of world’s plants at risk of extinction’ ahead of UN Biodiversity Conference
Update:
See Steve Goddard’s comprehensive review region by region confirming the heavy snow occurred where temperatures were below normal not warm.
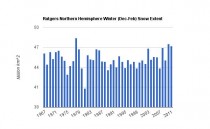
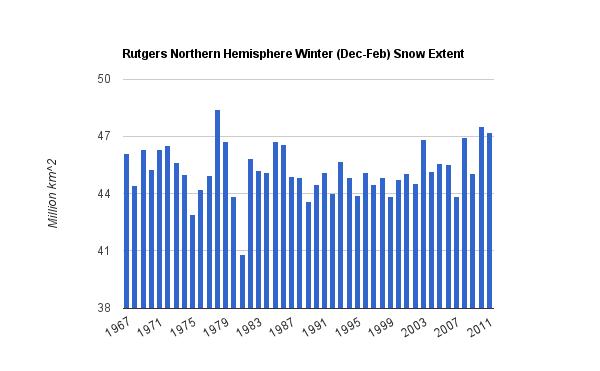
Rutgers snow analysis for this winter (Dec-Feb) for the northern hemisphere reported by Steve Goddard to be the third greatest. Three of the four snowiest Northern Hemisphere winters since 1967 have been in the last four years. Four of the five snowiest winters have been since CRU experts told us that children won’t know what snow is.
By Joseph D’Aleo, CCM, AMS Fellow
As we reported, the eco-pressure group, the Union of Concerned Scientists, as part of a continuing misinformation campaign sponsored a teleconference yesterday with a very confused Jeff Masters of Weather Underground, opportunist Mark Serreze of NSIDC and a UCS environmentalist. Their performance was a scientific disappointment to say the least as one scientist wrote me “Masters lost all my respect. Serreze never had it”. He didn’t mention the UCS. It is the crazy uncle no one talks about.
The Union of Concerned Scientists recall had sponsored a workshop on Mt. Washington in 2007 in which they promised ski areas that snow would be hard to come by even in northern areas and they might consider another profession. That very winter, northern New England set a record for the greatest seasonal snow and ski areas had the best year in their history. Across the hemisphere that winter was surpassed only by 1977/78, 2009/10. Through January this winter, the Northern Hemisphere had more snow than any of those years and will rank likely in the top 5.
The UCS was not alone in predicting warming means less snow. NOAA in their CCSP and the EPA in their TSD said most cities with winter averages near freezing (the case of most metros in the east) would see more rain and much less snow. Recall the IPCC stated: “Milder winter temperatures will decrease heavy snowstorms”. Recall RFK Jr. in 2008 promised DC children would be deprived of the fun of sledding due to warming - of course all-time record snows fell in 2009/10 and sleds and skiis were the only way to get around the DC area.
Now the alarmists have flipped their position claiming warming means more snow although it is a major stretch to think that would apply to Los Angeles, Houston, Dallas, New Orleans, and Atlanta in a warming world. But back to the teleconference.
“Heavy snowstorms are not inconsistent with a warming planet,” said scientist Jeff Masters. “In fact, as the Earth gets warmer and more moisture gets absorbed into the atmosphere, we are steadily loading the dice in favor of more extreme storms in all seasons, capable of causing greater impacts on society.” “The old adage, ‘It’s too cold to snow,’ has some truth to it,” said Masters. “A colder atmosphere holds less moisture, limiting the snowfall that can occur.”
First of all the winter was colder than normal not warmer as can be seen by this preliminary analysis from NOAA CPC.

Second the global oceans are colder than normal, especially around the United States as seen from this UNISYS SST anomaly analysis.
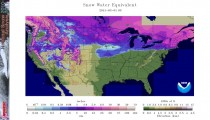
Third the amount of moisture in the air this winter was below normal (blues) in all the areas that had abnormal snow.
The actual tropspheric precipitable water content from surface to 500mb shows most the tropical atmosphere has over ten times the water content of the polar and middle latitudes.
Marc Morano collated other scientist responses on Climate Depot. He adds (1) tropospheric relative and specific humidity has significantly declined since ‘safe CO2 levels’ of 1948, 2) atmospheric water vapor has declined since satellite measurements began in 1983, 3) there has been no statistically significant global warming since 1995. See in this peer review paper how CO2 enriched plants hold water better!
The snow resulted from a rapid cooling as we went from a strong El Nino to a strong La Nina and high latitude blocking consistent with a warm AMO mode and a still quiet sun (maybe some residual help from the high latitude volcanoes of recent years). Global temperature anomalies may have plunged more than a whole degree (F) from their peak last summer and early fall. February 2011’s anomaly (UAH) came in as -0.018F relative to the 30 year average. Recall global temperatures lag ENSO by about 7 months. Global teleconnections are most similar to the late 1950s, 1960s and 1970s when frequent snowy cold winters caused the world to increasingly think an ice age was coming.
Mark Serreze, director of the National Snow and Ice Data Center in Boulder, Colorado, said less sea ice in the Arctic translates to more moisture in the atmosphere, and could also cause an atmospheric circulation pattern in polar regions known as Arctic Oscillation.
“It’s still cutting-edge research and there’s no smoking gun, but there’s evidence that with less sea ice, you put a lot of heat from the ocean into the atmosphere, and the circulation of the atmosphere responds to that,” Serreze said.
He would not know cutting edge research if he fell over it. Forecasters were using the Atlantic Multidecadal Oscillation in forecasting temperatures for over a decade. It correlates very strongly with the Northern Hemispheric temperatures and with wintertime North Atlantic Oscillation and the Arctic Oscillation. Even the IPCC talks about the natural cyclical behavior of the AMO (60-70 year cycle). The warm AMO mode which began in 1995 biases the atmosphere towards a negative AO and NAO. It also contributes to less arctic ice as the warmer than normal waters near the Barents Sea work their way under the ice and thin it from the bottom. See.
Before Serreze took over NSIDC seeing the huge grant funding windfall opportunity, an honest scientist in their blog in 2007 admitted the roles of the oceans in arctic ice and the uncertainty that existed in the science:
“One prominent researcher, Igor Polyakov at the University of Fairbanks, Alaska, points out that pulses of unusually warm water have been entering the Arctic Ocean from the Atlantic, which several years later are seen in the ocean north of Siberia. These pulses of water are helping to heat the upper Arctic Ocean, contributing to summer ice melt and helping to reduce winter ice growth. Another scientist, Koji Shimada of the Japan Agency for Marine - Earth Science and Technology, reports evidence of changes in ocean circulation in the Pacific side of the Arctic Ocean. Through a complex interaction with declining sea ice, warm water entering the Arctic Ocean through Bering Strait in summer is being shunted from the Alaskan coast into the Arctic Ocean, where it fosters further ice loss.” Many questions still remain to be answered, but these changes in ocean circulation may be important keys for understanding the observed loss of Arctic sea ice.”
CO2 has nothing at all to do with it. Cold open arctic waters serve as a major sink of CO2 just as the warm tropical waters serve as a source. Roger Pielke Sr. suggests the ocean heat content (OHC) as a more robust measure of temperature trends. Models suggest OHC should be rising rapidly as the greenhouse gases build, especially in the tropics. Here is the buoy based OHC in the top 300 meters of the equatorial from NOAA (between 5 degrees north and south of the equator) Pacific from 130 E to 80W. During El Ninos, the eastern half is warm and the west cool, in La Ninas the eastern half is cool and the western warm. The fact there is not net warming, instead actually a slight cooling of the entire belt may the most damning proof that global warming is nothing more than a government funded political campaign.
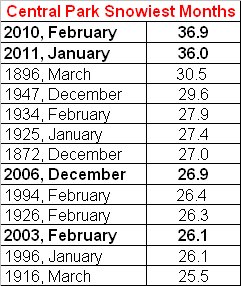
Meanwhile, check out the interesting snow stories as we enter the last quarter mile of the winter season. Ask the people in these areas whether they think global warming is something to worry about.
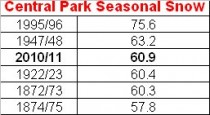
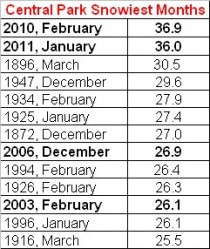
And Central Park’s snowiest months:
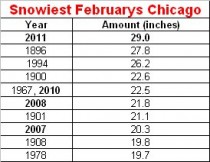
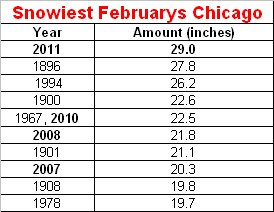
Chicago had a helleva February.
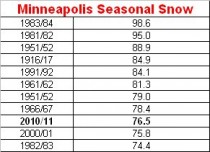
Minneapolis is climbing the top ten list of snowiest winters (second snowiest for the December to February period behind only 1966-67).
As is Boston.
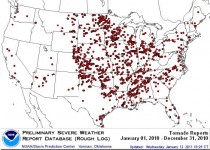
By Joseph D’Aleo, CCM, AMS Fellow
Tornado season kicks off in February most years, and yesterday’s storm had tornadoes, and other severe weather and with heavy rains after a snowy winter, major flooding. The tornado seasons tend to be more severe in La Ninas with larger outbreaks and stronger tornadoes.
Tornadoes tend to focus in the central and southern plains and the Gulf Coast during El Nino years, with a shift to the Midwest, the Ohio and Tennessee Valleys, and the mid-Atlantic region during La Nina years.
Bove (1999) showed El Ninos tend to produce more tornadoes in the southern plains, while La Nina seasons are more active in the Ohio Valley and the south.
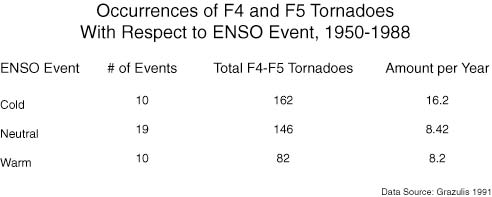
The strengths of these cycles also seem to be a factor in this data as well. Tornadoes during a La Nina are stronger and remain on the ground longer than those observed during an El Nino. That means an increased danger of large destructive and deadly tornadoes during the cold phase. There is also an increased risk of “tornado swarms” or outbreaks of 40 or more twisters from a single weather system in a La Nina season.
We believe a recent climate shift favoring a cooler Pacific and more frequent La Nina events suggests we have entered a period of increasing severe storms that could last a decade or more.
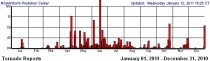
We saw a burst of activity in the La Nina year of 2008 with 1692 tornadoes.
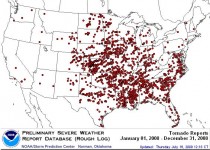
Enlarged.
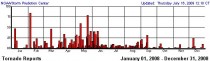
Enlarged.
In 2010, an El Nino year, by comparison, 1277 tornadoes occurred.
Enlarged.
Enlarged.
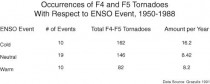
SUPEROUTBREAKS
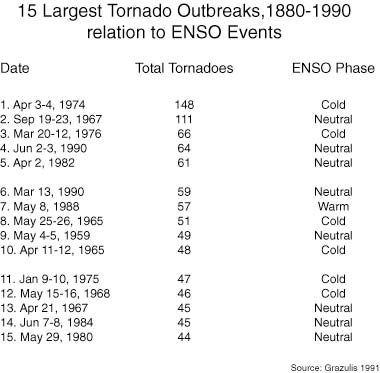
Bove found also most large outbreaks and major tornadoes occur in cold (La Nina) or neutral (La Nada) years. He refers to the analyses by Grazulis in 1991.

Enlarged.
Enlarged.
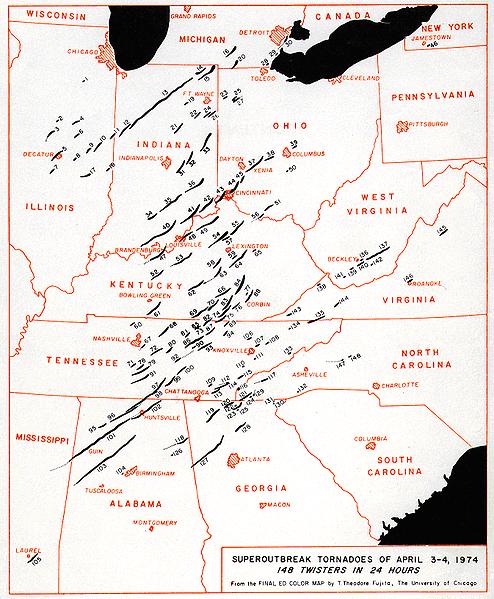
The Super Outbreak of April 3-4, 1974 spawned 148 confirmed tornadoes across eastern North America and resulted in the second highest death toll (319) in the United States. Not only did it produce an exceptional number of tornadoes, but it was also an inordinately intense outbreak producing dozens of large, long-track tornadoes, including 7 F5 and 23 F4 tornadoes. More significant tornadoes occurred within 24 hours than any other week in the tornado record.
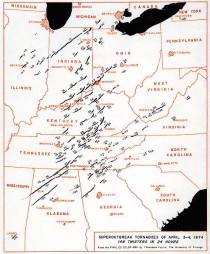
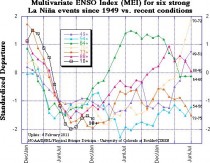
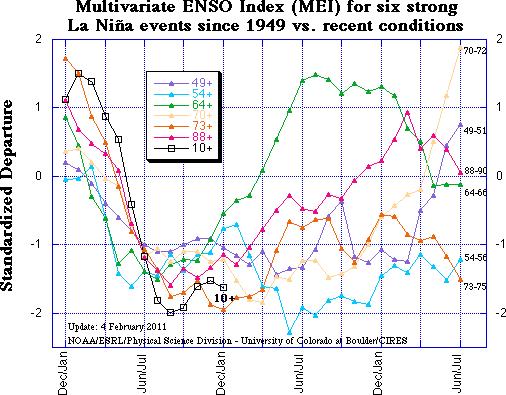
Note 1974 a major La Nina like this year saw major flooding in Australia’s Queensland and in Brazil just like this year. Note how this La Nina using Wolter’s Multivariate ENSO Index (MEI) is among the strongest ever.
Flooding
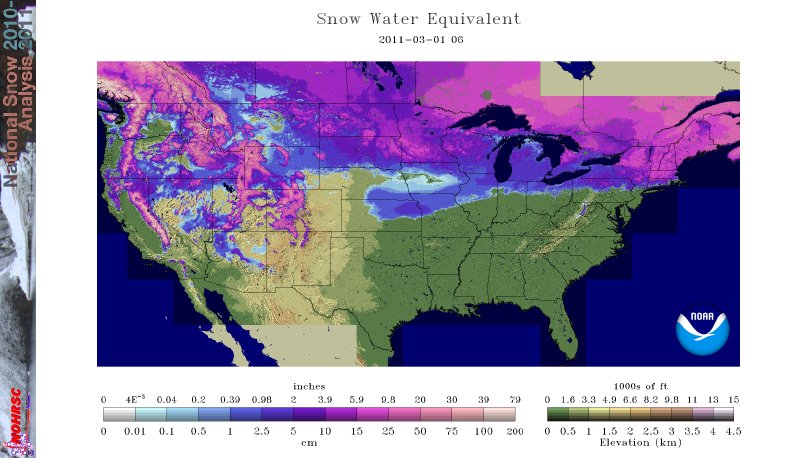
The heavy to near record snowfall season across the north has left a deep snowcover that with more spring snows and then rain is likely to lead to flooding as we saw in recent La Nina springs of 2008 and 2009. See where there is as much as 6 -10 inches of water in the snowpack as of March 1, 2011.
PDF here.
This is this mornings river flooding situation - orange, red and purple are gauges in flood.
People’s Revolt against the Gillard carbon dioxide tax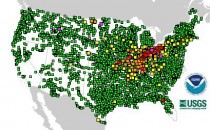
From Dr. Bob Carter

Dear Recipient,
You will almost certainly have heard the news that last Wednesday, February 23, Prime Minister Gillard announced on behalf of her Multi-Party Committee on Climate Change an in-principle commitment to introduce a carbon dioxide tax in Australia on July 1, 2012, to be replaced by an emissions trading scheme several years later.
The result of all such schemes is an immediate and significant increase in the cost of living (the precise cost depending upon the level at which the tax is levied per tonne of carbon dioxide emitted). The tax will achieve absolutely no measurable effect on future climate. It is not an environmental good measure, but a revenue raising measure that will hurt poor people most (i.e., the tax is regressive). In fact, in such terms, it is simply a con.
There have been immediate and spontaneous protests against the tax from persons and groups across Australia. You may recall, also, that a previous plan to introduce a similar Emissions Trading Scheme was defeated three times in Canberra, the final time in the Senate in part because of a massive people’s protest that was registered from across the country to politicians in Canberra.
As summarised in the attached briefing document, plans are afoot to continue with present protests against this new tax, and, if necessary, to launch yet another (fourth) wave of protests to Canberra, should that prove necessary.
I invite you to consider participating in this protest by signing up to become a member of an informal action group in your town, area or region. The appropriate email address to write to is contained in the “What Can I Do?” section of the attached briefing document by Professor Bob Carter, who is a long-time opponent of Canberra’s unrealistic “stop climate change” policy plans.
Finally, (i) please feel free to forward this message, and the briefing document, to any other persons that you think might be interested in it; and (ii) I apologize if this turns out to be a multiple copy of the letter (in which case, of course, please discard it), but hope that you will agree, given the importance of the matter, that it is better for you to get multiple copies than to receive none.
Signature
-------
See the attached briefing document 2011-AusAGW-4z.doc and see this story in Quadrant. See also this excellent summary sent to all MPs.
Wind power: questionable benefits, concealed impactsEPA trumpets dubious shale gas risks – but ignores environmental impacts of wind turbines
Paul Driessen
America is running out of natural gas. Prices will soar, making imported liquefied natural gas (LNG) and T Boone Pickens’ wind farm plan practical, affordable and inevitable. That was then.
Barely two years later, America (and the world) are tapping vast, previously undreamed-of energy riches - as drillers discover how to produce gas from shale, coal and tight sandstone formations, at reasonable cost. They do it by pumping a water, sand and proprietary chemical mixture into rocks under very high pressure, fracturing or “fracking” the formations, and keeping the cracks open, to yield trapped methane.
Within a year, US recoverable shale gas reserves alone rose from 340 trillion cubic feet to 823 tcf, the Energy Department estimates. That’s 36 years’ worth, based on what the USA currently consumes from all gas sources, or the equivalent of 74 years’ of current annual US oil production. The reserves span the continent, from Barnett shale in Texas to Marcellus shale in Eastern and Mid-Atlantic states - to large deposits in western Canada, Colorado, North Dakota, Montana and other states (and around the world).
Instead of importing gas, the United States could become an exporter. The gas can move seamlessly into existing pipeline systems, to fuel homes, factories and electrical generators, serve as a petrochemical feedstock, and replace oil in many applications. States, private citizens and the federal government could reap billions in lease bonuses, rents, royalties and taxes. Millions of high-paying jobs could be “created or saved.” Plentiful gas can also provide essential backup power for wind turbines.
Production of this much gas would reduce oil price shocks and dependence on oil imports from the likes of Gadhafi and Chavez, while lowering greenhouse gas emissions. Talk about a game changer!
What’s not to like? Plenty, it turns out. The bountiful new supplies make environmentalist dogmas passe: the end of the hydrocarbon era, America as an energy pauper, immutable Club of Rome doctrines of sustainability and imminent resource depletion, the Pickens’ Plan and forests of wind turbines.
What to do? Environmentalists voiced alarm. HBO aired “Gasland,” a slick propaganda film about alleged impacts of fracking on groundwater. Its claims have been roundly debunked (for instance, methane igniting at a water faucet came from a gas deposit encountered by the homeowner’s water well - not from a fracking operation). A politically motivated Oscar was predicted, but didn’t happen.
The Environmental Protection Agency revealed a multiple personality disorder. Its Drinking Water Protection Division director told Congress there is not a single documented instance of polluted groundwater due to fracking. (Studies by Colorado and Texas regulators drew the same conclusion.)
EPA’s Texas office nevertheless insisted that Range Resources was “endangering” a public aquifer and ordered the company to stop drilling immediately and provide clean water to area homes. EPA officials then failed to show up at the hearing or submit a single page of testimony, to support their claims.
Meanwhile, EPA Administrator Lisa Jackson announced plans to conduct a “life-cycle” or “cradle-to-grave” study of hydraulic fracturing drilling and gas production techniques, to assess possible impacts on groundwater and other ecological values. Depending on whether the study is scientific or politicized, it could lead to national, state-by-state or even city-by-city drilling delays, bans - or booms.
The industry and many states that have long experience with drilling and are confident the needed regulations, practices and testing procedures are already in place. They voice few worries, except over how long a life-cycle study could take or how political it might become. In fact, it’s a very useful tool.
But if a life-cycle study is warranted for hydraulic fracturing, because drilling might pass through subsurface formations containing fresh water, similar studies are certainly called for elsewhere: wind turbine manufacturing, installation and operation, for instance.
Turbines require enormous quantities of concrete, steel, copper, fiberglass and rare earth minerals - all of which involve substantial resource extraction, refining, smelting, manufacturing and shipping. Land and habitat impacts, rock removal and pulverizing, solid waste disposal, burning fossil fuels, air and water pollution, and carbon dioxide emissions occur on large scales during every step of the process.
Over 95% of global rare earth production occurs in China and Mongolia, using their technology, coal-fired electricity generation facilities and environmental rules. Extracting neodymium, praseodymium and other rare earths for wind turbine magnets and rotors involves pumping acid down boreholes, to dissolve and retrieve the minerals. Other acids, chemicals and high heat further process the materials. Millions of tons of toxic waste are generated annually and sent to enormous ponds, rimmed by earthen dams.
Leaks, seepage and noxious air emissions have killed trees, grasses, crops and cattle, polluted lakes and streams, and given thousands of people respiratory and intestinal problems, osteoporosis and cancer.
In 2009, China produced 150,000 tons of rare earth metals - and over 15,000,000 tons of waste. To double current global installed wind capacity, and produce rare earths for photovoltaic solar panels and hybrid and electric cars, China will have to increase those totals significantly - unless Molycorp and other companies can rejuvenate rare earth production in the US and elsewhere, using more modern methods.
Made in China turbines are shipped to the USA, trucked to their final destinations, and installed on huge concrete platforms; new backup gas generating plants are built; and hundreds of miles of new transmission lines are constructed. That means still more steel, copper, concrete, fuel and land. Moreover, the backup power plants generate more pollution and carbon dioxide than if they could simply run at full capacity, because as backups for turbines they must operate constantly but ramp up to full power, and back down, numerous times daily, in response to shifting wind speeds.
Wind farms require roads and 700-1000 ton concrete-and-rebar foundations, which affect water drainage patterns in farm country. The 300-500 foot tall turbines affect scenery, interfere with or prevent crop dusting over hundreds of acres, and kill countless birds and bats. Farmers who lease their land for wind turbines receive substantial royalty payments; neighbors are impacted, but receive no compensation.
Despite these ecological costs, wind farm projects are often fast-tracked through NEPA and other environmental review processes, and are exempted from endangered species and migratory bird laws that can result in multi-million-dollar fines for oil, gas and coal operators, for a fraction of the carnage.
Perhaps worst, all this is supported generously by renewable energy mandates, tax breaks, feed-in tariffs, “prioritized loading orders,” and other subsidies, courtesy of state and federal governments and taxpayers. In fact, wind power gets 90 times more in federal subsidies than do coal and natural gas, per megawatt-hour of electricity actually generated, according to US Energy Information Administration data. And wind-based electricity costs consumers several times more per kilowatt-hour than far more reliable electricity from coal, gas and nuclear power plants.
Simply put, the wind might be free, when it blows. But the rest of the “renewable, green, eco-friendly” wind energy system is anything but.
It might be far better all around to simply build the most efficient, lowest-polluting coal, gas and nuclear generating plants possible, let them run at full capacity 24/7/365 - and just skip the wind power.
Life-cycle studies would be a positive development - for all energy sources. In fact…
“Think globally, act locally” might be a very good motto for EPA and wind energy advocates.
Paul Driessen is senior policy advisor for the Committee For A Constructive Tomorrow and Congress of Racial Equality, and author of Eco-Imperialism: Green power - Black death.
In an apparent bid to counter skepticism of the specious claim that global warming caused the string of heavy snowfalls in the US and Europe this winter, a media teleconference with “two leading climate and weather experts” has been scheduled for Tuesday, March 1, 2011. Mark “death spiral” Serreze and Jeff Masters will “discuss how a rise in the number of snowfalls of 6 inches or more may be related to an increase in moisture in the atmosphere,” allegedly due to global warming.
Major problems with this argument include weather balloon and satellite data showing that 1) tropospheric relative and specific humidity has significantly declined since the ‘safe CO2 levels’ of 1948, 2) atmospheric water vapor has declined since satellite measurements began in 1983, 3) there has been no statistically significant global warming since 1995, and 4) the IPCC predicted milder winters and that the “milder winter temperatures will decrease heavy snowstorms.”
From the excellent site Climate4you.com: Specific atmospheric humidity (g/kg) at three different altitudes in the lower part of the atmosphere (the Troposphere) since January 1948. The thin blue lines shows monthly values, while the thick blue lines show the running 37 month average (about 3 years). Data source: Earth System Research Laboratory (NOAA). Data description by Kalnay et al. (1996). Last month shown: January 2011. Last diagram update: 13 February 2011.

Most climate models assume that as an increasing amount of atmospheric CO2 induces slightly increasing atmospheric temperatures, the overall evaporation will increase from the planet surface, and thereby the specific humidity of the lower part of the atmosphere (the Troposphere) will increase as well. As water vapour is the most important greenhouse gas, additional warming will come about, resulting in a much larger temperature increase than that induced from CO2 alone. Climate models therefore, in general, assume the relative Tropospheric humidity to remain more or less stable, as increasing air temperatures are compensated by increasing specific humidity.
The above diagrams indicate that none of this has been the case since 1948. Only near the planet surface, the relative humidity has remained roughly constant (although with variations), but in the remaining part of the Troposphere below the Tropopause the relative humidity has been decreasing. Even for the specific humidity, this appears to be the case.
MEDIA ADVISORY AND DAYBOOK ITEM FOR TUESDAY, MARCH 1, 2011
CONTACT: Randy Rieland, Union of Concerned Scientists, 202-331-6959
TELEPHONE PRESS CONFERENCE
CLIMATE EXPERTS TO LOOK BACK AT WILD WINTER OF 2010-2011 AND EXPLAIN THE LINK BETWEEN HUGE SNOW STORMS AND GLOBAL WARMING.
SCIENTISTS ALSO WILL LOOK FORWARD AT THE IMPACT EXTREME WINTER WEATHER EVENTS COULD HAVE THIS SPRING
The Union of Concerned Scientists (UCS) will hold a telephone press conference featuring two leading climate and weather experts explaining what is behind the string of heavy snowfalls in the U.S. and Europe this winter and put the extreme weather in the context of climate change.
They will discuss how a rise in the number of snowfalls of 6 inches or more may be related to an increase in moisture in the atmosphere and how Arctic warming and the shrinking of Arctic sea ice to record lows also may have been a factor in generating major winter storms.
Looking ahead, the scientists will talk about what we can expect in the coming months as the potential combination of earlier spring weather and deep snowpack raises the threat of serious flooding, particularly in the upper Midwest.
WHO
Mark Serreze, director of the National Snow and Ice Data Center, Boulder, Colorado
Jeff Masters, director of Meteorology at Weather Underground
Todd Sanford, climate scientist, Union of Concerned Scientists
WHEN
Tuesday, March 1, 2011, 11 a.m. EST
WHERE
The comfort of your own office. Call: (866) 961-7940; Conference ID: UCS winter and climate change teleconference
Icecap Note: Be sure to dial in and express your opinion if the opportunity arises.
See how precipitable water is below normal (blue and purple) this winter in the areas of heavy snows. Ocean temperatures are below normal around these areas as well. Jeff Masters has my respect for his fine work on Wundergorund and as a hurricane forecaster, but he has aligned himself with folks and dogma that will hurt his future reputation. I think Serreze is an opportunist not to be trusted and the UCS is an enviro group posing as scientists and should always be ignored. They were front and center in 2007 on Mt Washington telling ski areas and the maple sugar industry that global warming ensured warmer winters, much less snow now they are organizing a teleconference to state the opposite.
See also this report from Chicago about the snowblitz in February. This is the snowiest February on record for Chicago. Four of the top ten snowiest Februarys in Chicago have occurred since 2007. Also it snowed in the Los Angeles area today - see pictures from Burbank and Los Angeles Universal City here.
By BWoods, RealClimategate
Judith Curry has tackled the ‘Hide the Decline’ issue at her blog Climate Etc. The issue is that data was hidden from policymakers (and the public) so as to present a ‘simpler’ message… and other data spliced in to perhaps give a very different message?
Remember it is all about the idea of ‘unprecedented’ global warming because the politicians, media and public were warned by graphs like this…

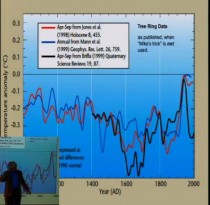
Tree ring data - Thermometers spliced in.
Tree Ring Data.
In the video link in Judith Curry’s article the second graph is how ‘all scientists at Berkeley’ would present the data.
The fact that the proxies temperature decline when the thermometer readings are going up, would indicate that they are NOT a good proxy for past temperature. As temp reconstructions proxies (tree rings) were used to explain or ‘sell’ the idea that modern temperatures were ‘unprecedented’ so global warming ‘must’ be down to humans and that policy makers should something now.
I think even the most unscientifically trained politician, person in the media and member of the public can now see the problem with proxies, especially if you look at the 2 graphs above. The screen captures are from the video Judith Curry links to (part I):
No point talking here about it here, go to where the debate is: here, here, here.
At the Bishop Hill blog, at least one scientist has chimed in to support Professor Judith Curry
Professor Jonathon Jones (Physics - Oxford University)
People have asked why mainstream scientists are keeping silent on these issues. As a scientist who has largely kept silent, at least in public, I have more sympathy for silence than most people here. It’s not for the obvious reason, that speaking out leads to immediate attacks, not just from Gavin and friends, but also from some of the more excitable commentators here.
Far more importantly most scientists are reluctant to speak out on topics which are not their field. We tend to trust our colleagues, perhaps unreasonably so, and are also well aware that most scientific questions are considerably more complex than outsiders think, and that it is entirely possible that we have missed some subtle but critical point.
However, “hide the decline” is an entirely different matter. This is not a complicated technical matter on which reasonable people can disagree: it is a straightforward and blatant breach of the fundamental principles of honesty and self-criticism that lie at the heart of all true science. The significance of the divergence problem is immediately obvious, and seeking to hide it is quite simply wrong. The recent public statements by supposed leaders of UK science, declaring that hiding the decline is standard scientific practice are on a par with declarations that black is white and up is down. I don’t know who they think they are speaking for, but they certainly aren’t speaking for me.
I have watched Judy Curry with considerable interest since she first went public on her doubts about some aspects of climate science, an area where she is far more qualified than I am to have an opinion. Her latest post has clearly kicked up a remarkable furore, but she was right to make it.
The decision to hide the decline, and the dogged refusal to admit that this was an error, has endangered the credibility of the whole of climate science. If the rot is not stopped then the credibility of the whole of science will eventually come into question.
Judy’s decision to try to call a halt to this mess before it’s too late is brave and good. So please cut her some slack; she has more than enough problems to deal with at the moment.
If you’re wondering who I am, then you can find me at the Physics Department at Oxford University.
See post. H/T Climate Depot
Project Description
The Berkeley Earth Surface Temperature Study has been organized under the auspices of the non‐profit Novim Group (http://www.novim.org). The project has the following goals:
1) To merge existing surface station temperature data sets into a new comprehensive raw data set with a common format that could be used for weather and climate research
2) To review existing temperature processing algorithms for averaging, homogenization, and error analysis to understand both their advantages and their limitations
3) To develop new approaches and alternative statistical methods that may be able to effectively remove some of the limitations present in existing algorithms
4) To create and publish a new global surface temperature record and associated uncertainty analysis
5) To provide an open platform for further analysis by publishing our complete data and software code as well as tools to aid both professional and amateur exploration of the data
Progress
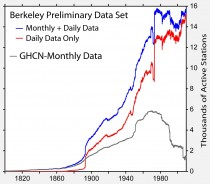
Preliminary Data Set
The Berkeley Earth Surface Temperature Study has created a preliminary merged data set by combining 1.6 billion temperature reports from 10 preexisting data archives (4 daily and 6 monthly). Whenever possible, we have used raw data rather than previously homogenized or edited data. After eliminating duplicate records, the current archive contains 39,390 unique stations. This is more than five times the 7,280 stations found in the GHCN (Global Historical Climatology Network) Monthly data set (GHCN‐M) that has served as the focus of many climate studies. The GHCN‐M is limited by strong requirements for record length, completeness, and the need for nearly complete reference intervals used to define baselines.
We believe it is possible to design new algorithms that can greatly reduce all of these requirements and as such we have intentionally created a more expansive data set.
See much more detail on the plan here.
Dr Singer was hopeful about the project as he wrote here. So is E.M. (Chiefio) Smith:
Their method has a pretty good chance of working.
1) Fixes the “baseline” problem. Right now there is a ‘cherry picked’ baseline in the cold 1/2 phase PDO. The move to a ‘present baseline’ in some suggested methods is usually immediately followed by comparing it to the just past cold period and saying “Look, still warming!”. By having each data series UP FRONT converted to an anomaly based on the data FROM THAT SITE ONLY and prior to homogenizing et. al. is a great improvement and eleminates many of the ‘games’. It’s very similar to what I did with the dT/dt method, but adds the use of segments of data for each change of thermometer regime. Nice.
2) Adds in more of the thermometers. This reduces the impact of airports ASOS and helps to eliminate the ‘cherry pick’ of warming stations in the present GHCN airport bias. Issues: A hugh number of thermometers are still at airports. Adding them in does not fix the airport problem. The metadata are still limited to whatever the provider has, so “pristing rural” may still mean “runway tarmac"… Needs validation / checking.
3) Least Squares method sounds like a good way to bias the data against bad stations, but I worry about things that in an automated way select to choose one thing over another. So, for example, might not those same “Major Airport ASOS” stations that are now deemed “best” for USHCN “QA” by NCDC continue to be seen as “best” and so given higher weighting? Impact depends on implementation. Needs watching. Could be good or bad depending.
4) Avoidence of Gridding: Yay! One of the things I did. It also, then, avoids the “make up data for empty grids” problem.... A key FUBAR in NCDC / GISS IMHO.
5) Overall, I’d give it an A- out the gate. Could end up a B or an A+ depending on execution. Beware of The Team trying to influence them doing it “the approved way"…
ICECAP NOTE: I am pleased this effort is ongoing. I expect they will find a reduced trend of warming because of being more inclusive and for all hte reasons EM Smith notes. The contamination by urban heat island and land use changes are likely though to still be present and unaccounted for.
Highly recommended reading from one of the very best Australian Journalists.
By Joanne Nova
After twenty years of drought predictions that turned out to be not worth a rhinestone rune-stone, the acolytes of the scare campaign were keen to find some evidence that they were still “right”. Two new papers came along showing that, golly, warming really “formally” “officially” caused floods after all, and they were just what the PR-doctor ordered. So the BBC, ABC, and the usual suspects rushed out to talk about how it was now “proven” that any flood was now officially man-made with a “robust” study and the “first scientific evidence” of a link. Richard Black even got excited that the study was based on “real world data”, which makes you wonder which studies used the fake sort?
If it’s all so definitively proven and obvious now that it’s a shame they didn’t think to join these dots, say, two years ago, so they could warn the world beforehand. It must be frustrating for them that they always seem to get the forecasts right two years too late. It’s another post hoc “prediction”.
And what are these two (TWO! shouted the believers) papers based on (AND don’t forget they’re from Nature)? The new-found certainty comes from about 50 years of records, interpreted by climate models, with those results then fed into precipitation models (just to magnify the error-margins even further). The handy thing about models is that if you try hard enough you can get nearly any result you want.
The Pall et al, 2011, abstract sums it up:
Here we present a multi-step, physically based ‘probabilistic event attribution’ framework showing that it is very likely that global anthropogenic greenhouse gas emissions substantially increased the risk of flood occurrence in England and Wales in autumn 2000. Using publicly volunteered distributed computing we generate several thousand seasonal-forecast-resolution climate model simulations of autumn 2000 weather, both under realistic conditions, and under conditions as they might have been had these greenhouse gas emissions and the resulting large-scale warming never occurred. Results are fed into a precipitation-runoff model that is used to simulate severe daily river runoff events in England and Wales (proxy indicators of flood events). The precise magnitude of the anthropogenic contribution remains uncertain, but in nine out of ten cases our model results indicate that twentieth-century anthropogenic greenhouse gas emissions increased the risk of floods occurring in England and Wales in autumn 2000 by more than 20%, and in two out of three cases by more than 90%.
Nature
Note that what we are not seeing here is an empirical study that found a correlation between past high CO2 era’s and more floods. That is difficult to get (and it’s absence doesn’t prove anything) but skeptics can point to those kinds of studies, for example, to show how cold periods kill more people.
We’re also not seeing one particular model which repeatedly has predicted (and in advance too) floods in England with a better-than-average ballpark accuracy - like Piers Corbyn has done with other events for over a decade.
Even the IPCC admits the climate models know not-much when it comes to predicting rainfall on a regional basis.
“The precise magnitude of the anthropogenic contribution remains uncertain” they say. I agree. It could be zero or something more, and it may or may not be related to CO2.
Seung-Ki Min et al 2011, in a similar vein says:
Here we show that human-induced increases in greenhouse gases have contributed to the observed intensification of heavy precipitation events found over approximately two-thirds of data-covered parts of Northern Hemisphere land areas. These results are based on a comparison of observed and multi-model simulated changes in extreme precipitation over the latter half of the twentieth century analysed with an optimal fingerprinting technique. Changes in extreme precipitation projected by models, and thus the impacts of future changes in extreme precipitation, may be underestimated because models seem to underestimate the observed increase in heavy precipitation with warming.
Like all unskeptical scientists of the IPCC-ilk, they argue from ignorance:
“We can now say with some confidence that the increased rainfall intensity in the latter half of the twentieth century cannot be explained by our estimates of internal climate variability,” she says.
Nature allows an editorial writer to proffer an opinion that couldn’t possibly ever, in any known universe, be substantiated: “There is no doubt that humans are altering the climate....”
Nature is not too scientific, but it does make a good advertorial newsletter for the eco-industrial-activists.
So the new “flood certainty” is based on the same models that get the upper tropospheric temperature trends wrong, disagree with 28 million weather balloons, 6000 boreholes, 3,000 ARGO floats, have little predictive success, don’t hindcast the medieval warm period, the holocene, or anything else much, and don’t match the empirical evidence, except with post hoc reanalysis. These were the same models that we relied on to build desalination plants we didn’t need; to avoid building levees and dams that we did.
It brings to mind the saying that’s fast becoming a cliche:
(Attributed variously to everyone from Bohr, to Einstein, Sam Goldwyn, Mark Twain, Churchill, Confucius, and also Yogi Berra).“It’s tough to make predictions, especially about the future.”
References:
Pardeep Pall, Tolu Aina, Daithi A. Stone, Peter A. Stott Toru Nozawa Arno G. J. Hilberts, Dag Lohmann & Myles R. Allen, 2011: Anthropogenic greenhouse gas contribution to flood risk in England and Wales in autumn 2000. Nature vol 470, pp 382–385 DOI:doi:10.1038/nature09762
Seung-Ki Min et al 2011, Xuebin Zhang, Francis W. Zwiers, Gabriele C. Hegerl 2011: Human contribution to more-intense precipitation extremes, Nature, vol 470 , pp 378–381
ICECAP NOTE: Nature like Science has become a propaganda arm for the AGW movement with no critical assessnment of the forced ‘psuedo-science’ practiced by those attempting to save their gravy train movement.