


By Joseph D’Aleo, CCM, AMS Fellow
All the data sources have now reported for global May temperatures with Hadley coming in today. University of Alabama MSU was the coldest with a -0.18C. RSS MSS was a close second with -0.083C. Hadley had a +0.278C and NASA GISS came in at +0.36C.
UAH and RSS MSU satellite data uses a base period (period over which monthly climatological averages are computed for the purposes of then determining departures from normal for any given month) of 1979-1998. NASA GISS uses the coldest period of the last century 1951 to 1980. Hadley uses 1961 to 1990 as a base period (with two cold decades and one increasingly warm). NCDC in their USHCN uses the entire period of record (back to 1895), in my mind probably the most reasonable since it includes two cold and two warm periods. Your local NWS uses the latest three complete decades (1971 to 2000) for it averages and to compute departures from normal. That is the long established standard for the local offices. You see there are no agreed to standards for the longer term records, so at least for anomalies, we are always comparing apples with oranges with pears with plums.
Obviously satellite provides the best coverage of the all but the polar land and oceans. The other data bases in addition to their differences in base periods, are at the mercy of the country governments data collection and have huge holes in the data over land and very spotty imperfect ocean temperature measurements, especially in the Southern Hemisphere.
There are other major issues with the global data bases. 2/3rds pf the world’s station dropped out after 1990 and the number of missing months in places like Asia and Africa increased tenfold. Siting has been shown so well by Anthony Watts at http://surfacestations.org to ba an issue with more than 2/3rds of the United States stations poorly sited. The importance of urbanization is underestimated thanks to the flawed research of Peterson and Parker in all the global surface data bases. Numerous peer-reviewed studies have shown that surface data bases may overestimate warming by up to 50%. And then there is the issue of the oceans which each of the data centers treat differently and now will likely change the data to better reflect a more gradual changeover from buckets to ship intakes. See more on that issue in Steve McIntyre’s Lost at Sea here.
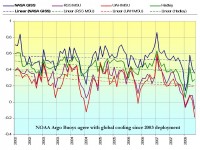
See larger image here
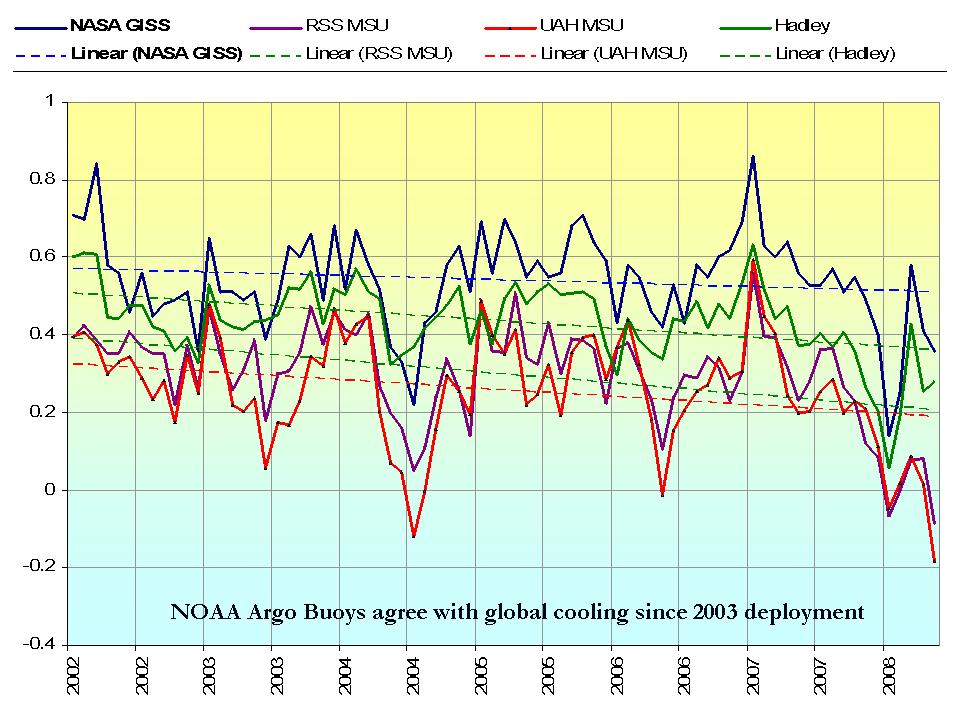
All four plotted data sets, yes even GISS, shows a decline since 2002. GISS has the largest positive anomaly because it uses the coldest base period. Satellites, the coldest since, their base period (by chance) was in the warmest decades (of the positive PDO with most El Ninos). Note how well the temperature variations have tied to the variations of ENSO (El Nino) in just the last decade, in this case using the Mulitvariate ENSO Index (MEI) of CDC’s Wolter. ENSO and the longer term PDO are the real drivers for decadal climate change, used to support the greenhouse gang from 1979 to around 2002 but now has them on the defensive. If the cooling continues as we believe it will, they will have to resort to even more creative data manipulation to keep the hoax alive. But this will become increasingly apparent because they have no control over the satellite measurements.
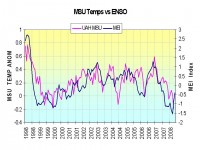
See larger image here
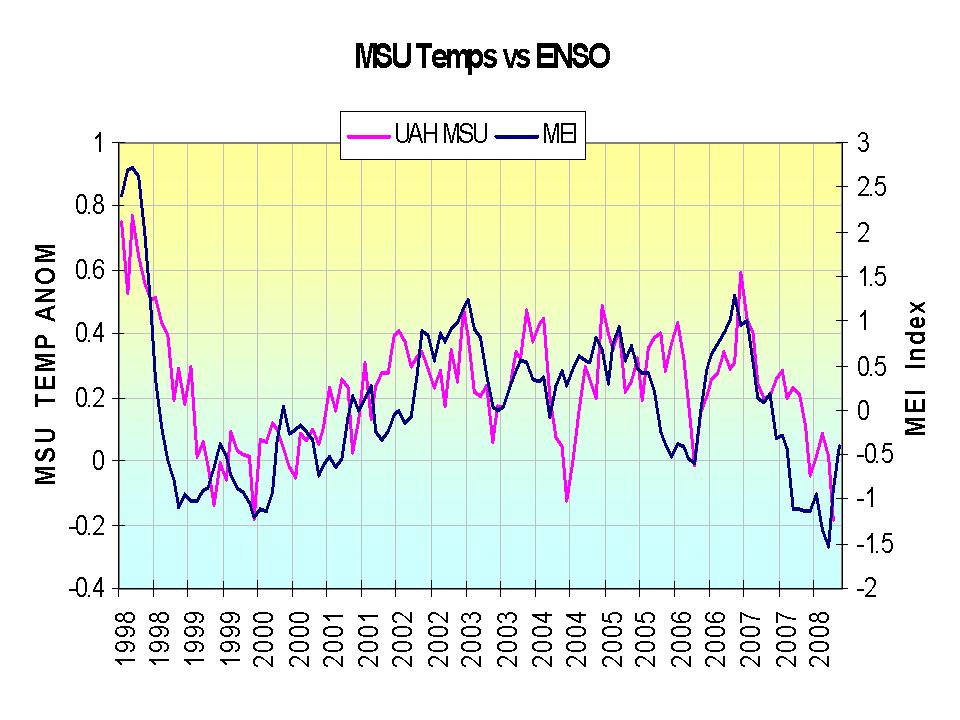